Dead Click Tracking: How to Use AI to Improve User Experience


A dead click is the earliest friction signal in your product. It’s the moment a user clicks something and nothing happens.
As head of product design at Userpilot, I spend a significant part of my week with session recordings, and dead clicks are among the first things I look for when a feature isn’t converting the way we designed it.
The real issue is this: most users won’t file a bug report when they hit one. Instead, they quietly conclude something’s broken and stop trying. It means you’ll never know the issue unless you dig further.
That’s where dead click tracking comes in.
In 2022, catching dead clicks meant manually building event tags or scrubbing through recordings looking for moments of user confusion. In 2026, tools like FullStory, Datadog, and Sentry surface dead click data, rage click data, and error click data automatically. The detection workflow has changed substantially.
There’s a complication worth knowing about, though.
AI agents interacting with your product through APIs and MCP don’t leave the same click traces that human users do. If agent traffic is a meaningful share of your product usage, your dead click data is getting noisier, as their clicks don’t get registered in session recordings or other product analytics tools.
I wrote this guide because most articles on dead clicks are still describing the 2019 workflow. This guide covers what you need to do in 2026.

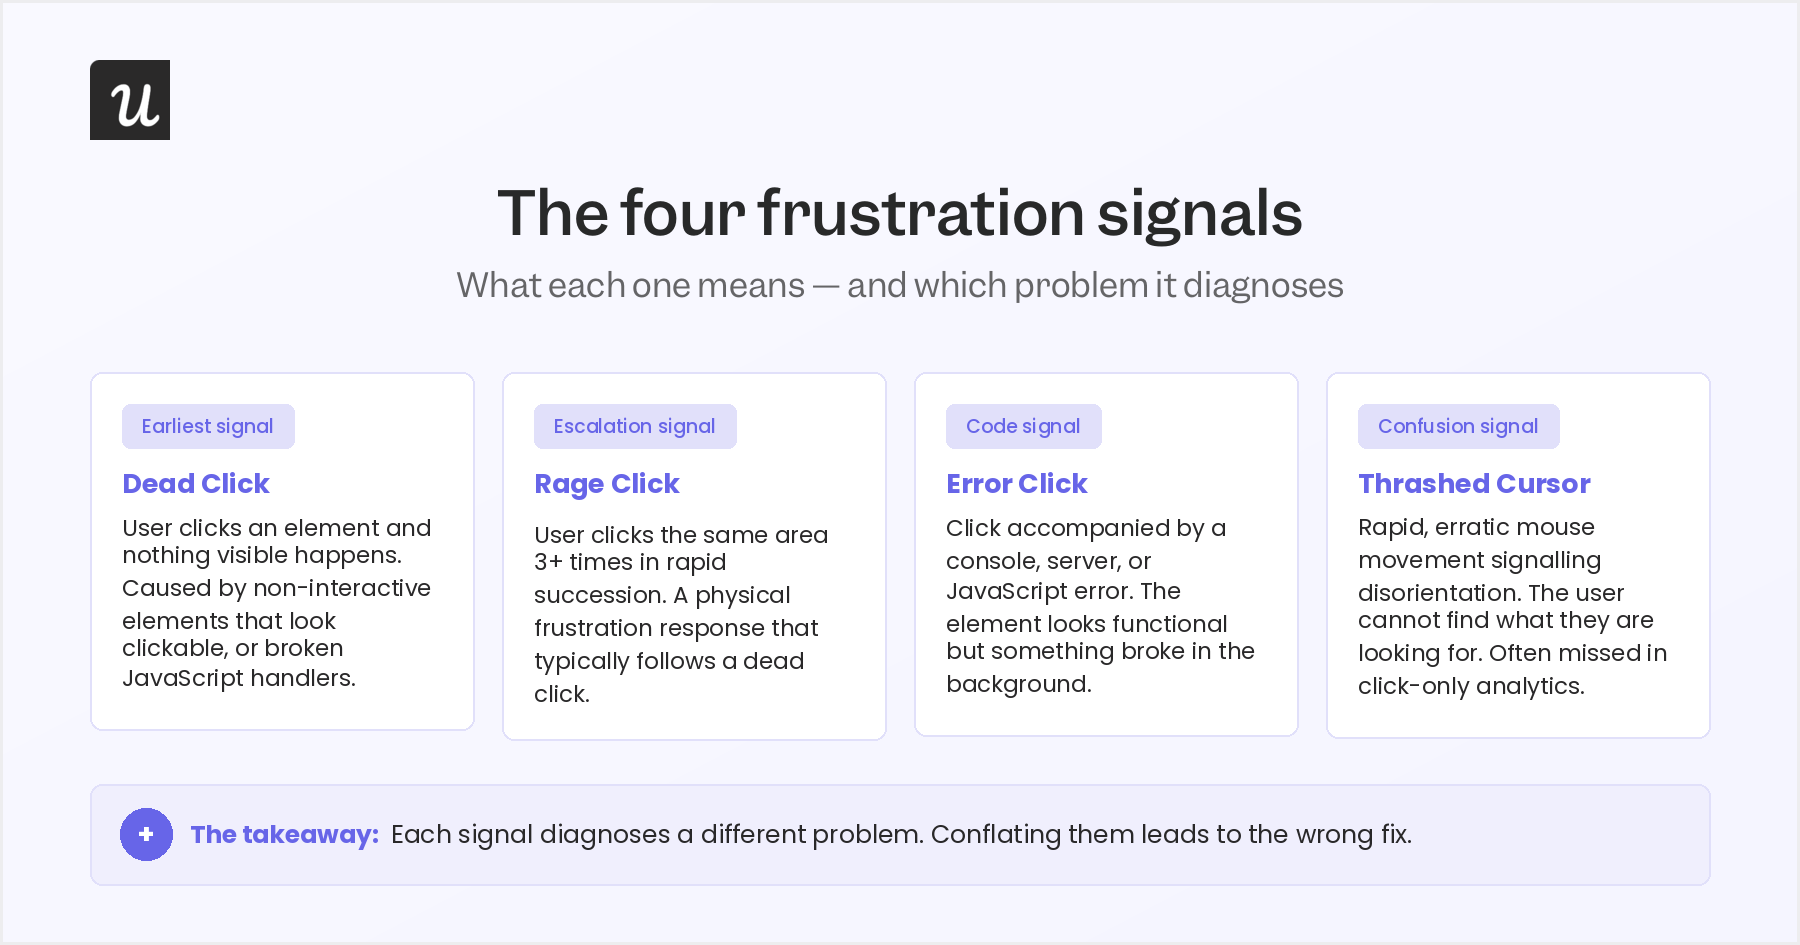
How dead clicks compare to rage clicks and error clicks?
A rage click is a physical frustration response. A user clicking or tapping on the same area multiple times in rapid succession. Rage clicks typically follow dead clicks, with the dead click being the UX failure and the rage click being the user’s escalating reaction to it. Most tools require three or more rapid clicks on the same element within a short window to classify the interaction as a rage click.
Likewise, an error click occurs alongside a console, server, or JavaScript error in the user session. The element might look functional on screen but might not work in the background. Error clicks and dead clicks can co-occur, but each diagnoses a different layer of the problem: one points at design, the other at code.
Yet another indicator is a thrashed cursor, which is a rapid, erratic mouse movement that signals disorientation or confusion about what to do next. It’s the easiest to miss in tools that only track click events. Together, these four signals give a much richer picture of where users interact with your product without getting what they expected.
Why you should track dead clicks
Dead clicks are one of the earliest signals of UX problems. They appear before users get frustrated enough to rage click, bounce, and leave a negative NPS response. From a design perspective, they’re the signal I can act on without waiting for a user complaint to surface the problem.
Their business impact compounds quickly.
Dead clicks lead to user confusion, higher bounce rates, poor engagement metrics, and lost conversions. And when they happen on the pages that matter most, such as activation flows, checkout, and key feature interfaces, it can impact your business.
The threshold that most practitioners use is around 10% dead click rate as acceptable. Above that, users are consistently encountering elements that don’t respond as they expect, and that warrants investigation.
Common reasons dead clicks happen
The causes of dead clicks fall into two buckets: misleading design and technical failure. Both these scenarios produce the same user experience (clicking and getting no response), but they require completely different fixes.
Misleading design
The most common source of dead clicks is a mismatch between how an element looks and how it behaves. Non-interactive elements that carry visual affordances will generate dead clicks. For instance, text that looks like a link because it’s underlined. Users apply design conventions when they interact with your product, not your internal documentation about what’s clickable.
Disabled buttons without a visible disabled state are one of the highest-density dead click sources I encounter in design reviews. When a button looks active but does nothing because a required field hasn’t been filled, every user who clicks it produces a dead click.
A clear visual indication of the disabled state (not just a subtly greyed version of the active style) resolves this without any engineering change.
Likewise, invisible overlapping elements (ads, banners, cookie notices, or modal overlays sitting on top of interactive elements) intercept clicks intended for what’s underneath.
Mobile users are disproportionately affected in this case, since small screens and imprecise touch input make the problem worse. For example, a dropdown opening on desktop might work perfectly, but the same interaction on mobile devices can be completely blocked by an overlay the user can’t see.
Technical failure
On the code side, broken JavaScript event handlers are the most frequent culprit. A broken click handler means an element fails to respond even though it looks functional. JavaScript errors in this category include hydration gaps in server-side rendered applications, where the UI renders before JavaScript finishes loading on the backend. When an early user click happens, it finds no handler attached to the element yet.
Silent API failures and invisible overlays round out the technical category. An unresponsive element waiting on a server response that never arrives accepts clicks but returns nothing. The user session shows the interaction and your error logs show the failure. You can use them to identify the issue and fix it.
Native frustration detection: The tools that surface dead clicks automatically
One of the biggest workflow changes since 2022 is that you no longer need custom event tags to find dead clicks. Several tools now surface dead click, rage click, error click, and thrashed cursor signals as default behavior. I’ve spent time with most of them, and the workflow difference between a manual tagging setup and native frustration detection is significant.
- FullStory pioneered the frustration signals taxonomy and records every user session by default. An AI layer automatically flags sessions containing frustration signals, and you can filter directly by signal type without touching your event tracking configuration.
- Datadog’s Real User Monitoring collects all three frustration signal types by default, without any additional setup. Dead, rage, and error clicks surface automatically in the session list alongside console logs and network activity. This shortens the debugging loop considerably since you can see associated errors in the same view.
- Sentry added dead click and rage click detection to its session replay product. Their framing is accurate: not every UX problem is an error. Dead clicks are failures that never throw an exception and would be entirely invisible to a pure error monitoring setup.
- LogRocket surfaces dead clicks and rage clicks in session replays and ties them to Redux state and network requests, so you can see exactly what was happening in the application at the moment the click occurred.
- Mouseflow’s Mina AI changes the interaction model considerably. Instead of manually filtering session recordings, you can ask natural-language questions about your session data and Mina surfaces relevant sessions and behavioral patterns in response. For teams that have historically found session replay too time-consuming to use regularly, this is a meaningful workflow improvement.
- Microsoft Clarity deserves a specific mention here. It’s free, shows dead click and rage click heatmaps out of the box, and has no hard cap on recordings. If you aren’t using a dedicated session replay tool, Clarity can help you see dead click data on your web product without any budget commitment.
- Inspectlet’s AI Session Insights automatically identifies rage clicks across sessions and surfaces patterns without requiring a manual review of individual recordings. This makes it useful for teams with high session volumes who can’t sample recordings by hand.
How to find dead clicks in your product
Knowing that dead clicks exist somewhere in your product is the starting point. Actually finding where they cluster requires combining a few different data sources.
- Watch session recordings: Session recordings are the most direct window into dead click behavior. Watching a recording tells you not just where the dead click occurred, but what the user was trying to accomplish, whether they retried, and whether they eventually found what they were looking for or left. If you use Userpilot, the built-in session recording tool enables you to track user activity and detect dead clicks.
- Tag UI elements and track engagement: Feature tagging adds precision on top of session recordings. By tagging specific elements (including non-interactive ones you suspect are generating dead clicks) you can measure exactly how often users click them and identify them at scale. This is how product analytics work closes the loop between design assumption and user behavior data.
- Identify pages with low engagement: Page-level analysis is a useful starting point for understanding the problem. To begin, identify your highest-value pages (activation flows, checkout, core feature dashboards) and look for ones that have a low engagement rate. Combining this data with heatmap analysis that shows concentrated clicks on non-functional areas can help you understand whether dead clicks are driving the friction.
- Tag NPS qualitative responses: Qualitative NPS data surfaces dead click patterns through the back door. Filtering detractor responses by tags like “bugs,” “broken,” or “nothing works” often points at the same friction areas your dead click data highlights. Userpilot’s NPS tagging lets you drill into segment-level qualitative patterns and connect them back to dead click data, closing the gap between what users say and what the session data shows.
The dead click triage flow
Knowing dead clicks exist isn’t the same as knowing which ones need to be fixed.
The dead click triage flow below gives you a framework for turning raw signal data into a prioritized action list. I use a version of this whenever we’re auditing a feature that’s underperforming.
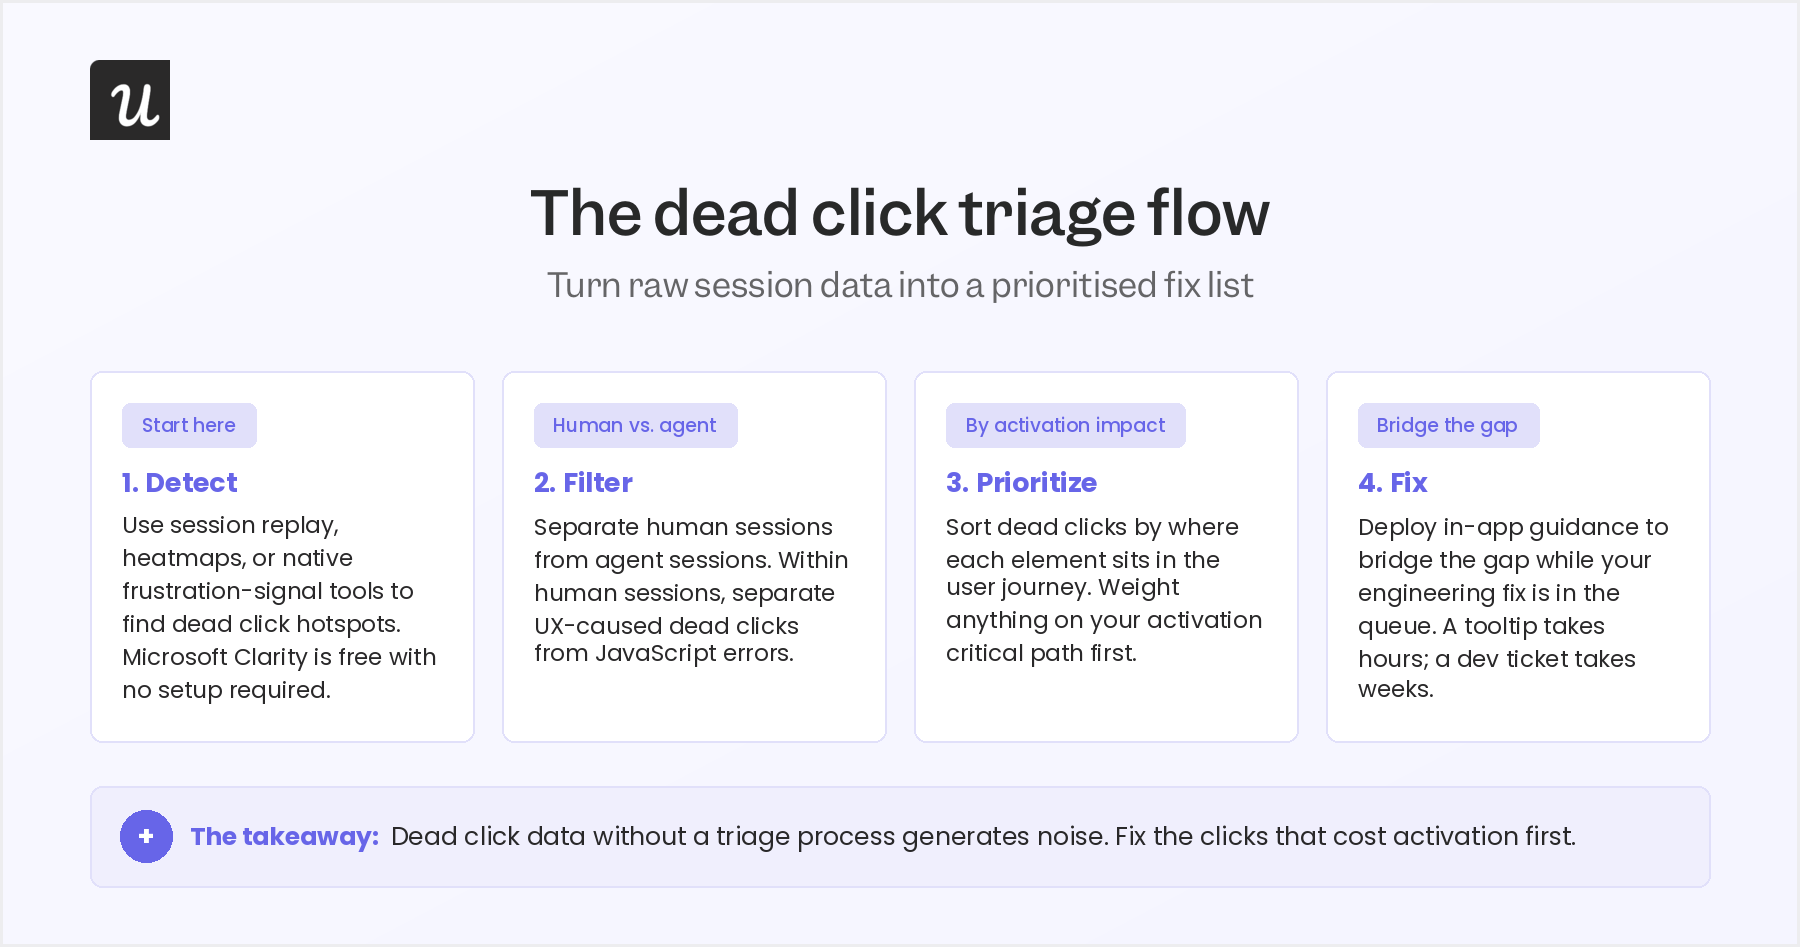
1. Detect
Use session replay, heatmaps, or a native frustration-signal tool to find where dead clicks are concentrated. You’ll get an output list of elements and pages with above-threshold dead click rates. If you’re not yet using a dedicated tool, Microsoft Clarity gives you this data for free with no event setup required.
2. Filter
Before acting on the data, separate it along two axes. First, separate human sessions from agent sessions (covered in detail in the next section). Second, within human sessions, separate UX-caused dead clicks from technically-caused ones.
Datadog’s RUM view helps with the second separation. It shows associated console logs and network activity alongside each dead click event, so you can immediately see whether the click came with a JavaScript error attached.
3. Prioritize by activation impact
A dead click on a decorative banner image carries almost no cost. On the flip side, dead clicks on a primary CTA or a key onboarding step costs conversions. You should sort your dead click list by where each element sits in the user journey. Anything on your activation critical path should be first. It’s also important to track whether mobile users are affected differently than desktop users.
4. Fix with in-app guidance
If the underlying fix requires an engineering ticket, you’re going to wait. In-app guidance bridges the gap in the meantime.
At Userpilot, when we identified a sharp funnel drop-off in the onboarding flow for our email feature, the first response wasn’t a development sprint. Abrar Abutouq, one of our PMs, describes what happened:
“Within a few hours, I just created a targeting tooltip and showed it to users and highlighted the correct steps for them to make it clear what to do next. That helped a lot on reducing friction and supporting users in real time without involving our dev team.”
The funnel drop-off closed within days. The tooltip wasn’t the permanent fix, but it worked while the permanent fix was in the queue. That’s the right model for step 4: in-app guidance as the short-term bridge, engineering as the long-term solution.
AI agents are making dead click data less reliable
Dead click data was built on the assumption that every session represents a human user navigating your product with a mouse or a finger. In 2026, that assumption is breaking for a growing number of SaaS products.
AI agents interacting with your product through APIs and MCP don’t click, scroll, or hover the way humans do.
Instead, they call functions, trigger events, and execute workflows without producing any of those interaction patterns. It makes dead click detection tools blind to them.
So, when agent sessions appear in your session replay data, their behavior looks nothing like a frustrated human.
This can skew your aggregate frustration metrics if you’re not filtering by session type.
The practical fix here is to filter for human sessions specifically before running any dead click analysis.
If you’re unsure what percentage of your traffic is agents, your session replay tool’s user-agent filtering is the starting point. By applying this filter, you can get a more accurate idea of your dead clicks.
AI-driven insights speed up dead click analysis
The agent complication above is the bad news. But the better news is that AI has also made the human-side dead click workflow dramatically faster, and it’s the part of this story I find most useful day-to-day.
The old workflow involved a lot of steps. You had to watch session recordings, identify spots for dead clicks, and try to fix them. The bottleneck was always the watching step. Session recordings are rich data, but they’re slow to consume at scale. And let’s be honest, most product teams sample too small a slice to draw reliable conclusions.
Userpilot’s Lia changes that workflow for teams using our platform. Instead of filtering and watching recordings, you ask questions in plain language and get surfaced session patterns in response. Yazan Sehwail, our CEO, framed the shift well:
“If you as a marketer wanted to see, using session replay, NPS data, survey data, and product usage data, you’re able to get your answer without having to go to Userpilot, without having to pull data and upload it to someone. So this is why MCP is gonna be a game changer.”
For teams that have historically skipped session replay because it’s too time-intensive, the AI layer is what makes the workflow practical, cutting insight time from hours to minutes.
How to act on dead click data and reduce user frustration
Here are the most effective tactics for fixing dead clicks across both root cause categories.
Audit for false affordances
Work through your highest-traffic pages and strip visual cues from any element that isn’t interactive. Only interactive elements should carry affordances like underlines, hover effects, or button-style styling. Decorative elements, such as images and background shapes, should look static.
Disabled buttons need a clear visual disabled state that communicates unavailability. A faintly greyed version of the active style doesn’t cut it. This is the category of fix that requires zero engineering involvement and produces immediate results.
Fix the technical stack
For JavaScript-error-related dead clicks, the fix starts with logging. Every broken click handler should surface a visible error in your monitoring stack so the dead click event and the underlying code failure are connected in the same investigation view.
Hydration gaps in server-side rendered applications require specific attention to load sequencing. Interactive elements shouldn’t receive user focus before their event handlers are attached to the DOM.
Use in-app guidance to bridge the gap
For dead clicks caused by confusing UX rather than broken code, in-app guidance is the fastest fix available while your design queue catches up.
For instance, you can place a contextual tooltip near a commonly dead-clicked element, directing users to the correct action. It takes just hours to build and can close the conversion gap immediately.
Onboarding checklists work especially well for new users who dead-click because they don’t yet have a mental model of your product’s navigation conventions.
Collect feedback to find out why
Dead click data shows you where the problem is. But user feedback tells you what users expected to happen.
Running a short micro-survey near a known dead click hotspot often surfaces the design assumption gap faster than session data alone, since combining behavioral data from session replay with qualitative responses is the shortest path to understanding what the fix needs to achieve.
Start with the friction you can already see
Dead clicks accumulate quietly in your session data while users grow frustrated and leave. The tools to surface them automatically are better than they’ve ever been. For instance, Userpilot’s Lia makes querying that data in plain language practical, and in-app guidance can bridge the gap while permanent fixes are in the queue.
If you want to see how Userpilot’s Session Recording, feature tagging, Lia, and in-app guidance work together to find and fix dead clicks, get a free demo.
About the author