User Experience Survey Questions I’m Using for My UX Research Job in 2026



The best user experience survey questions are the ones that get answered, provide high-quality user feedback that informs UX decisions, and lead you to improve your product.
However, about 93% of customer feedback never gets analyzed, and 87% of teams still code responses by hand. This means that, without a solid process and effective questions, there’s still a high chance you’ll never do anything meaningful with surveys (even if you successfully send surveys and receive responses).
So instead of listing a gazillion question examples without context, I’ll cover what makes a good survey question, explain some of the questions I use in my UX research work, and list the best practices for handling UX feedback in 2026.

What makes a good UX survey question
A UX survey is not a general customer questionnaire. Its job is to improve how people experience your product, so every question should trace back to a UX goal: task success, ease of use, perceived value, or the friction in between.
However, the way you write a survey question impacts the quality of your data. Nielsen Norman Group’s survey question research shows that biased phrasing, double-barreled questions, and unbalanced scales quietly corrupt your survey data before analysis even starts.
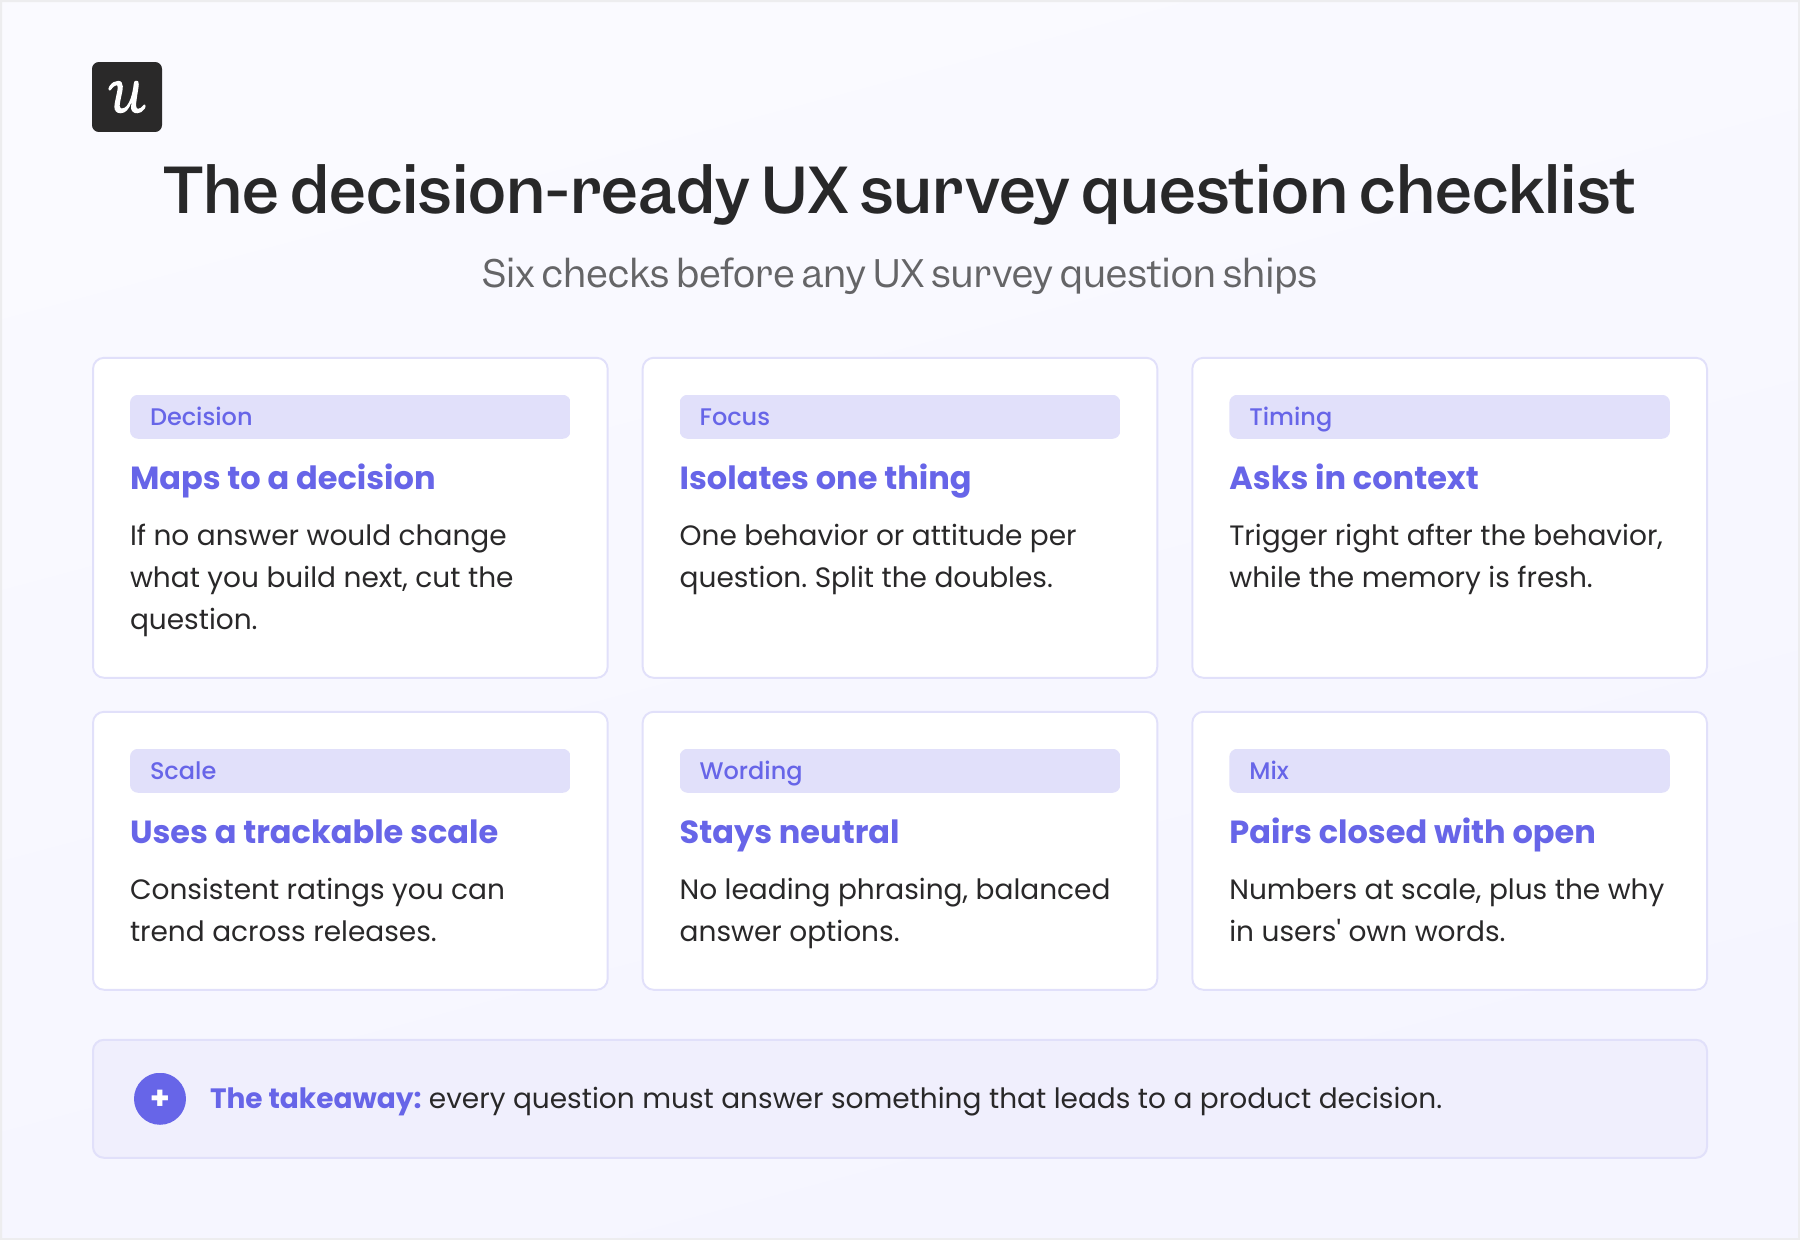
So whenever I create a new survey, I make sure it:
- Maps to a decision: Any survey must help you decide what you’ll need to design next. For example, “How easy was it to complete this task?” lets you decide whether to redesign a flow.
- Asks about one thing at a time: E.g., “How satisfied are you with our speed and reliability?” is two questions in a trench coat.
- Reaches users in context: Trigger the question right after the user performed a relevant action, when the experience is still fresh in their mind.
- Stays neutral: The question should be unbiased so the user can respond based on their honest opinions (instead of implying a “correct” answer).
How your survey questions should not be
While surveys are very easy to create and distribute, the wrong survey question can completely mislead your decisions. These are some of the patterns you should avoid to prevent survey bias:
- Leading questions: Leading questions influence respondents to answer positively. For example, “How much do you love the new dashboard?” assumes the user loved the experience and even expects it.
- Hypothetical questions: People are unreliable predictors of their own future behavior. Questions like “Would you use an AI assistant?” that ask users about what they might do provide hypothetical data that doesn’t reflect real pains or use cases.
- Questions you can answer with analytics: Asking “how often do you use reports?” is something your product usage metrics can tell you with more precision. Instead, you should ask more qualitative questions about why they dropped off from a feature or if/what they like about it.
- Jargon-heavy questions: Any question that requires any technical or insider knowledge of your product. E.g., “How would you rate the performance of our CDN?” is meaningless to most users.
- Too many questions: Survey fatigue is real. Medallia found an 11% year-over-year drop across more than 600 enterprise customer experience programs. Today, survey questions are better triggered inside your app and include, at most, a one-click question with an open-ended form.
My favorite user experience survey questions
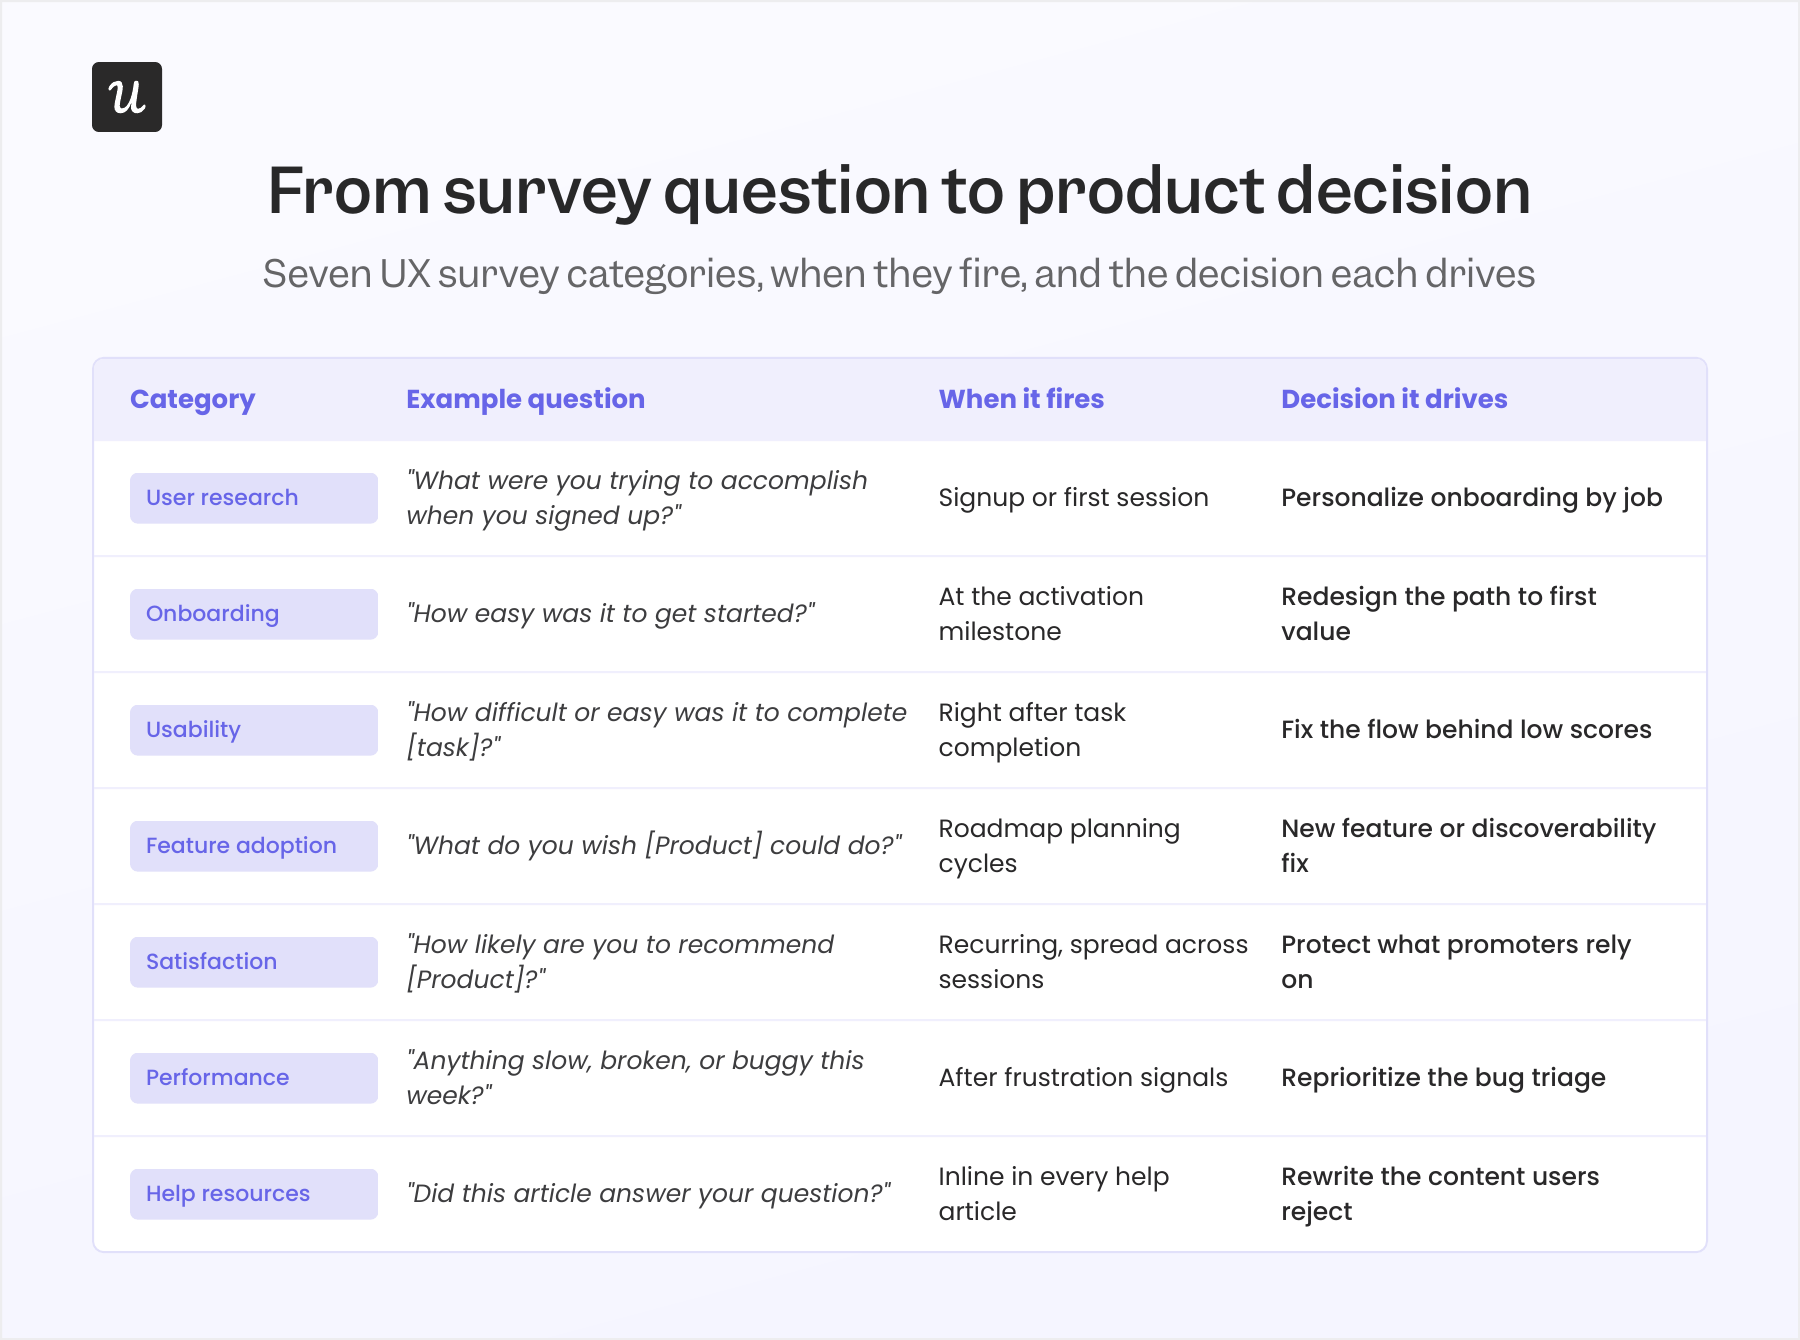
As I mentioned, the best survey questions should help you make UX-related decisions. So, I’m covering my favorite questions for different purposes, including:
- User research
- User onboarding experience
- Usability
- Feature adoption
- User satisfaction
- Product performance
- Customer service
User research questions
Before I can judge what parts of the product work, I need to know who I’m designing for and what job they hired the product to do. These questions help understand user personas and set the baseline for every other piece of user research.
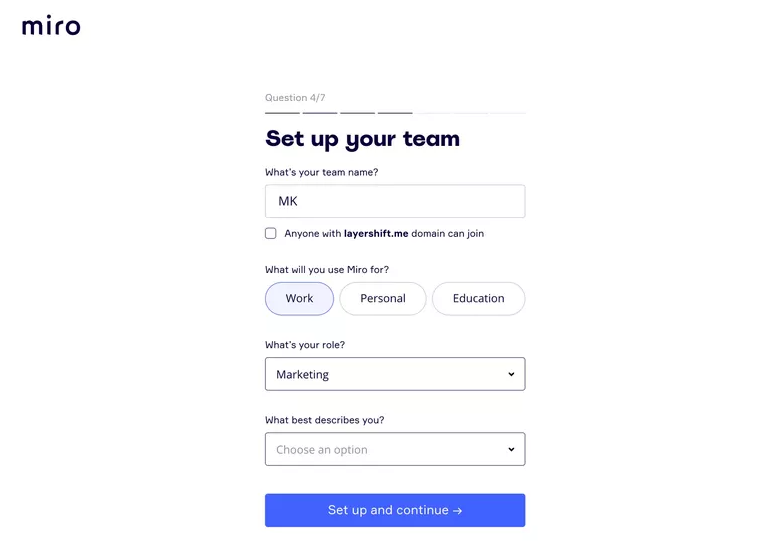
1. What were you trying to accomplish when you signed up for [Product]?
This is the jobs-to-be-done question. It tells you which use cases are most common for each user segment, which lets you personalize the product experience instead of showing everyone the UI.
It’s best to trigger it during signup or the first session of every new user. It can include a multiple-choice question to make the analysis easier, with an “other” field for different answers. With enough data, it lets you connect and segment users based on their JTBDs and create user personas to better understand their goals inside your product.
Question variations:
- What will you be using [Product] for?
- Which of these best describes your role?
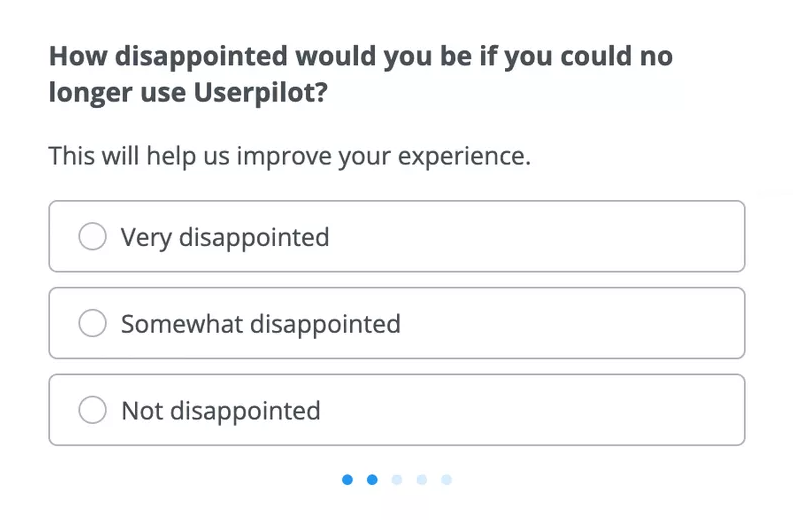
2. How disappointed would you be if you could no longer use [Product]?
This is the classic product-market fit survey question. It tells you whether your product has achieved product-market fit if 40% or more respondents choose “very disappointed”.
Ask it to users with enough activity to have an opinion, typically 2 to 4 weeks of active use, skipping brand-new users without experience.
To analyze the results even further, you can segment the “very disappointed” group and study what they do differently in the product compared to the others. Their behavior might indicate the most valuable parts of your product.
3. How would you describe [Product] to a colleague?
This open-ended question helps you understand a user’s mental model. The vocabulary people use is the vocabulary your navigation, labels, and positioning statements should use. You can send it occasionally to a sample of established users; it’s not something you should ask all the time.
To analyze it, break down and categorize the language into themes to compare it against your product positioning. If there are discrepancies, please reconsider your messaging strategy.
Question variation: “How would you describe [Product] in one word or sentence?”
Onboarding experience questions
Onboarding is where UX problems are most expensive, because users who stall here rarely come back to report it. Surveys at this stage catch the friction in the first sessions with your product, so you can fix it and retain more customers.
4. How easy was it to get started with [Product]?
This simple rating scale question measures how frictionless your onboarding experience is. It won’t diagnose anything by itself, but can prompt you to investigate your onboarding flow if the score is too low.
Trigger this question right after the user hits their activation milestone, not after signup, so they rate the full path to value. Once you have enough data, track the average by signup cohort and persona segment. When one segment scores noticeably lower, watch their onboarding sessions (with replays) before making assumptions.
5. Was anything confusing or missing while you were setting up?
This is an open-ended version of the last question. It lets users describe the exact step that confused them and provide more actionable insights.
Send it at onboarding completion for everyone, and at abandonment for users who stall mid-setup. After collecting many responses, categorize them and prioritize fixing the most recurring point of friction (pro tip: You can add tooltips or user onboarding checklists inside your app using no-code DAPs like Userpilot).
Question variations:
- What almost stopped you from finishing setup?
- What do you wish you’d known before you started?
Usability questions
Usability surveys quantify what a moderated usability test shows in depth: whether people can complete tasks without friction.
For this, you can use the System Usability Scale (SUS) (a 10-item questionnaire scored from 0 to 100), as it remains the fastest way to benchmark overall usability against decades of prior studies. You can also use single-item questions like the ones below for more specific insights.
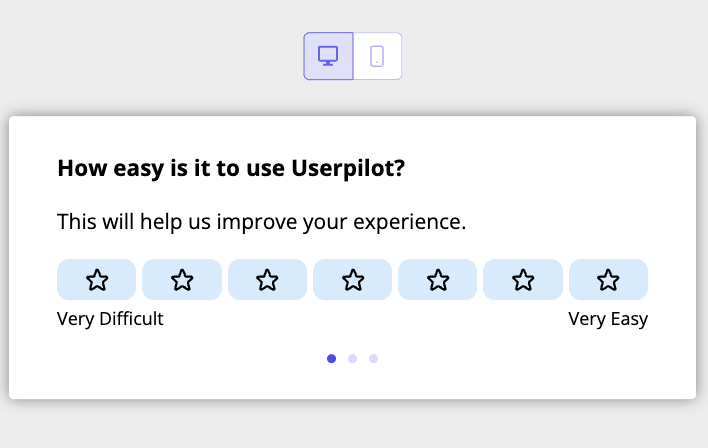
6. How difficult or easy was it to complete [task]?
The Customer Effort Score (CES) measures how much effort it takes to interact with your product. It helps you find usability problems at different parts of your product.
It should trigger after the user completes a task so that users can speak from a recent experience. In Userpilot, for example, I can set up this question to show up with an in-app event related to what I’m investigating.
For best results, track this score on different tasks or features. Then, segment the low scorers and watch their session replays to see the friction they experienced.
7. Did that error message help you understand what to do next?
Error states are where products bleed trust, and Nielsen’s usability heuristics devote an entire principle to helping users recognize and recover from errors. This question tests your error messages right with your users.
To use it, trigger it after a user encounters a tracked error event and then remains in the product. Keep it to one yes/no plus an optional comment to minimize friction. Then, rank error messages by “no” rate and rewrite your error messages to test again.
Question variation: “What were you trying to do when this error appeared?” It captures the intention behind their actions, which led to an error.
Feature adoption questions
Adoption questions give you more context on the features that users engage with vs. those they ignore.
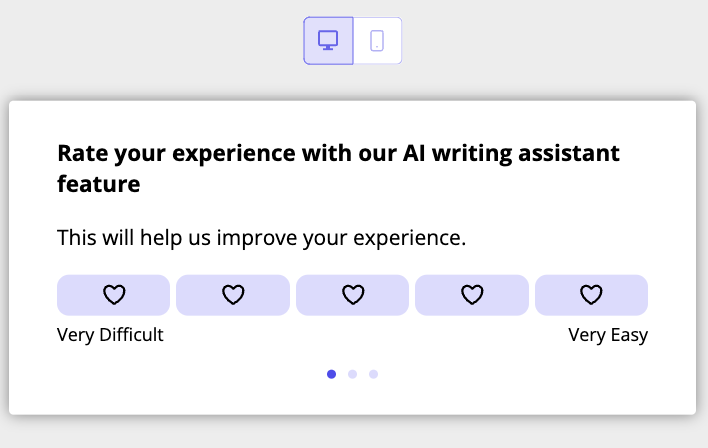
8. How was your experience with [Feature]?
This is a rating-scored question to collect specific customer feedback for single features. A feature feedback survey like this lets you decide whether to keep developing a feature or sunset it.
The right moment to send this question is after the second or third use, so users are already familiar with it.
To analyze, you can correlate it with usage frequency. A high rating with low usage might point to a discoverability problem, while a low rating with high usage points to a high-value problem that needs solving ASAP.
Question variations:
- Rate your experience with [Feature].
- How well did [Feature] do what you expected?
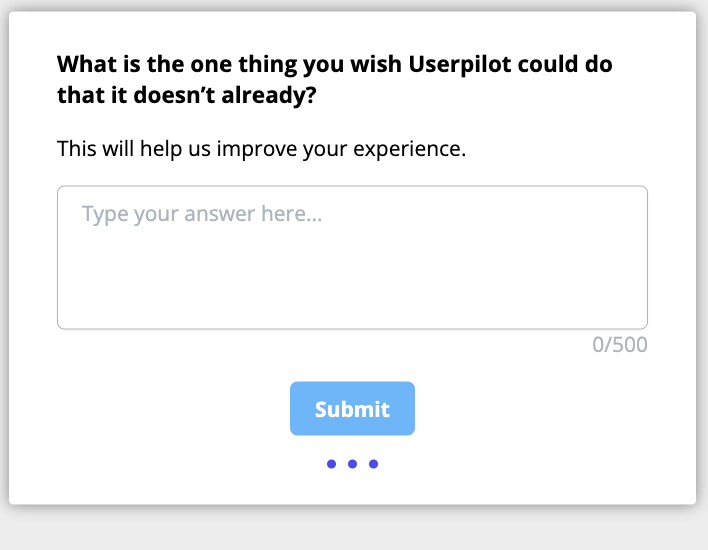
9. What is the one thing you wish [Product] could do that it doesn’t already?
This question is meant to spot feature gaps in your product. It lets you find users’ top pain point with your current feature set, so you can prioritize projects that are more likely to engage users.
To use it, it’s best to send it to power users during product roadmap planning cycles, as they’re the segment that’s most familiar with your product and getting the most value out of it. Then, categorize the answers to cross-check against your product analytics before adding them to the backlog.
User satisfaction questions
User satisfaction surveys give you quantitative data you can track over time, which lets you validate that your UX work is actually making users happier.
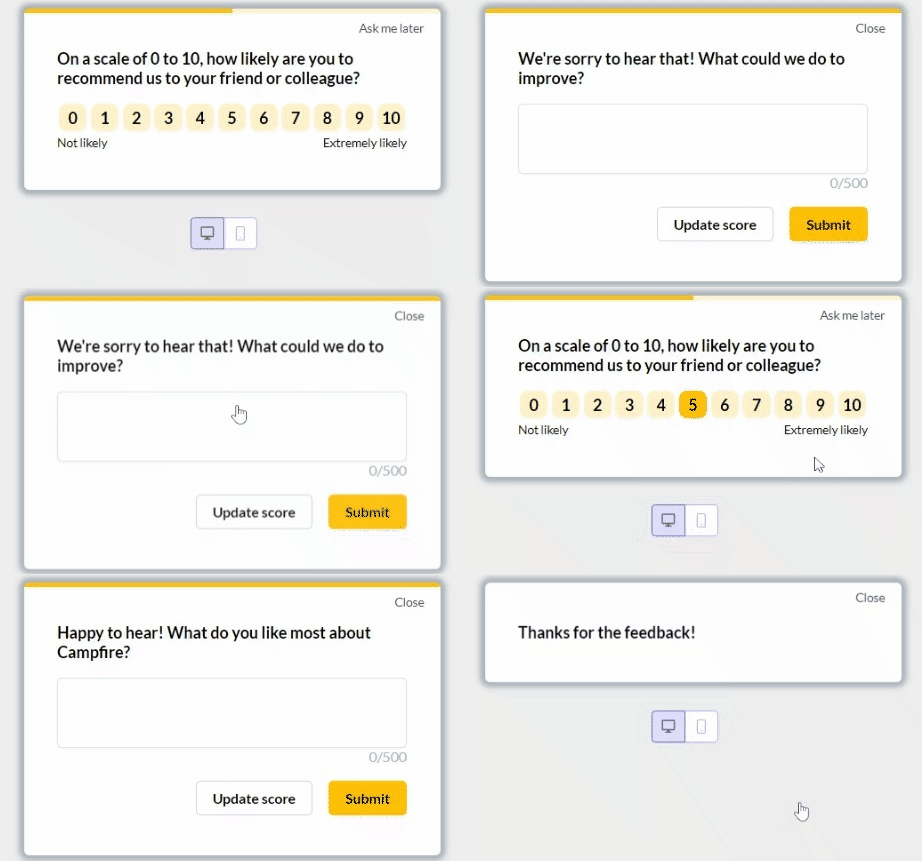
10. How likely are you to recommend [Product] to a friend or colleague?
The Net Promoter Score question is usually employed to measure customer loyalty. However, I’ve found that adding an open-ended follow-up question makes it much more insightful. You can run it on a recurring schedule (quarterly works for most SaaS products), and read the open NPS follow-up question by segment to find common themes across detractors and promoters.
Detractors’ feedback might point out friction points you can fix, and promoters’ comments can tell you what parts of your product are the most valuable.
11. How satisfied are you with [Product/Feature]?
The CSAT question, usually on a 1 to 5 scale, measures how satisfied users feel with your product or an experience.
I usually trigger it after meaningful milestones, like completing a project, publishing a first flow, or finishing a billing change. Then, I can track CSAT trends and investigate potential sources of friction.
12. What would make you stop using [Product]?
This is a churn-risk question you can ask while the user is still happy. Answers here might surface potential causes of customer churn that you’re ignoring, and you could design against before they become cancellation reasons.
You can either ask this question to active, healthy accounts, or make it a required question in your cancellation flow. Then, with enough answers, you’ll be able to correlate the most common answers with behavioral patterns from churned customers. If they overlap, then you can prioritize addressing the issue to prevent future churn.
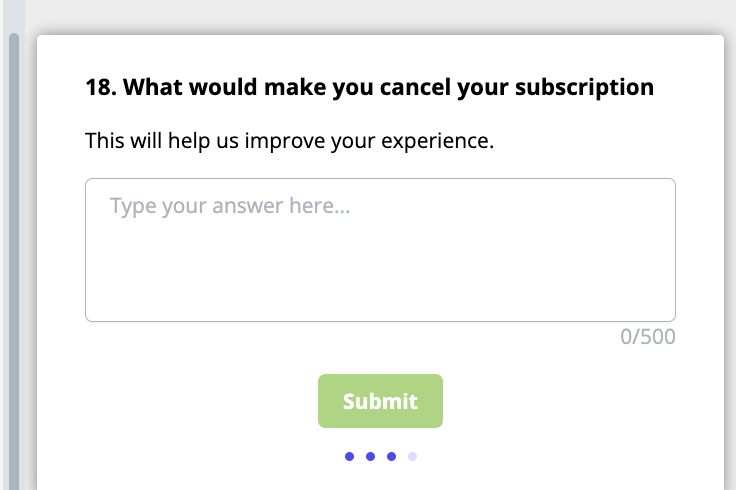
At the other end of the journey, the variation “What nearly stopped you from subscribing?” catches the same risks early.
Product performance questions
Perceived performance is part of user experience, and perception doesn’t always match your monitoring dashboards. A product can pass every automated check while feeling slow in the moments users care about, and these questions catch those moments of friction.
13. Have you run into anything slow, broken, or buggy this week?
A plain question that surfaces the pain points your error tracking might miss, like a report that technically loads but takes long enough that users open a spreadsheet instead.
I recommend sending it to a rotating sample of active users, or target accounts right after frustration signals like rage clicks or repeated page reloads. Once you have enough responses, route them straight into your bug triage, prioritized based on how many respondents mentioned the same issue. You can also combine this with session replays to find video-proof that the bug exists and make it easier for devs to fix.
Customer service and help resources questions
Support interactions and help content are part of the product experience, and they’re often where a struggling user forms their final opinion. These questions measure whether your safety net actually catches people.
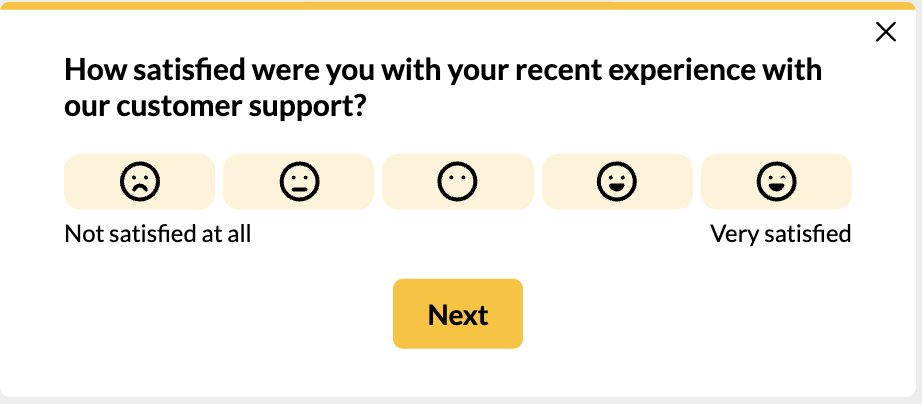
14. How satisfied are you with your support experience?
This question asks users how satisfied they feel with their support experience. It allows you to measure how reliable your customer service is.
The best time to send it is immediately after a ticket is resolved or a support conversation ends, while the issue is still fresh in their mind. Then, you can segment low satisfaction responses by issue category. If you spot a recurring low-satisfaction response for a specific issue, then you can come up with a self-serve solution to prevent users from opening a ticket in the first place.
15. Did this article answer your question?
This is a binary question you can embed at the end of each help article or resource center entry, with an optional comment. It’s a form of passive feedback where users can share whether the content is helpful.
If you collect enough answers, you can rank articles by “no” rate and cross-reference against ticket volume on the same topic. High “no” plus high tickets means the article needs a rewrite, and high “yes” plus low tickets means the article is doing its job.
UX survey questions best practices for 2026
Writing the questions is just one part of the process and doesn’t guarantee success.
These are the practices I hold my own surveys to:
- Trigger in context, in-app: Contextual microsurveys reach users at the exact moment of the experience, which is why in-app surveys average a 27.52% response rate while email surveys fight for scraps.
- Keep it short: Limit user surveys to 1-5 essential questions. Long questionnaires trade completion rates for data you probably won’t analyze anyway.
- Ask enough people before deciding: Consider your sample size and statistical significance before a survey result overrides other research methods.
- Mix quantitative and qualitative: Closed questions give you consistent, trendable numbers, while open prompts explain them.
- Respect the fatigue baseline: Your users are drowning in feedback requests from every app, airline, and dentist in their lives. Target precisely, cap frequency per user, and treat every survey view as a spend against limited goodwill.
- Close the loop: Reply to the users whose feedback changed something, and announce the fix in-app. A visible feedback loop is the single best predictor of whether people keep answering your surveys.
- Pair every survey with behavioral data: Feedback tells you what users think happened, and behavior shows what actually happened. You need both to gather critical insights you can defend in a roadmap debate. James Mitchinson, our Head of Customer Success, sees this kind of gap daily:
“Sometimes customers have a hard time articulating what is going wrong or what they’re experiencing frustration with. They might just say building a flow feels too hard, and it’s really nice to see what they mean by that by actually going and watching them go through that journey.”
- Verify AI analysis before it drives decisions: Although AI can help you sort your data, you can still find hallucinated findings and training-data bias. So always validate with your own eyes any work done by AI. Katie Kelly, a fellow UX researcher at Userpilot, used AI to theme survey responses and caught it inventing data:
“It gave me accounts of the themes… I realized that there was one or two answers that were hallucinated by the AI. So I had to go back in and delete them and make sure that they weren’t present in the counts.”
Turn survey answers into UX decisions
Using good questions in your surveys isn’t the hardest part. What makes surveys harder is orchestrating them in the most optimal way, sorting the data to analyze it, making the right decisions, and taking action on it.
Userpilot handles that whole cycle in one place. You can build and trigger every question in this guide off real product events without code, analyze the responses next to the behavioral data that explains them, and ship the resulting fix as an in-app experience the same week. Book a demo, and we’ll show you how it works on your own product.
About the author