UX Analytics: It’s Not Just About Data Collection and Methods


Without effective UX analytics that goes beyond collecting data, you’re losing valuable customers. Unfortunately, the research backs this up, with a staggering 90% of users reporting that they stopped using an app due to poor performance.
Poor performance includes slow loading times, complex design, confusing navigation, and unresponsive features. Basically, anything that ruins the user experience.
This article will help reduce such churn by refining your product management and UX analysis approach. It covers key topics, such as:
- Defining UX analytics.
- Why UX analytics should go beyond quantitative data.
- How to start your UX analysis.
- Methods for collecting and analyzing UX data.
- UX analytics tools worth considering.
What is UX analytics?
UX analytics involves gathering, analyzing, and interpreting data about how users interact with your product or service. It helps get a better understanding of user pain points and uncover improvement areas for enhancing the overall user experience.
UX analysis benefits product managers by providing data-driven insights to guide product development decisions and prioritize features. For product designers, it highlights usability issues, thereby informing design iterations and ensuring more customer-centered solutions.
Throughout this traditional definition, you’ll notice an emphasis on data, typically taken to mean quantitative metrics. Think about what this means for a second. You’re making decisions, without taking your users into consideration. Even though they’re the ones using the product.
Instead, for a more accurate analysis, it’s time to make room for qualitative data too, like user interviews and feedback. I will discuss why in just a second.
Why does UX analytics need more than data?
Quantitative data used to be enough for UX analysis. But over time, customer needs evolved. Users started prioritizing their experience over functionality, with 88% admitting that they’re less likely to return to a site after a poor UX.
Amidst all this, quantitative data just falls short of explaining the why behind user behavior. Here are some reasons why:
- Human expertise & interpretation: Information is not in the data. This means quantitative data alone does not inherently contain reasons for causality or correlation. Instead, the interpretation is added as a result of qualitative sources, namely human expertise, intuition, and domain knowledge.
- Importance of context: Numerical data doesn’t account for the context within which it occurs. To assign meaning to whether the numbers are good or bad, context is crucial. This includes the business environment, any ongoing issues, industry understanding and benchmarking, etc.
- Uncover why the needs exist: Even when using methods like user feedback widgets and focus groups, the aim is to learn how users use your product. These methods can be used to dig deeper into the user’s brain. So you can figure out why the needs exist and what motivates them to choose a product.
How should you start a UX analysis?
For the reasons I mentioned above, diving straight into data collection is not how you should start your UX analysis. So what’s the starting point then? Do you start by establishing a goal first or deciding whether tools like Google Analytics are enough for the job?
This is where it gets tricky because there isn’t much helpful content available on this topic.
However, based on our experience, a good place to start is by building a better understanding of core UX terms, namely questioning utility and usability.
- Utility: Take inventory of your product’s functionalities and measure the percentage being actively utilized by users. This shows how well your product addresses user needs.
- Usability: Measure the success rate of users completing tasks with those functionalities, identifying friction points.
You can further build on this initial guidance by combining these metrics with user states – a simpler alternative to tracking complex SaaS user journeys.
So group users into five states (New, Activated, Active, At-Risk, and Dormant) to see if utility and usability issues occur for any of the users in these states. For example, are new users exploring core functions or just the basics? Or do at-risk users struggle more with certain features than active users?
If you uncover any problems with utility or usability, only then can you start collecting data for further analysis. But this brings up the next issue – how do you collect targeted UX data for deeper insights? There are a couple of ways to go about it, which I elaborate on below.
How do you collect UX data?
By now, we’ve covered that UX data can come in both quantitative and qualitative data forms. Next, let’s explore some methods for collecting each data type, along with common mistakes to be wary of.
Qualitative data collection methods
- Open-ended surveys: Collect user feedback through questions requiring elaborate answers about a context. For example, welcome surveys for gathering information on user JTBD.
- User interviews: Direct, open conversations with users to uncover insights into their needs, behaviors, and motivations.
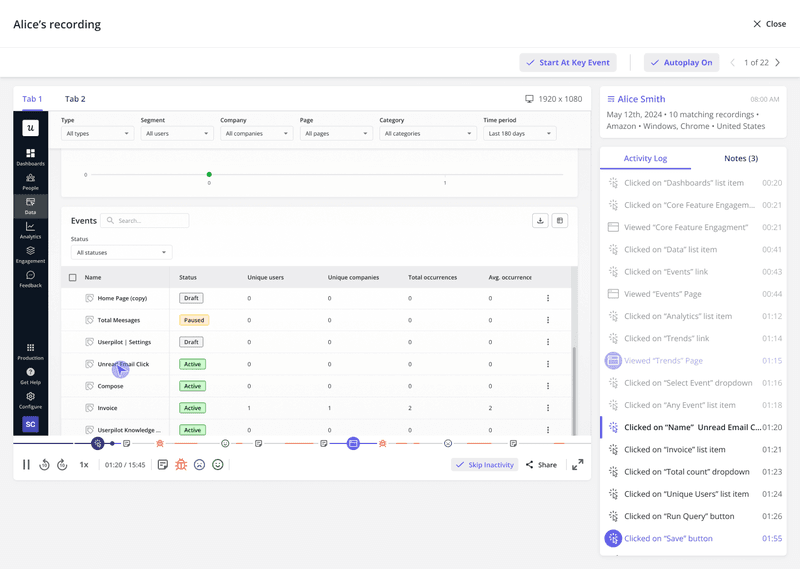
- Session recordings: Track user interactions, like clicks, scrolls, mouse movements, etc., across your product or website. Useful for recreating entire user journeys and finding friction areas.
- Usability testing: Observe how real users interact with your product while they perform specific tasks to help you identify usability issues.
- Expert review: Established design experts check your product’s design based on usability principles to identify potential improvements.
- Eye-tracking: Track and display a heat map of where users focus the most on a page to understand visual attention and behavior.
- Personas: Create semi-fictional characters to represent and better understand key user types, their goals, needs, and problems.
While there are several qualitative data collection methods, each comes with its limitations.
For instance, surveys may seem like an easy-to-execute option. However, survey data won’t work if you’re asking the wrong questions. A good question should:
- Reduce ambiguity.
- Shift perspectives.
- Narrow the solution space.
- Be data-testable.
It’s the same issue if you lack a survey strategy.
The Kano model can help here, making planning questions easier. It uses a functional and dysfunctional question to measure how users value a certain feature. This simple yet effective model makes feature prioritization easier based on user preferences.
Quantitative data collection methods
- Close-ended survey questions: Restrict respondents to predefined answer options, such as “Yes/No” or multiple-choice selections, easily generating quantitative data for analysis.
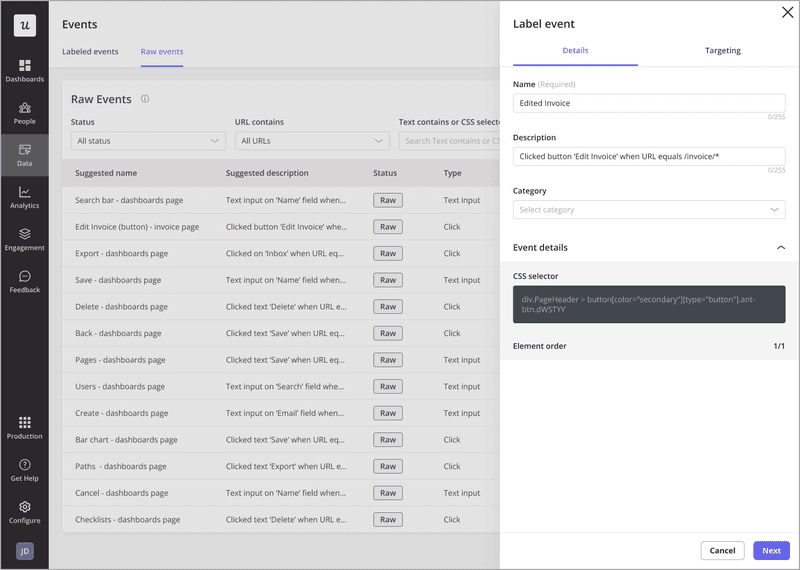
- Event tracking: Monitor specific actions within your product (e.g., user clicks or data inputs). This helps identify user behaviors linked to successful outcomes, like upgrades or feature adoption.
- Autocapture: Automatically record all user interactions with your product, like clicks, text inputs, and form submissions. Useful for studying behavior patterns and problem areas.
- Retention analysis: Analyze user behavior to understand why they abandon your product and identify strategies for reducing churn.
- A/B testing: Compare two versions of your product or design to determine which performs better with users.
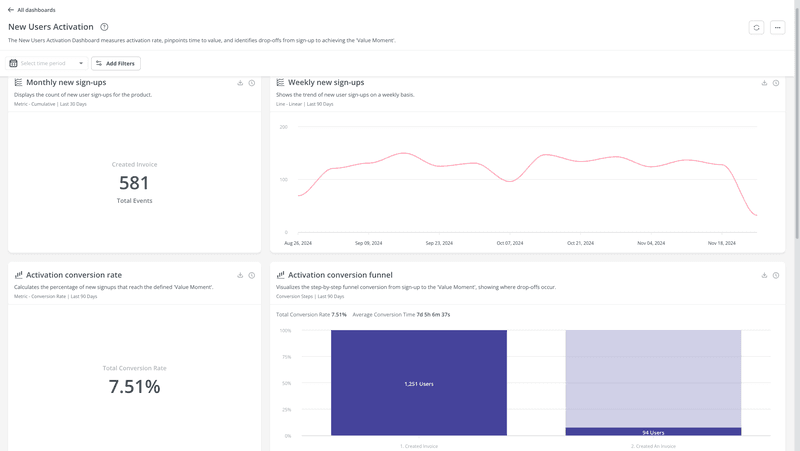
- Funnel analysis: Track users through various stages of the conversion funnel (from sign-up to paid user) and uncover any drop-off points where users churn.
- Page load time & performance metrics: Measure how quickly your application loads and performs, which directly impacts user satisfaction and retention.
Once again, surveys are an attractive option for quick and easy data. However, with close-ended survey questions, a common mistake is offering too few options, limiting insights. To avoid this, try rating scales to capture more nuanced data that can’t be collected through multiple-choice answers.
Coming to product experimentation, testing multiple changes at once can confuse the results. Instead, in your A/B tests, focus on one variable at a time for clear, actionable, and directly traceable insights.
How should you handle UX data?
Like most articles you’ll find online, our article mentions several analysis methods too. However, that doesn’t mean you go collecting all the suggested data or analyzing all those data points.
Remember (tip number 1) – your analysis should always follow your goal.
Suppose you’re having a problem with user activation. New signups seem to abandon your product and become inactive. So your goal here becomes “To understand the root cause behind new signups’ low activation rates.”
To gather relevant data aligned with this goal, the best collection methods could be:
- Survey them for feedback via email, since they’ve abandoned the app.
- Segment them to watch their session recordings and find reasons explaining the inactivity.
Beyond these options, you can also dig even deeper with hypothesis testing. So you might hypothesize that your UI isn’t working as it should.
An appropriate test would then be to survey new signups who finished onboarding, used specific features several times, etc. Users who know your product enough to comment on its UI, thereby providing data relevant to your goal.
That might sound like a generic tip, but I find that it warrants emphasis. Next, we can move on to the more creative tips to help guide your UX analysis:
- Ask “So what?”: Ask “So what?” about 5-7 times for each data point. This helps youdig deeper until you uncover the final insight that’s worth reporting and acting on.
- Focus on one problem at a time: UX analysts should work by mastering one analysis area at a time. This builds an invaluable understanding of the subject area and improves their confidence. So eventually everyone on the product team has a great grasp of their data reporting.
- Hypothesis generation: Clearly define your problem before forming your hypotheses. Hypotheses should still be realistic, so use your domain knowledge to generate plausible and relevant ones. Lastly, start with a broader hypothesis, refining it along the way, and redefining it altogether if data conflicts arise.
- Understand who you report to: It’s important to know who owns the data, especially when things go wrong. Clear ownership helps improve data credibility and ensures better tracking and communication when issues come up.
What are the tools for UX analytics?
UX analytics is often a collaborative effort between the data and design departments. For this reason, you may need tools that are different from what you’re already working with.
For instance, the design team might look for something that requires basic technical expertise, like Google Analytics. Whereas data analysts will be more inclined toward UX analytics software. Here, we’ve shortlisted a few options that work for both teams with limited and advanced tech knowledge.
Userpilot
Designed to cater to SaaS midmarket and enterprise businesses, Userpilot is a scalable product growth tool with features for:
Data collection:
- Autocapture: Replace manual event tracking by automatically recording user interactions with your product. Revisit whenever needed with historical event data stored for further analysis.
- Session recording: Digitally record and replay every action users take within your product, like clicks, hovers, scrolls, etc. Great for understanding user journeys on a more granular level.
- User surveys: Customize and trigger in-app surveys with a variety of question types and audience segmentation options for targeted engagement.
Data analysis:
- Reports: Gauge product performance and user behavior with reports for funnel and path analytics, trends, and retention tables.
- Dashboard: Customize the analytics dashboard or choose from pre-built ones to easily visualize and compare key metrics over time.
- Company & user profiles: Better visualize company/user data for relevant insights into the users engaging with your product.
Optimal Workshop
A UX research and design testing platform, Optimal Workshop provides several user research features. These include:
- Usability testing: With features like card sorting and first-click testing, uncover usability and navigation issues that could lead to user frustration.
- Surveys: Validate assumptions and test design ideas by collecting targeted feedback about user problems, pain points, and preferences.
- Prototype testing: Test out initial designs throughout the iterative design process with real users to highlight any usability issues.
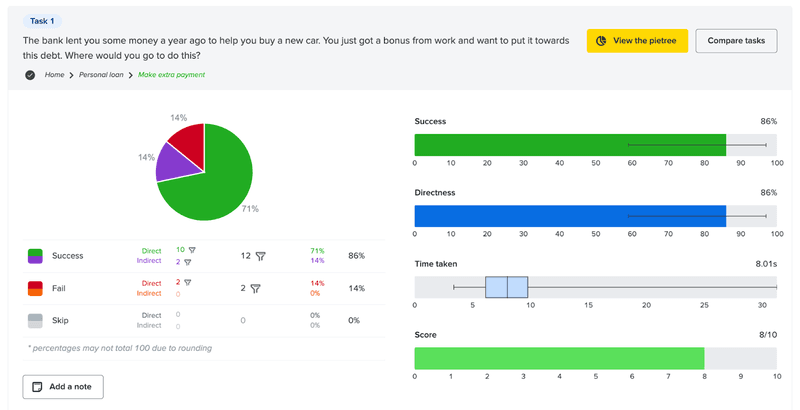
- Tree testing: Test for any navigation issues and see if your design is intuitive and user-friendly, whether the labeling is clear, etc.
- Participant recruiting: Outsource the work of finding the right participants for your study, freeing you up to focus on the more important strategic parts.
Qualtrics
The last of the UX analytics tools worth considering is Qualitrics. It provides extensive market research features for collecting and analyzing quantitative and qualitative data.
Here’s what Qualtrics has to offer:
- Research surveys: Create simple feedback surveys or elaborate research projects that are shareable via email, social media, your website, QR codes, SMS, and even offline.
- Research management: The AI-powered research hub centrally stores all your research for easy access. It analyzes past studies and data points to suggest new insights and build on previous research.
- UX research: Conduct usability tests and moderated and un-moderated user tests throughout the product development cycle.
- Qualitative research: Collect video feedback and user interviews for in-depth perspectives. Leverage Qualtrics’ AI features to automatically transcribe and analyze videos for both topics and sentiment.
- Concept testing: Validate everything from product design ideas to branding and messaging, ensuring that your product is primed for success.
The only disclaimer needed here is that Qualtrics requires a large data pool to produce useful results. However, this can be easily circumvented by using the tool’s own participant recruitment option. So they collect the data points for you, while you focus on the strategic analysis.
Conclusion
This entire article has advocated for focusing on qualitative data alongside quantitative.
I end by acknowledging that methods like user interviews and surveys might be harder to execute. They take longer to implement and even longer to analyze. This is why quantitative UX data remains popular for quick and easy results.
Despite the drawbacks, I must reiterate the need to focus on the qualitative. Remember, the goal of successful UX analysis is to move towards more user-centered decisions. And that can only be possible if you talk to your users, even if you start out small at first.
Want to improve your UX analytics to unlock better user insights? Get a Userpilot Demo and see how you can launch feedback surveys and track behaviors with the customizable analytics dashboard.
FAQ
What is analytics in UX?
Analytics in UX refers to the process of collecting and analyzing qualitative and quantitative data. The goal is to understand how users interact with a digital experience.
This helps identify pain points, improve usability, and optimize user experiences by tracking behaviors like clicks, navigation, conversions, and engagement.
What does a UX data analyst do?
A UX analyst focuses on improving digital experiences by analyzing user data and identifying activity trends. They also work on enhancing product usability by collaborating with other departments.
Additionally, UX analysts leverage UX analytics tools to track product performance KPIs and develop data visualizations. Their insights guide product design decisions, ensuring solutions meet the needs of end-users effectively.
What are UX metrics?
UX metrics are key indicators used to measure and evaluate the user experience of a product or service. They help assess usability and guide design improvements. Common UX metrics include:
- Task success rate: Percentage of tasks completed successfully.
- Time on task: Time taken to complete a task.
- User satisfaction: Measured through surveys or ratings.
- Error rate: Frequency of user errors.
About the author