Customer Engagement Dashboard in 2026: Track Signals that Predict Churn, Not Just Report It


A customer engagement dashboard that shows daily active users climbing while net revenue retention quietly drops is not doing its job. I’ve seen this scenario more times than I’d like: a product team confident in their engagement numbers, then blindsided by a renewal conversation. Activity was tracked; intent was not.
What engagement dashboards originally promised was simple: collect customer engagement data in one place and know how your product is performing. For a long time, that was enough. In 2026, the definition of “engaged” has shifted, and a dashboard built around login frequency and session counts is increasingly insufficient for the decisions that actually matter.
AI agents now interact with SaaS products alongside human users, executing tasks through API calls and MCP integrations without generating the behavioral signals dashboards were built to track. Unlike human users who click, scroll, and trigger events, agents complete tasks without ever touching your UI. A dashboard that can’t tell the difference is measuring half the picture and optimizing for the wrong half.
The dashboards that actually reduce churn in 2026 are built around leading indicators that predict what’s coming, not lagging ones that confirm what already happened.

Why most engagement dashboards fail before they start
The structural failure isn’t in the data, which is usually fine. It’s in which metrics get prioritized, and almost universally, teams default to metrics that are easy to track over metrics that are predictive.
James Mitchinson, Userpilot’s Head of Customer Success, described exactly this pattern when talking about an account his team nearly lost:
“It was clear progress wasn’t being made, but there were still a lot of logins, and being able to look at the difference between those two things, lots of activity, but the outcomes aren’t really materializing, it gave us the opportunity to go and have a frank conversation with the executive stakeholder about some of the challenges and frustrations they were experiencing, and we got them back on track before they gave up. If we hadn’t intervened at that moment, I wonder, would they have looked for another solution or decided it wasn’t worth their time?”
— James Mitchinson, Head of Customer Success, Userpilot
The dangerous accounts aren’t the inactive ones, which are easy to spot. They’re accounts that look engaged on the surface but aren’t extracting value underneath, and a standard engagement dashboard built around login counts and session duration can’t surface that distinction.
Wes Bush, founder of ProductLed, frames the root of this problem clearly:
“Engagement is the second-order effect of your product’s usefulness to customers.”
That reframe changes how you build a dashboard. Instead of tracking how often users log in, you track whether they’re completing the outcomes they came for.
Before building your first metric list, define your engagement north star: one metric that reflects genuine product value, not activity. Everything else on the dashboard becomes a supporting signal. Without a north star, you end up with 25 metrics and no clear decision to make from any of them.
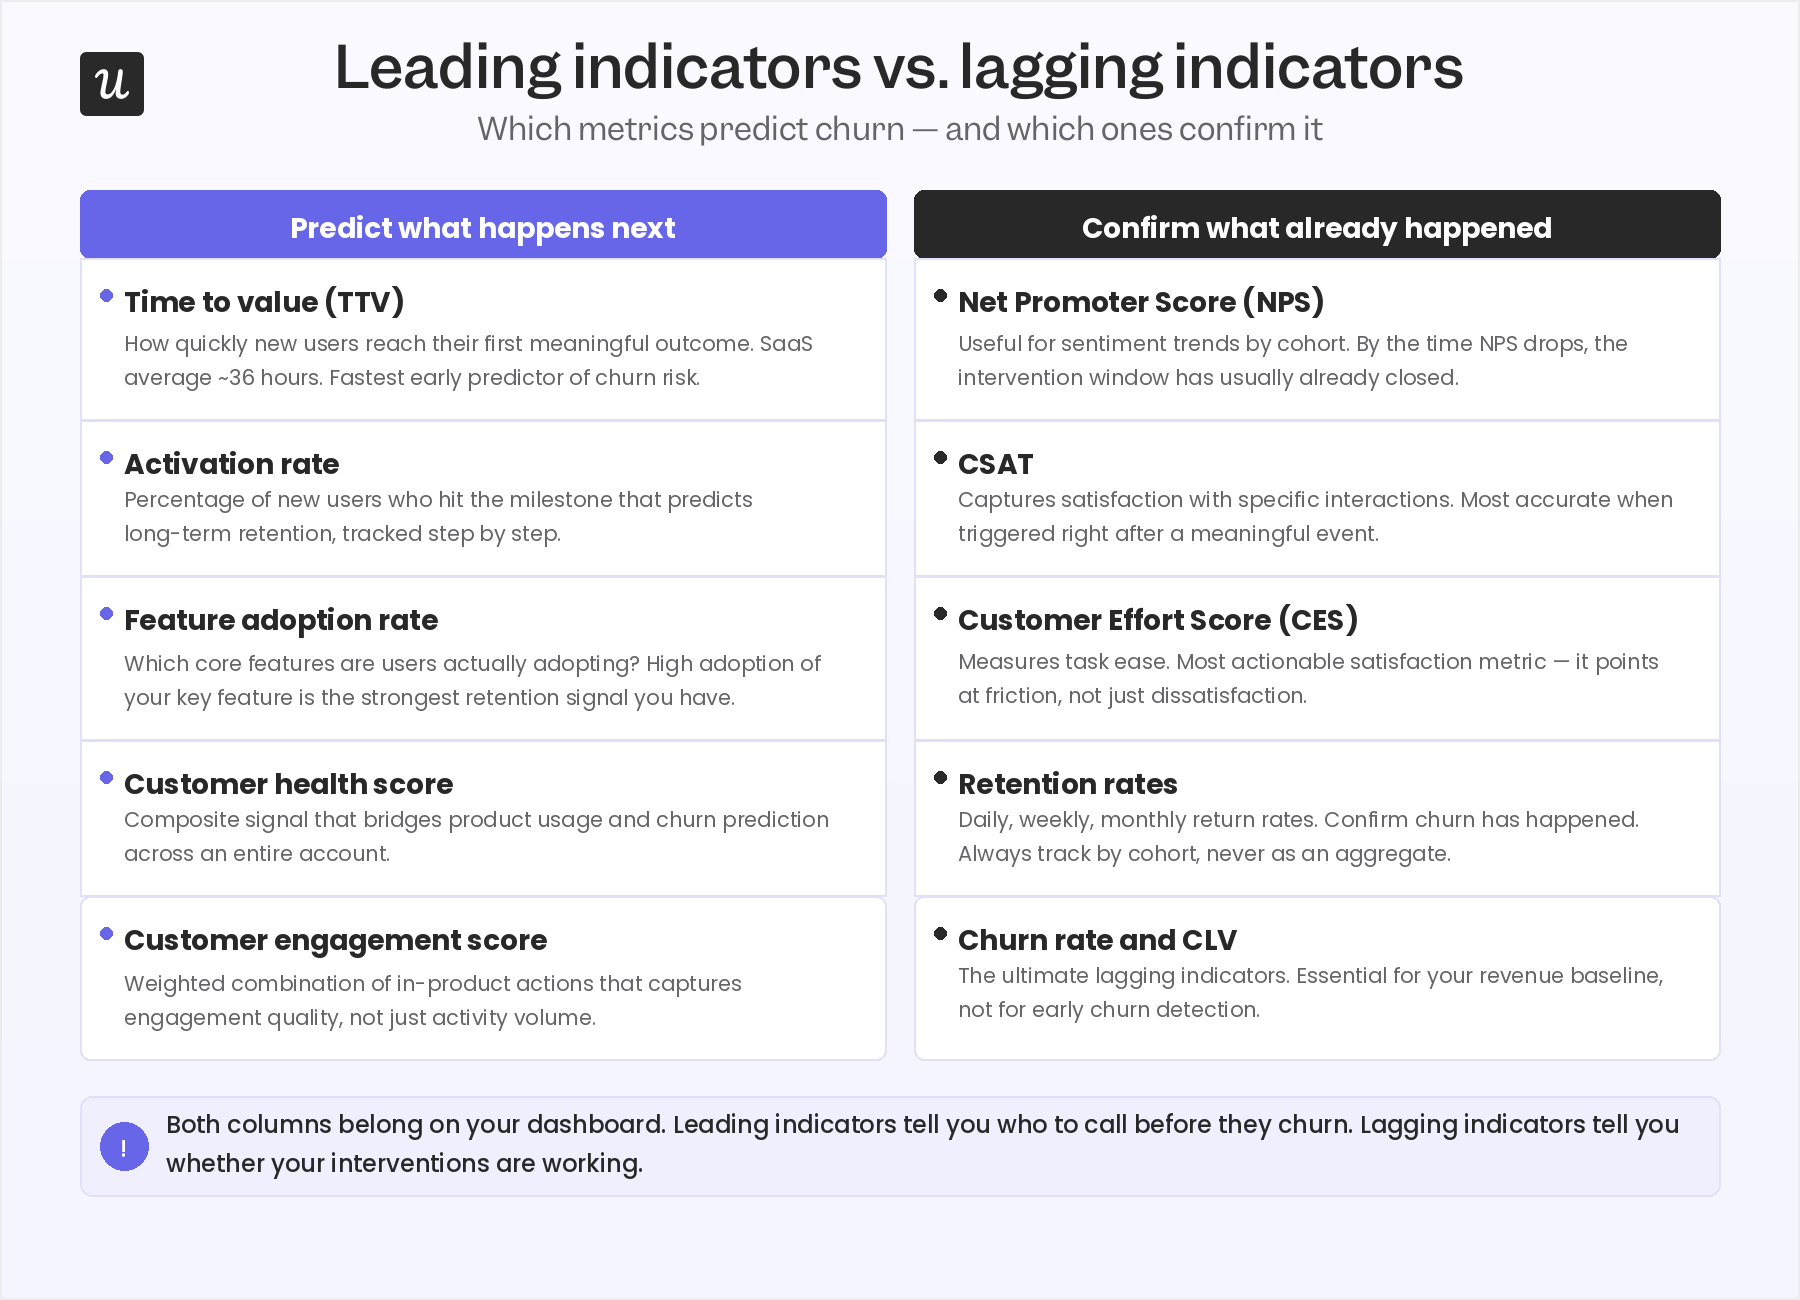
Leading indicators: The metrics that predict what happens next
Leading indicators are the metrics you want dominating your engagement dashboard. They correlate with future retention and expansion rather than confirming past behavior. The following four are the baseline I’d build any SaaS product dashboard around.
Time to value
Time to value (TTV) measures how long it takes a new user to reach their first meaningful outcome in your product. In SaaS, the average sits around 36 hours, though for any product where core value is delivered in a single session, faster is consistently better. Users who don’t experience the product’s value quickly tend to disengage before retention can set in, which makes TTV one of the clearest early-stage predictors of churn you can track.
TTV matters most in the first 7-14 days of a new user’s life. If a user doesn’t reach their activation milestone in that window, the probability of long-term retention drops significantly. Track it by cohort, not just as an overall average, because TTV often varies sharply by acquisition channel or user segment.
Activation rate
Activation rate measures the percentage of new users who complete the milestone that predicts long-term retention: the moment a user has experienced enough of your product to understand its core value. Defining that milestone is the hard part, and most teams define it either too early (completing a profile) or too broadly (logging in three times).
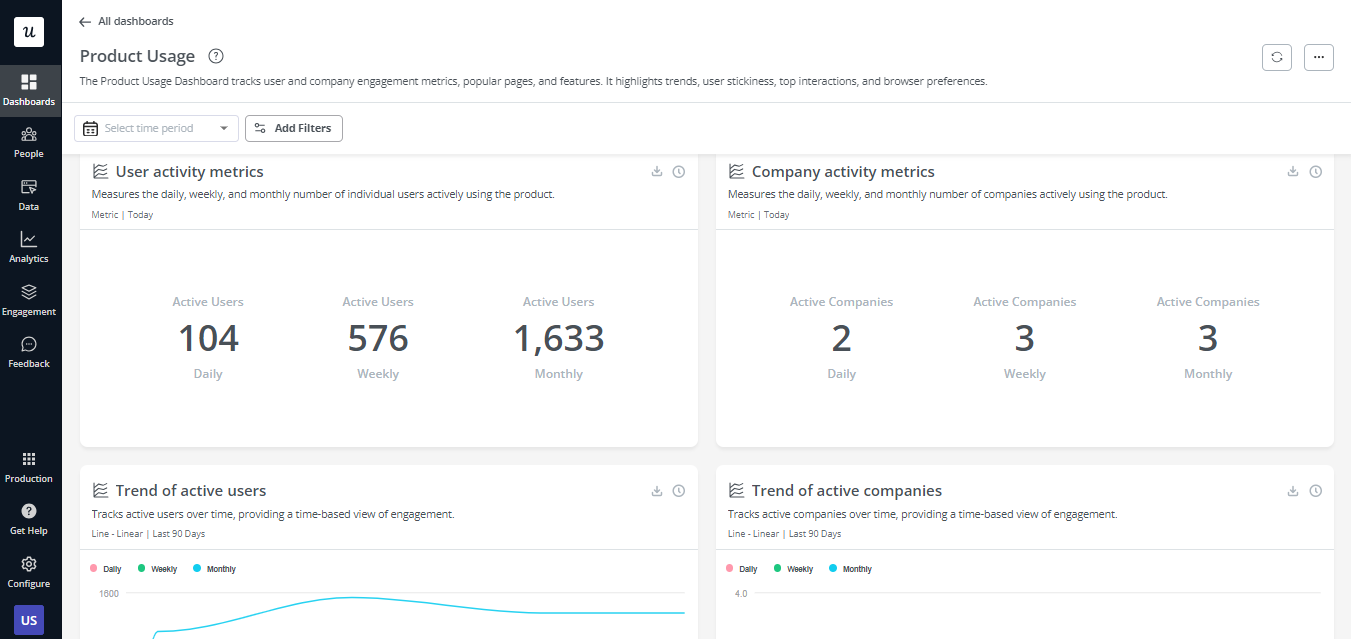
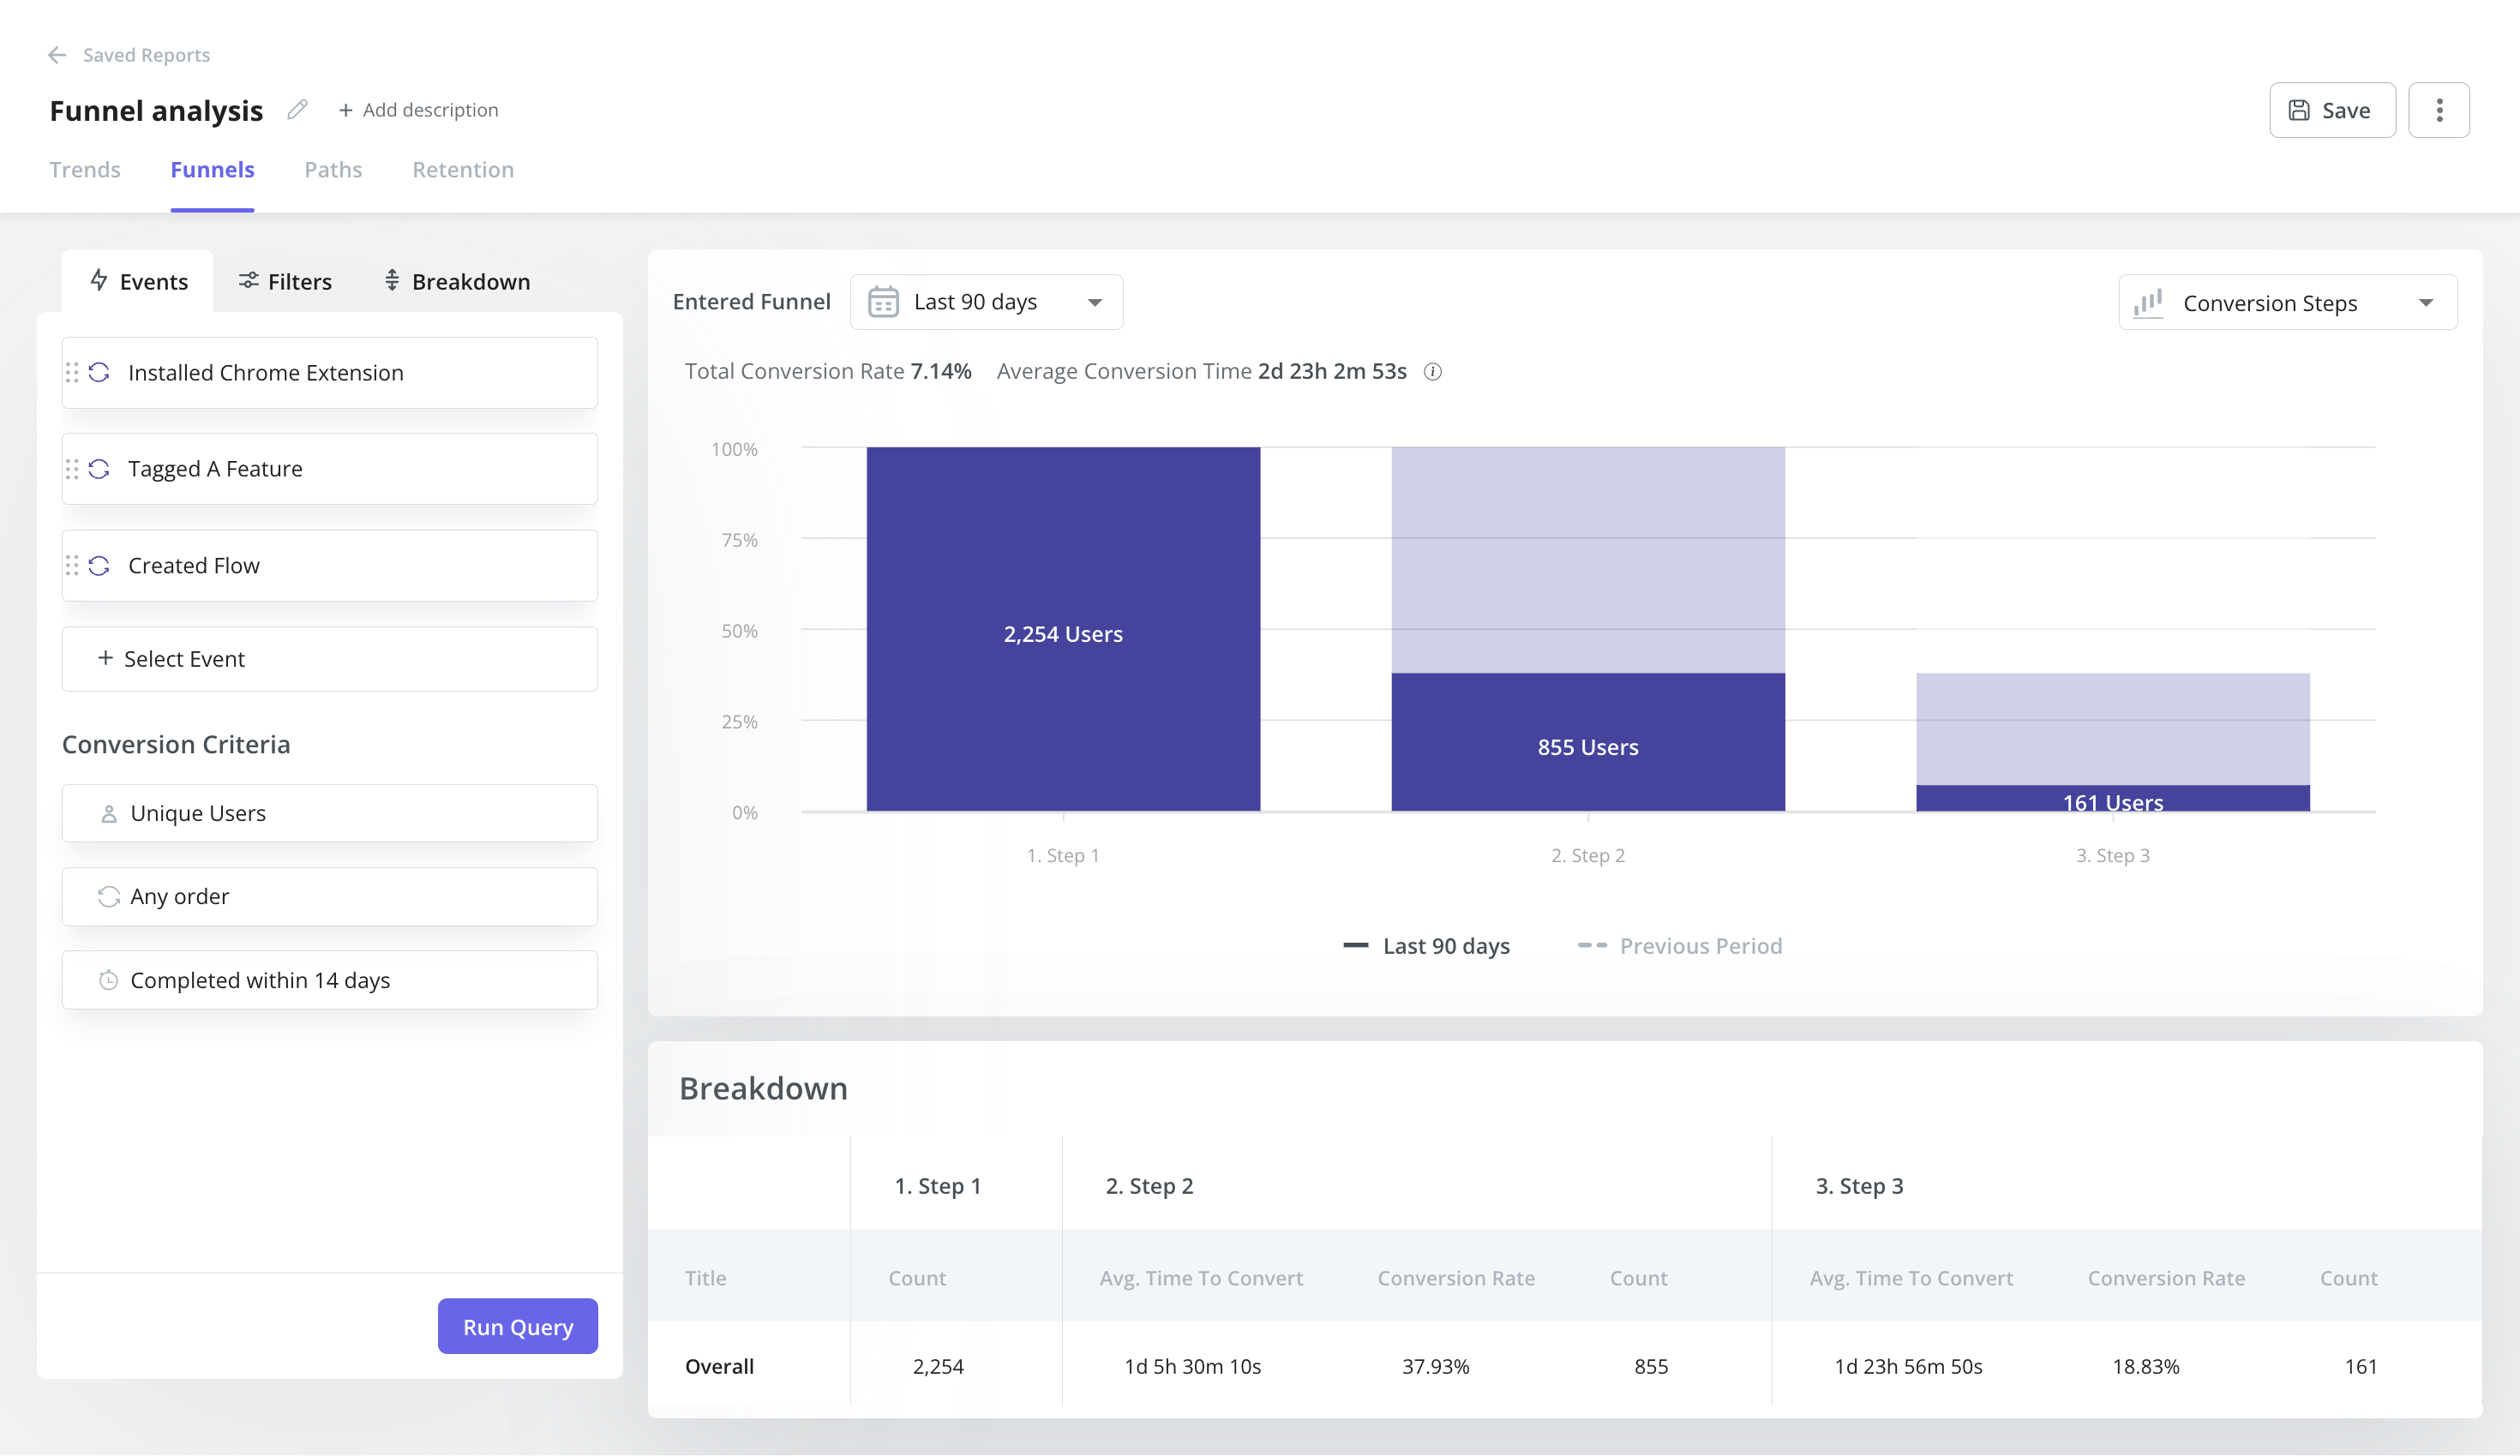
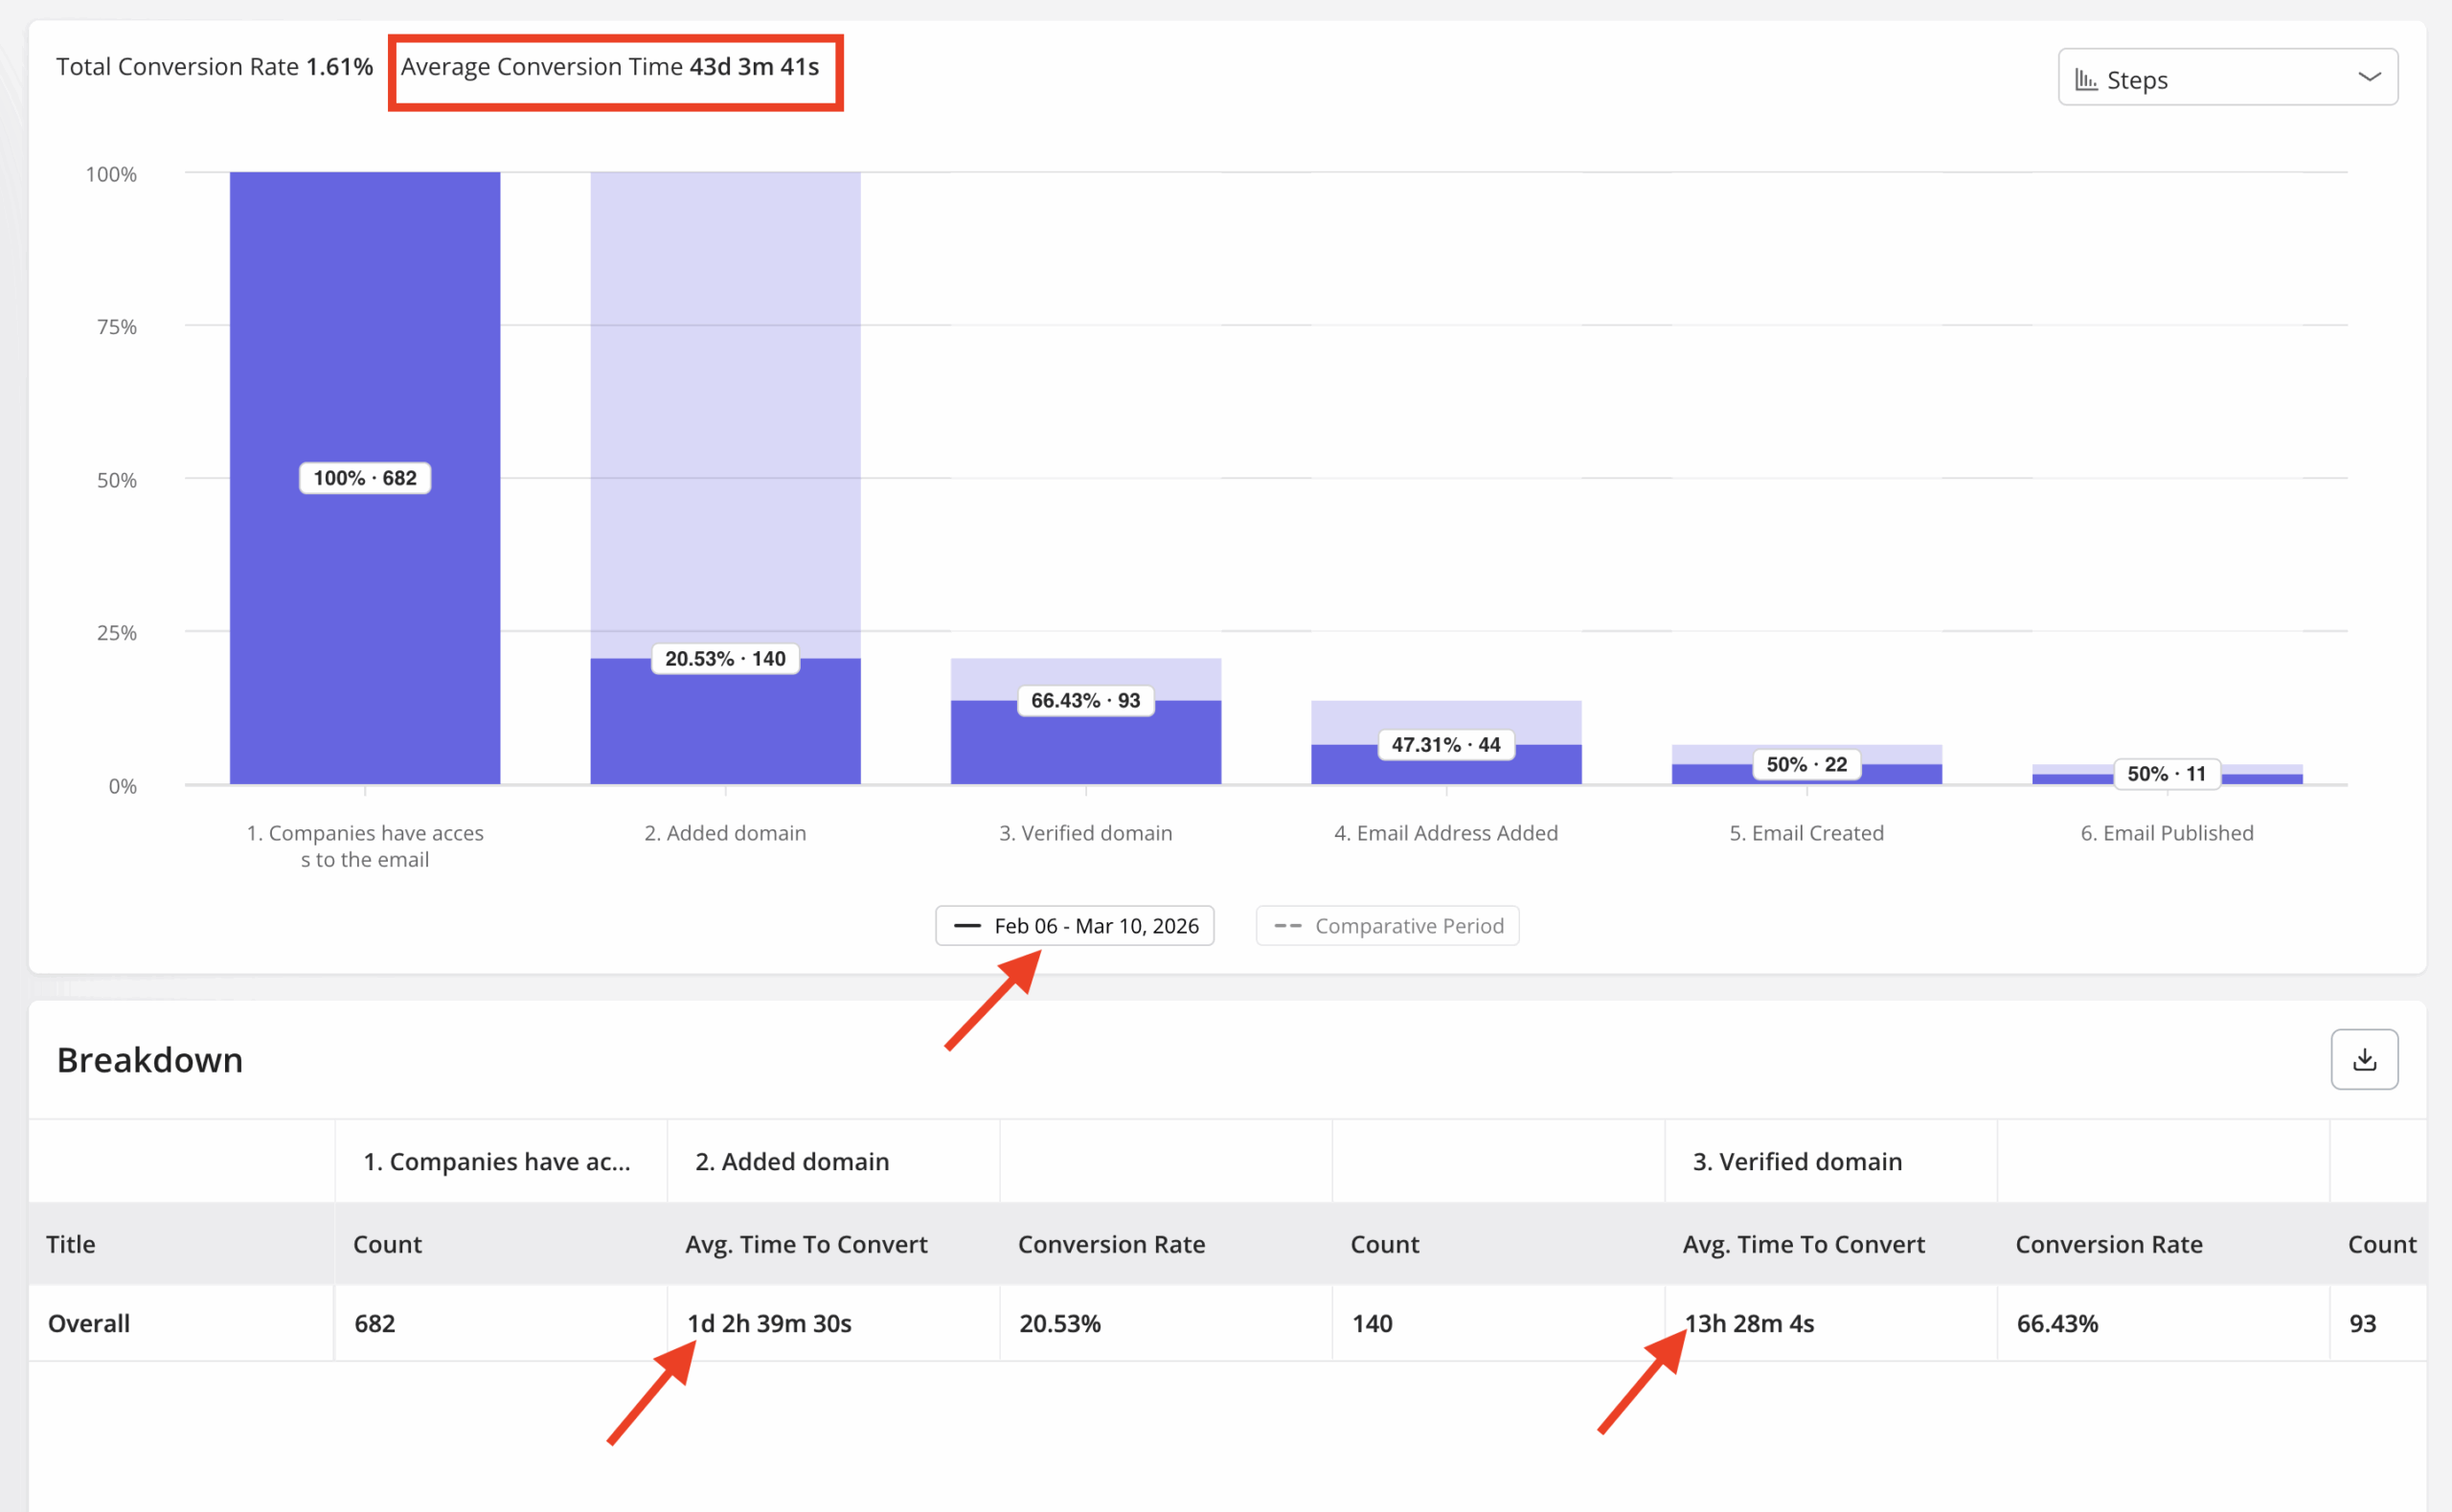
When I look at activation rates in Userpilot, I break them down by the specific steps in the activation funnel rather than tracking a single aggregate. That’s where the actionable insight lives: not “activation is at 34%,” but “users are dropping off at step 3, specifically during domain verification.”
When we launched Userpilot’s email feature, the funnel showed a sharp drop-off at exactly that verification step. Within a few hours, I built a targeting tooltip and checklist inside Userpilot highlighting the correct steps, with no engineering ticket required. The drop-off closed within days, and I wouldn’t have caught it without watching activation at that level of granularity.
Feature adoption rate
Feature adoption rate measures what percentage of users have started engaging with a specific feature. The number that matters is adoption of your core features, not your peripheral ones. High adoption of a sidebar widget tells you almost nothing about retention; high adoption of the feature that delivers your product’s primary value is one of the clearest retention signals you have.
I also track feature adoption alongside continued usage, because initial uptake tells you about discovery while return visits tell you about value. When adoption is high but continued usage drops off sharply after the first week, that’s a signal the feature isn’t delivering what users expected, which is a product problem worth diagnosing before it shows up in churn.
Customer health score
A customer health score is a composite metric that bridges product usage data and churn prediction. It aggregates signals from multiple sources, typically login frequency, feature usage breadth, support ticket volume, and recent NPS responses, into a single score that gives customer success teams a read on account health without requiring them to cross-reference five separate reports.
The specific signals you weight will depend on your product. In a B2B tool used by teams, feature breadth (how many seats are actively using core features) carries more weight than raw session count. Self-serve products tend to find time-to-activation and return visits in the first 30 days most predictive, though the right answer always comes from your own cohort data.
Customer engagement score
A customer engagement score measures how engaged your existing customers and free trial prospects are, typically through a weighted combination of in-product actions. It’s distinct from a health score in that it captures engagement quality rather than account-level health. A user who completes a core workflow earns more engagement score than one who opens the same feature and immediately closes it.
In Userpilot, custom analytics dashboards let you configure which events contribute to your engagement score and how they’re weighted. That customization matters: an engagement score built around the wrong events tracks activity without tracking value, which puts you back at the same problem most dashboards start with.
Lagging indicators: The metrics that still belong on your dashboard
Lagging indicators aren’t useless. They give you essential context, validate product decisions, and surface patterns that leading indicators miss. The mistake is treating them as your primary signal for retention risk, because by the time they move, the retention window for most at-risk accounts has already closed.
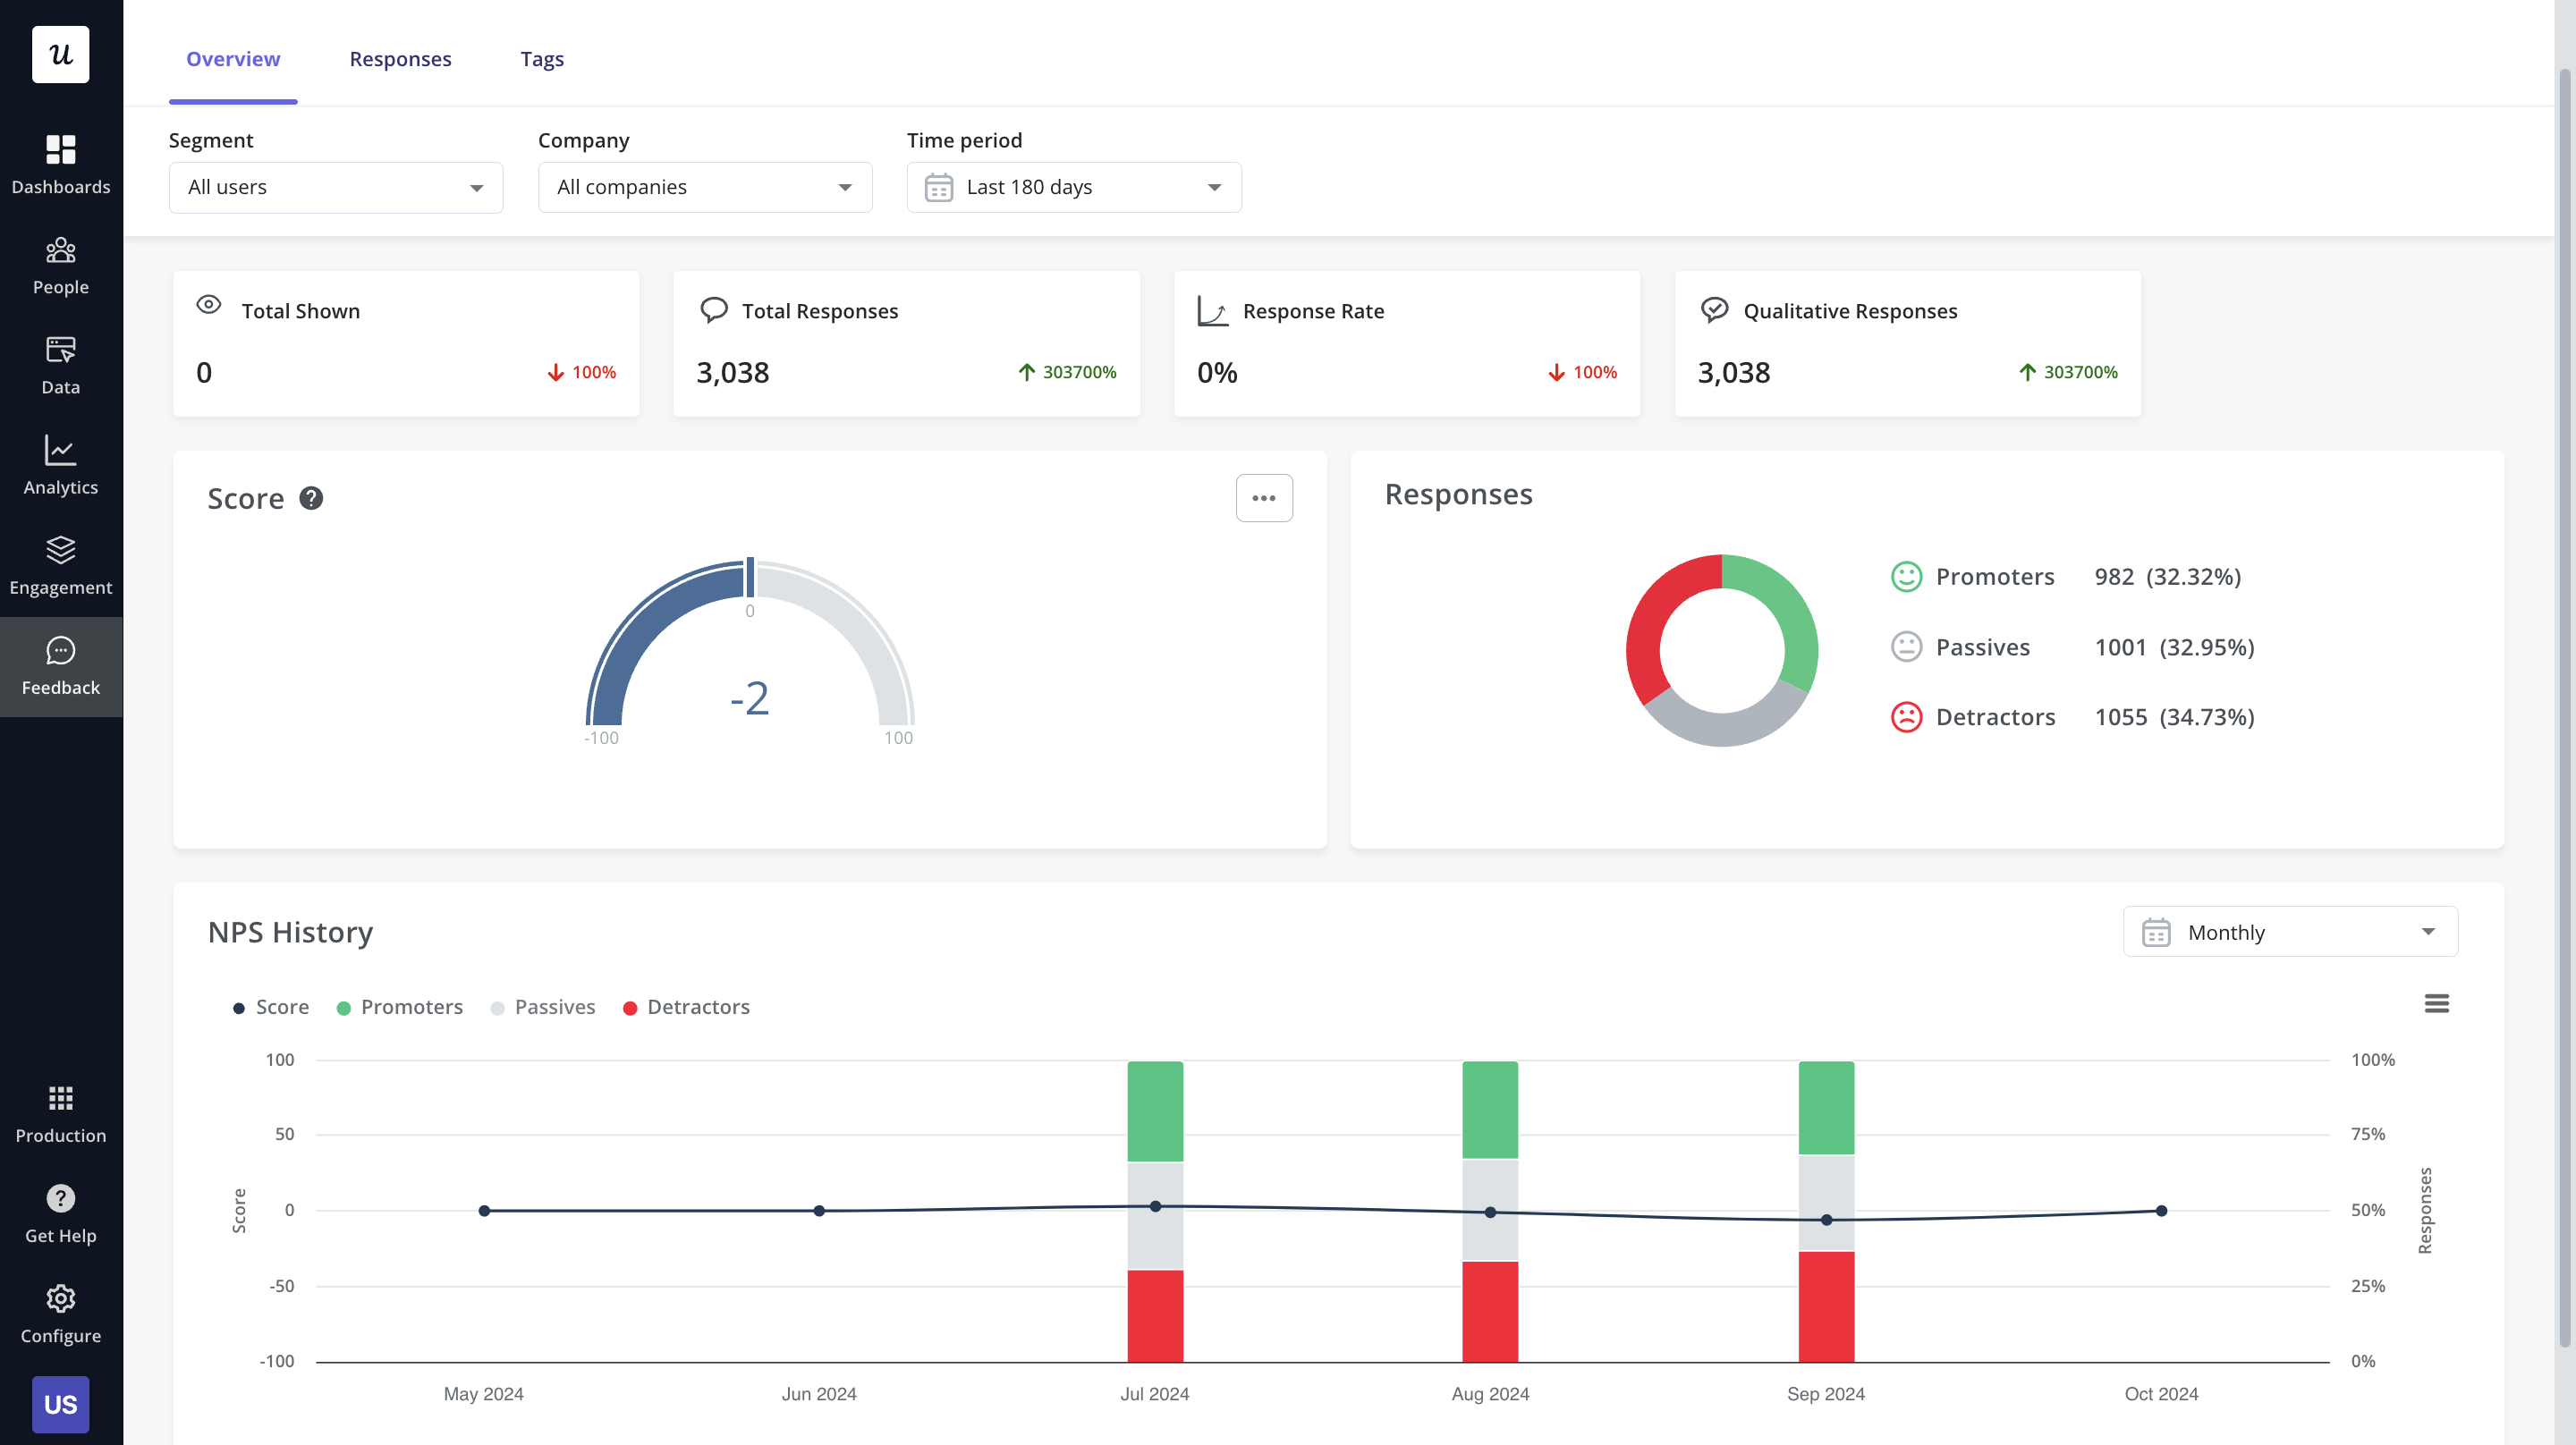
Net Promoter Score (NPS)
NPS measures customer loyalty by asking users how likely they are to recommend your product on an 10-point scale. Customers who score 9 or 10 are promoters; those who score 0-6 are detractors. The resulting score gives you a directional read on sentiment that’s useful for trend tracking across cohorts, not for catching individual accounts before they churn.
Leading off your dashboard with NPS has one consistent problem: timing. By the time NPS drops, the damage is usually done. A customer frustrated enough to score you a 3 is not starting a retention conversation with that survey: that conversation has been underway for weeks without a signal on your dashboard.
Customer Satisfaction Score (CSAT)
CSAT measures satisfaction with specific interactions: a support ticket resolution, a new feature release, an onboarding call. It’s more transactional than NPS and more accurate as a result, because it captures satisfaction in context rather than asking users to rate their entire relationship with your product from memory. B2B CSAT surveys work best triggered immediately after a meaningful interaction, not sent on a quarterly cadence.
Customer Effort Score (CES)
CES measures how easy it is for users to complete tasks with your product, typically by asking “how easy was it to complete this task” on a 1-7 scale after a specific interaction. A low CES score on a core feature is one of the clearest signals you have that a usability problem exists, which is worth knowing well before it starts driving churn. Of the three satisfaction metrics, CES is the most actionable for product teams because it points at friction rather than just reporting dissatisfaction.
I watch CES scores on high-friction steps specifically, the places in your product where users are most likely to give up or submit a support ticket. If CES drops after a UI change, you know the change introduced friction; if it improves after a redesign, you have evidence the fix worked.
User retention rates
Retention rates (daily, weekly, monthly) measure the percentage of users who return to your product in a given period. Like NPS, they’re diagnostic: they confirm that churn happened rather than predicting it. By the time a monthly retention rate drops, you’re already past the intervention window for the accounts that drove the decline.
Track retention rates by cohort rather than as an overall aggregate. A product with stable overall retention but declining retention in its newest cohorts has a structural onboarding problem that aggregate numbers will hide until it compounds into a revenue problem.
Customer Lifetime Value (CLV)
Customer Lifetime Value estimates the total revenue a customer generates across their relationship with your product. It ties everything else together: strong retention and strong feature adoption translate directly into higher CLV. Track it by segment and by acquisition channel to understand which customer types are actually driving your business, rather than just inflating your user count.
Churn rate and funnel metrics
Churn rate is the ultimate lagging indicator: by the time it shows up in your dashboard, the damage is already done. Track it as your revenue baseline, but pair it with funnel metrics that show where users are converting (or dropping off) before they reach the churn stage. Cost per acquisition and conversion rates belong alongside churn data, not siloed in a marketing-only report.
The 2026 addition: Tracking AI-assisted sessions
Standard customer engagement metrics were designed around human behavior: clicks, scrolls, session duration, page depth. That design assumption is starting to break down. AI agents now interact with SaaS products through API calls and MCP integrations, completing tasks without generating any of the behavioral signals your dashboard was built to capture.
Yazan Sehwail, Userpilot’s CEO, identified the compounding problem when describing what increased shipping velocity means for product teams trying to track feature engagement:
“As producing and building features become a lot cheaper, instead of every quarter, you’re releasing one or two features, now you’re releasing 7, 8, 9. It becomes even harder for product teams to manually have to track each one and understand usage for each one.”
More features shipping means more engagement patterns to track across your dashboard. Layered on top of that, AI-assisted sessions generate activity that traditional metrics will misread as human engagement, inflating session counts and usage numbers without a corresponding signal about whether real value is being delivered. If an AI agent is using your product intensively through an MCP integration, your dashboard might read it as a highly engaged human account.
The new metric layer worth adding for AI-assisted sessions:
- Agent task completion rate: What percentage of tasks initiated by an AI agent are successfully completed? Incomplete tasks at scale are a product quality signal, not just a usage anomaly.
- Human vs. agent session ratio: What share of your active sessions are agent-driven? A product where agents account for a significant share of sessions needs separate analysis tracks for each user type.
- AI interaction quality: For products with a built-in AI assistant, what’s the rate of successful interactions versus failed or abandoned ones? This is where Lia’s usage data becomes a meaningful engagement signal.
 Yazan’s framing of what MCP changes specifically for teams trying to get a complete picture of product usage:
“If you as a marketer wanted to see, using session replay, NPS data, survey data, and product usage data, you’re able to get your answer without having to go to Userpilot, without having to pull data and upload it to someone. So this is why MCP is gonna be a game changer.”
For most teams in 2026, AI-assisted session data is still sparse, and the analysis infrastructure for separating agent sessions from human sessions is new. Adding a segment to your existing dashboard that filters by session type is the practical starting point, with the full layer built incrementally as data accumulates. What matters most on day one isn’t a complete picture: it’s not misreading agent activity as human engagement while you build toward one.
How to build a customer engagement dashboard that actually drives decisions
Building a customer engagement dashboard is not a configuration task. It’s a prioritization task. Before you touch any dashboard settings, you need one clear answer: what is the single metric that best reflects whether your customers are getting genuine value from your product?
Step 1: Define your engagement north star
Your north star is the one metric that your retained users almost always cross and your churned users almost never do. For a project management tool, it might be “users who complete their first project milestone.” For a collaboration tool, it might be “users who invite at least two teammates within their first week.” For any product, it should map to the moment value becomes undeniable.
Getting this right takes more than intuition. Pull cohort data comparing your most retained users against your churned users and look for the behavioral divergence point: the action or milestone that separates the two groups most clearly. That’s your north star candidate, and it’s worth validating in a few customer conversations before locking it in as your retention anchor.
Step 2: Layer in 3-5 supporting signals
Once you have a north star, build your supporting metric layer around it. Keep it to five metrics maximum for the primary dashboard view. A longer list turns into background noise that nobody checks until something goes wrong.
For most SaaS products, the right supporting signals are: activation rate (broken down by step, not overall), feature adoption rate for your top 3 core features, time to value, user stickiness, and a customer health score weighted to your product’s specific retention predictors. Each metric should have a named owner and a defined intervention threshold, which is the point at which someone takes action rather than just noting the number.
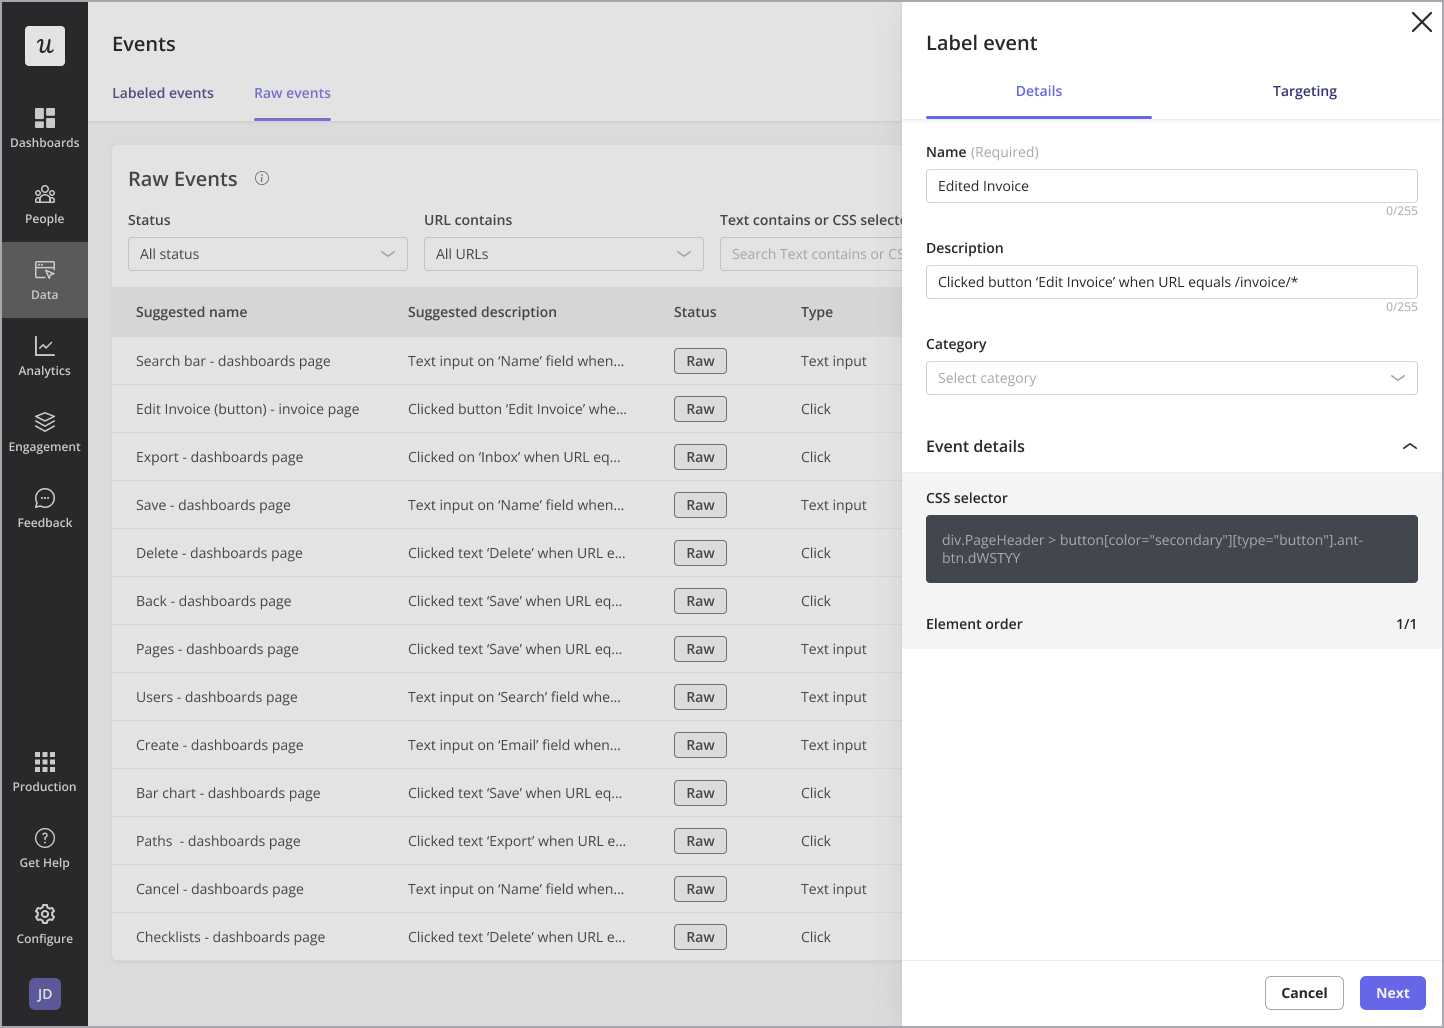
Step 3: Autocapture events, then label what matters
To measure customer engagement accurately, you need to track what users actually do in your product. Autocapture handles this automatically by recording every user interaction without requiring manual event setup, which means you don’t lose data while you’re still figuring out which events matter. The discipline is labeling meaningful events post-capture so your dashboard doesn’t drown in interaction noise with no signal hierarchy.
Autocapture also enables retroactive analysis: you can look back at historical data to understand what users were doing before a churn spike rather than realizing after the fact that you weren’t tracking the right events. That retroactive capability is one of the most practically valuable advantages of tool-level autocapture over custom event tracking, particularly for teams without a dedicated data engineering resource.
Step 4: Pair the numbers with qualitative insight
Quantitative data tells you where users drop off, but it takes qualitative insight to understand why. Without that pairing, you’ll optimize the wrong step or fix the wrong feature. Two methods that work consistently: session recordings to watch how users actually navigate your product, and in-app surveys triggered at the right moment to collect feedback while the experience is still fresh.
Session recordings are especially useful when a metric moves unexpectedly. If feature adoption drops 15% after a UI change, watching 10 recordings of users who stopped using that feature will surface the problem faster than any amount of additional quantitative slicing. I filter recordings by the specific events feeding my engagement metrics, which narrows the search considerably.
In-app surveys close the feedback loop between quantitative signals and user intent. If activation rate drops, a triggered survey asking users what stopped them during onboarding gives you the verbatim answer needed to fix it rather than guess at it. In-app surveys work best tied to a specific product event, not sent on a time-based schedule that has no relationship to what the user just experienced.
What a healthy engagement dashboard looks like in practice
A healthy customer engagement dashboard has three layers: one north star at the top, 3-5 supporting signals in the middle, and a qualitative context layer at the bottom. Every metric on it connects to a decision your team can act on. If a metric doesn’t have a named owner and a defined intervention threshold, it’s taking up space.
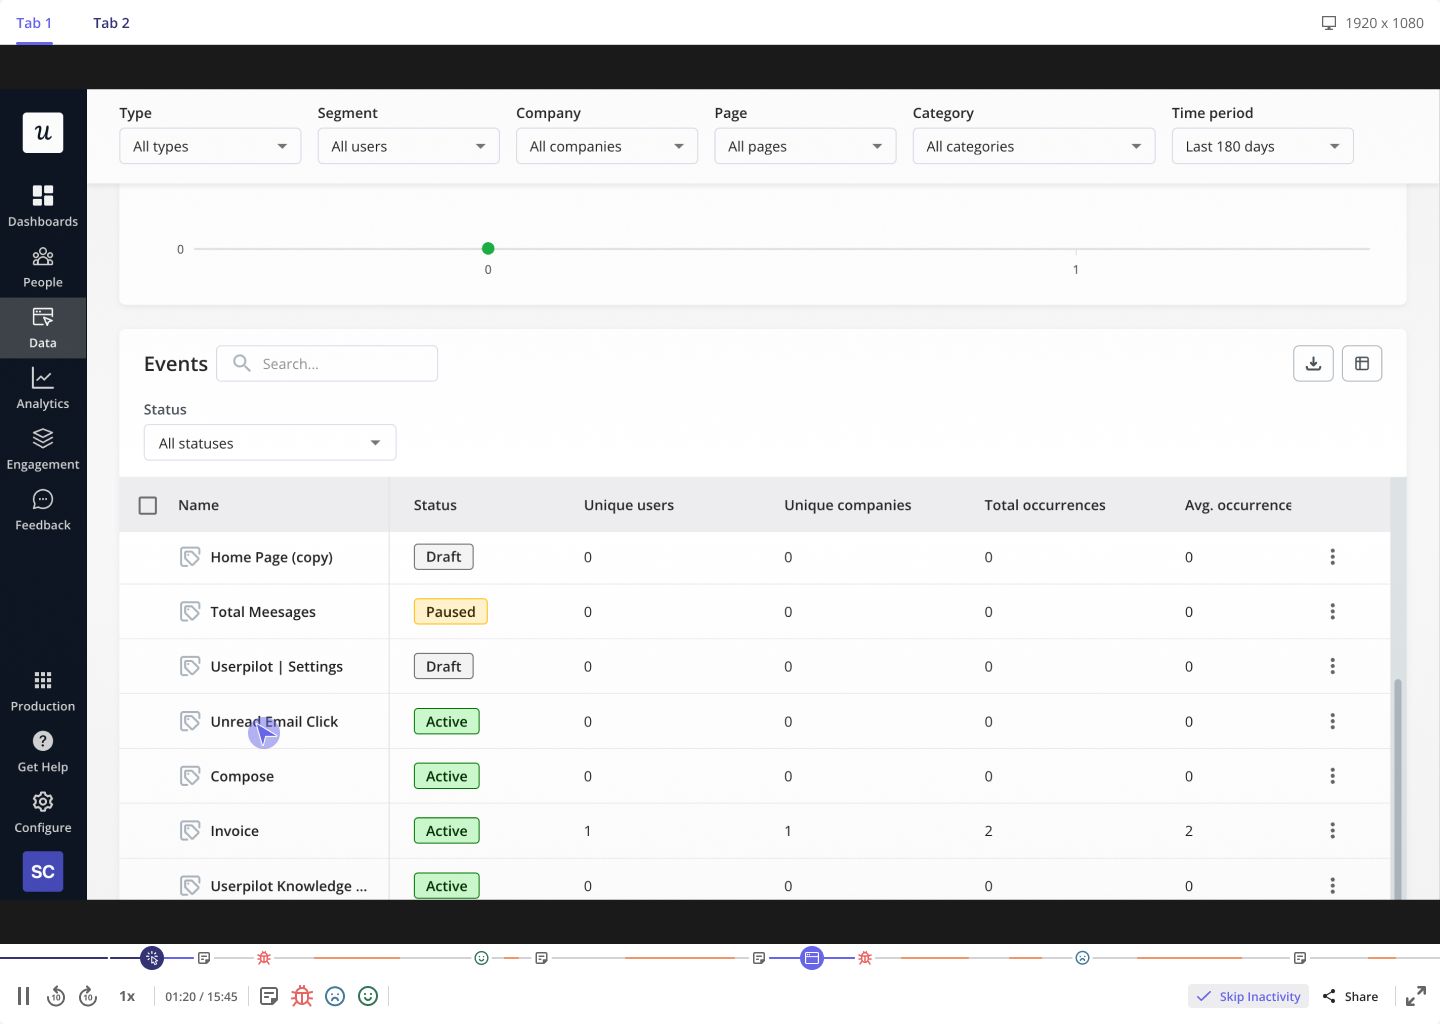
The dashboard I work from at Userpilot is organized around feature health reports. Once a feature ships, I create a report tracking meaningful events to see usage and adoption over time, then look for where drop-off is happening and in which step users are getting stuck. The fix is sometimes engineering, but often it’s in-app messaging: a tooltip, a checklist, a contextual prompt at the moment a user hesitates.
Shifting from overall metrics to cohort views was the single most important change I made to how I read engagement data. An overall activation rate of 35% means almost nothing without knowing whether it’s 50% for your enterprise cohort and 20% for your self-serve cohort. Engagement failures are almost always cohort-specific, not universal, and aggregate views hide them until they compound into revenue problems.
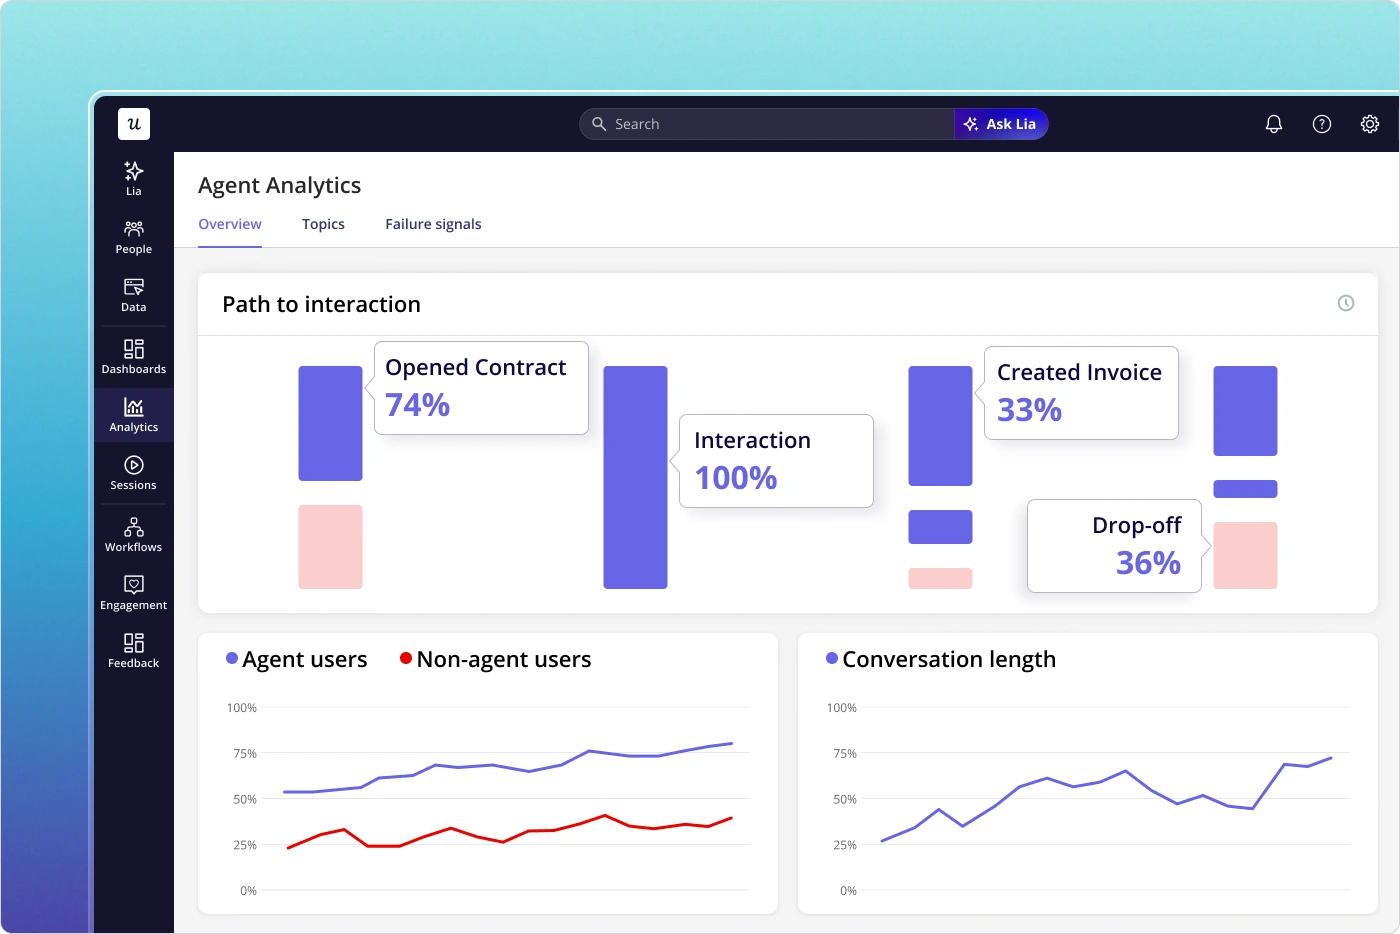
Lia, Userpilot’s AI analytics assistant, changes what’s possible here for teams without dedicated data analysts. You can ask Lia what’s driving a retention drop, which segment has the lowest activation rate this month, or which feature is seeing unexpected drop-off, and get a data-backed answer without pulling a report or waiting for an analyst to free up. That kind of on-demand analysis makes engagement dashboards genuinely useful to people who aren’t already fluent in product analytics, which is most of the people whose decisions the dashboard is supposed to inform.
For teams building their first engagement dashboard, the most common mistake is adding metrics before defining the north star. Start with one north star, three supporting signals, and one qualitative layer. Add a metric when you have a specific decision to make that the current dashboard can’t answer, and remove one that hasn’t driven a decision in 60 days.
James put the timing problem directly when we talked about what AI-assisted monitoring makes possible for his team at scale:
“Churn prevention really has to come from earlier intervention where you’re working with a customer when they are still motivated to be successful with the platform, and the only way that you’re gonna be able to do that early intervention at scale with a large book of customers is if you have meaningful signals to tell you when the customer is likely to be engaged with you and when that level of support is gonna be impactful.”
— James Mitchinson, Head of Customer Success, Userpilot
A dashboard that predicts churn is built before the churn signal arrives. Accounts that warn you through NPS or a falling retention rate are already past the intervention window by the time the data shows up. What separates the accounts you keep is catching the leading indicators early, when the signal still points at something fixable and there’s time to act on it.
About the author