User Segmentation in SaaS: The Definitive Guide


User segmentation in SaaS is more complicated due to different user populations. Most products treat two fundamentally different user populations as one: users who show up to get something done (take an action, see a result, come back) and users who show up to demonstrate they’re getting something done (configure, invite, build dashboards, export reports). Both groups complete onboarding and generate activity metrics that make a dashboard look healthy.
The gap between those two populations only becomes visible in week-one event patterns, and it predicts whether someone stays more reliably than company size, job title, or plan tier. Standard segmentation taxonomies (demographic, firmographic, behavioral, psychographic) answer “who signed up,” not “what did they do in week one and will they come back.” I built the framework in this guide out of watching that gap explain churn, feature adoption failures, and conflicting roadmap signals at Userpilot.
In this guide, I make the case for activation-based segmentation over identity-based segmentation, introduce the outcome vs. effort signal framework for classifying users within your activated cohort, and cover the two 2026 structural changes that break most legacy segmentation logic: dynamic real-time segments and the human vs. agent split.

The two user bases you probably have
Product teams that have watched their cohort data long enough tend to arrive at the same uncomfortable pattern, not from a research paper but from their own retention numbers. Every SaaS product has users who show up to get something done and users who show up to show they’re getting something done. The frustrating part: both groups pay, both complete onboarding, and both generate activity metrics that look like health signals.
What separates them is the type of event they complete in week one. Outcome-seeking users take actions that produce a result and return to check that result: they run a report, send a campaign, complete a workflow, or resolve a ticket. They come back because the product did something they cared about, and that return visit is the retention signal worth tracking.
Effort-signal users spend their first sessions on configuration, team invitations, dashboard building, and data exports, activities that look like engagement but don’t generate a meaningful outcome on their own. Both user types complete onboarding and show up in your DAU count. The distinction only surfaces when you look at what kind of events they’re generating, not whether they’re generating events at all (meaning for your dashboards both are showing as active users).
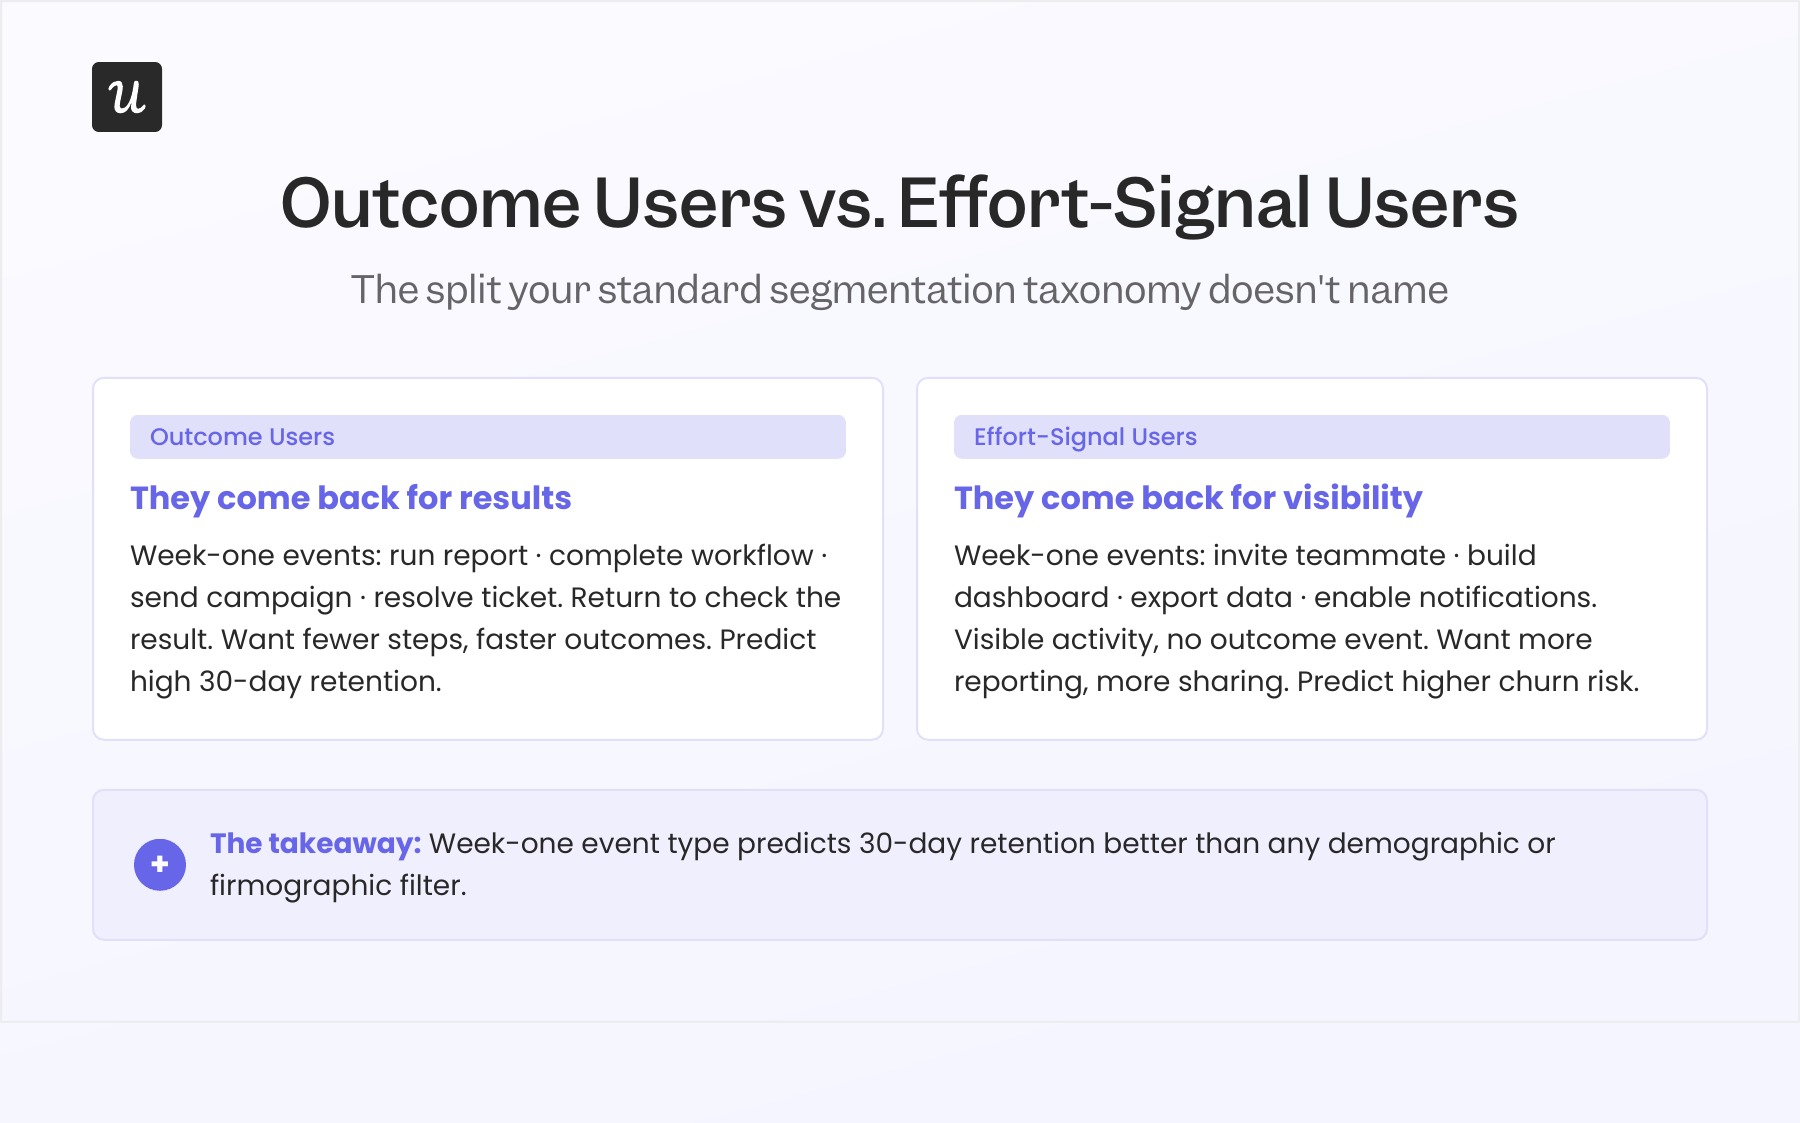
The main difference between these two groups is they give you opposite product feedback: Outcome users want fewer steps to the result and will describe your onboarding as “too long.” Effort-signal users want more visible indicators of activity: more dashboard widgets, more sharing options, more ways to show their manager the tool is in active use. If you don’t know which type is responding when a feedback form comes in, you’ll end up with a roadmap shaped by both signals in tension, and the product will feel overbuilt in some places and thin in others.
The gap doesn’t appear in firmographic data, and a VP of Marketing at a Series B company can be either type, as can a solo founder at a 10-person startup. What distinguishes them is a small set of week-one events you can identify, tag, and use to classify users within their first 14 days, before they churn, convert, or fade into low engagement. The strategy section below covers how to build that classification system in practice.
What user segmentation actually is
User segmentation is the process of grouping users based on shared characteristics so product teams can make different decisions for different groups. The definition is simple, but the part most teams miss is that second half: “make different decisions.”
Segmentation only has value when knowing that User A is in Segment 1 and User B is in Segment 2 actually changes what you do with each of them. If both users receive the same onboarding flow, the same CS motion, and the same in-app message sequence, they’re the same segment in practice regardless of how different their demographic profiles look on paper. Most segmentation projects stop at the “here are our six user segments” deliverable and never connect those segments to distinct interventions, which is why the segments end up sitting in a spreadsheet rather than driving product behavior.
This guide focuses on the product side: what individual user behaviors reveal about what different people need next, and how to act on that signal without waiting for a quarterly data review.
Why firmographic and demographic segments rarely predict retention
Most teams start with firmographic and demographic segments because that data already exists from your welcome sequence. Company size, industry, job title, and plan tier are all in the CRM before a single product event is tracked. This data isn’t wrong, but it answers a different question than the one you need when working on retention: not “who signed up” but “what did they do after signing up, and does that predict whether they’ll stay.”
Jiaona Zhang, CPO at Laurel and a Reforge expert on product strategy and segmentation, identifies a specific backward tendency in how product teams approach churn. Most teams, when they decide to get serious about retention, start by studying churned users: who they were, when they left, what their usage patterns looked like before they left. By the time a user churns, though, the behavioral signals that predicted the churn were present weeks earlier, and the intervention window has already closed.
Starting with activation data is the more productive approach. “What’s different about users who activated versus those who didn’t in the first two weeks?” and “What’s different about users who engaged consistently in week one versus those who drifted?” both give you a signal you can act on before someone leaves. I’ll cover this in more depth in the churn mistake section below.
Userpilot’s benchmark report, drawn from 547 B2B SaaS companies, shows an average activation rate of 37.5%. That means 62.5% of new users never reach the moment the product was designed to create. If your segmentation treats activated and unactivated users as variations of the same “new user” group and routes both through the same onboarding flow, you’re applying the same intervention to two populations with fundamentally different needs, one of which is almost certainly about to churn.
The segmentation logic that actually moves retention is almost never “which industry are they in.” Almost always, it’s “did they activate, and if so, what kind of value did they extract in week one.” Those behavioral signals are harder to collect than CRM fields, which is why most teams default to the data they already have. Building primary segment definitions around behavioral events rather than identity attributes is where the retention improvement comes from.
The complete user segmentation taxonomy
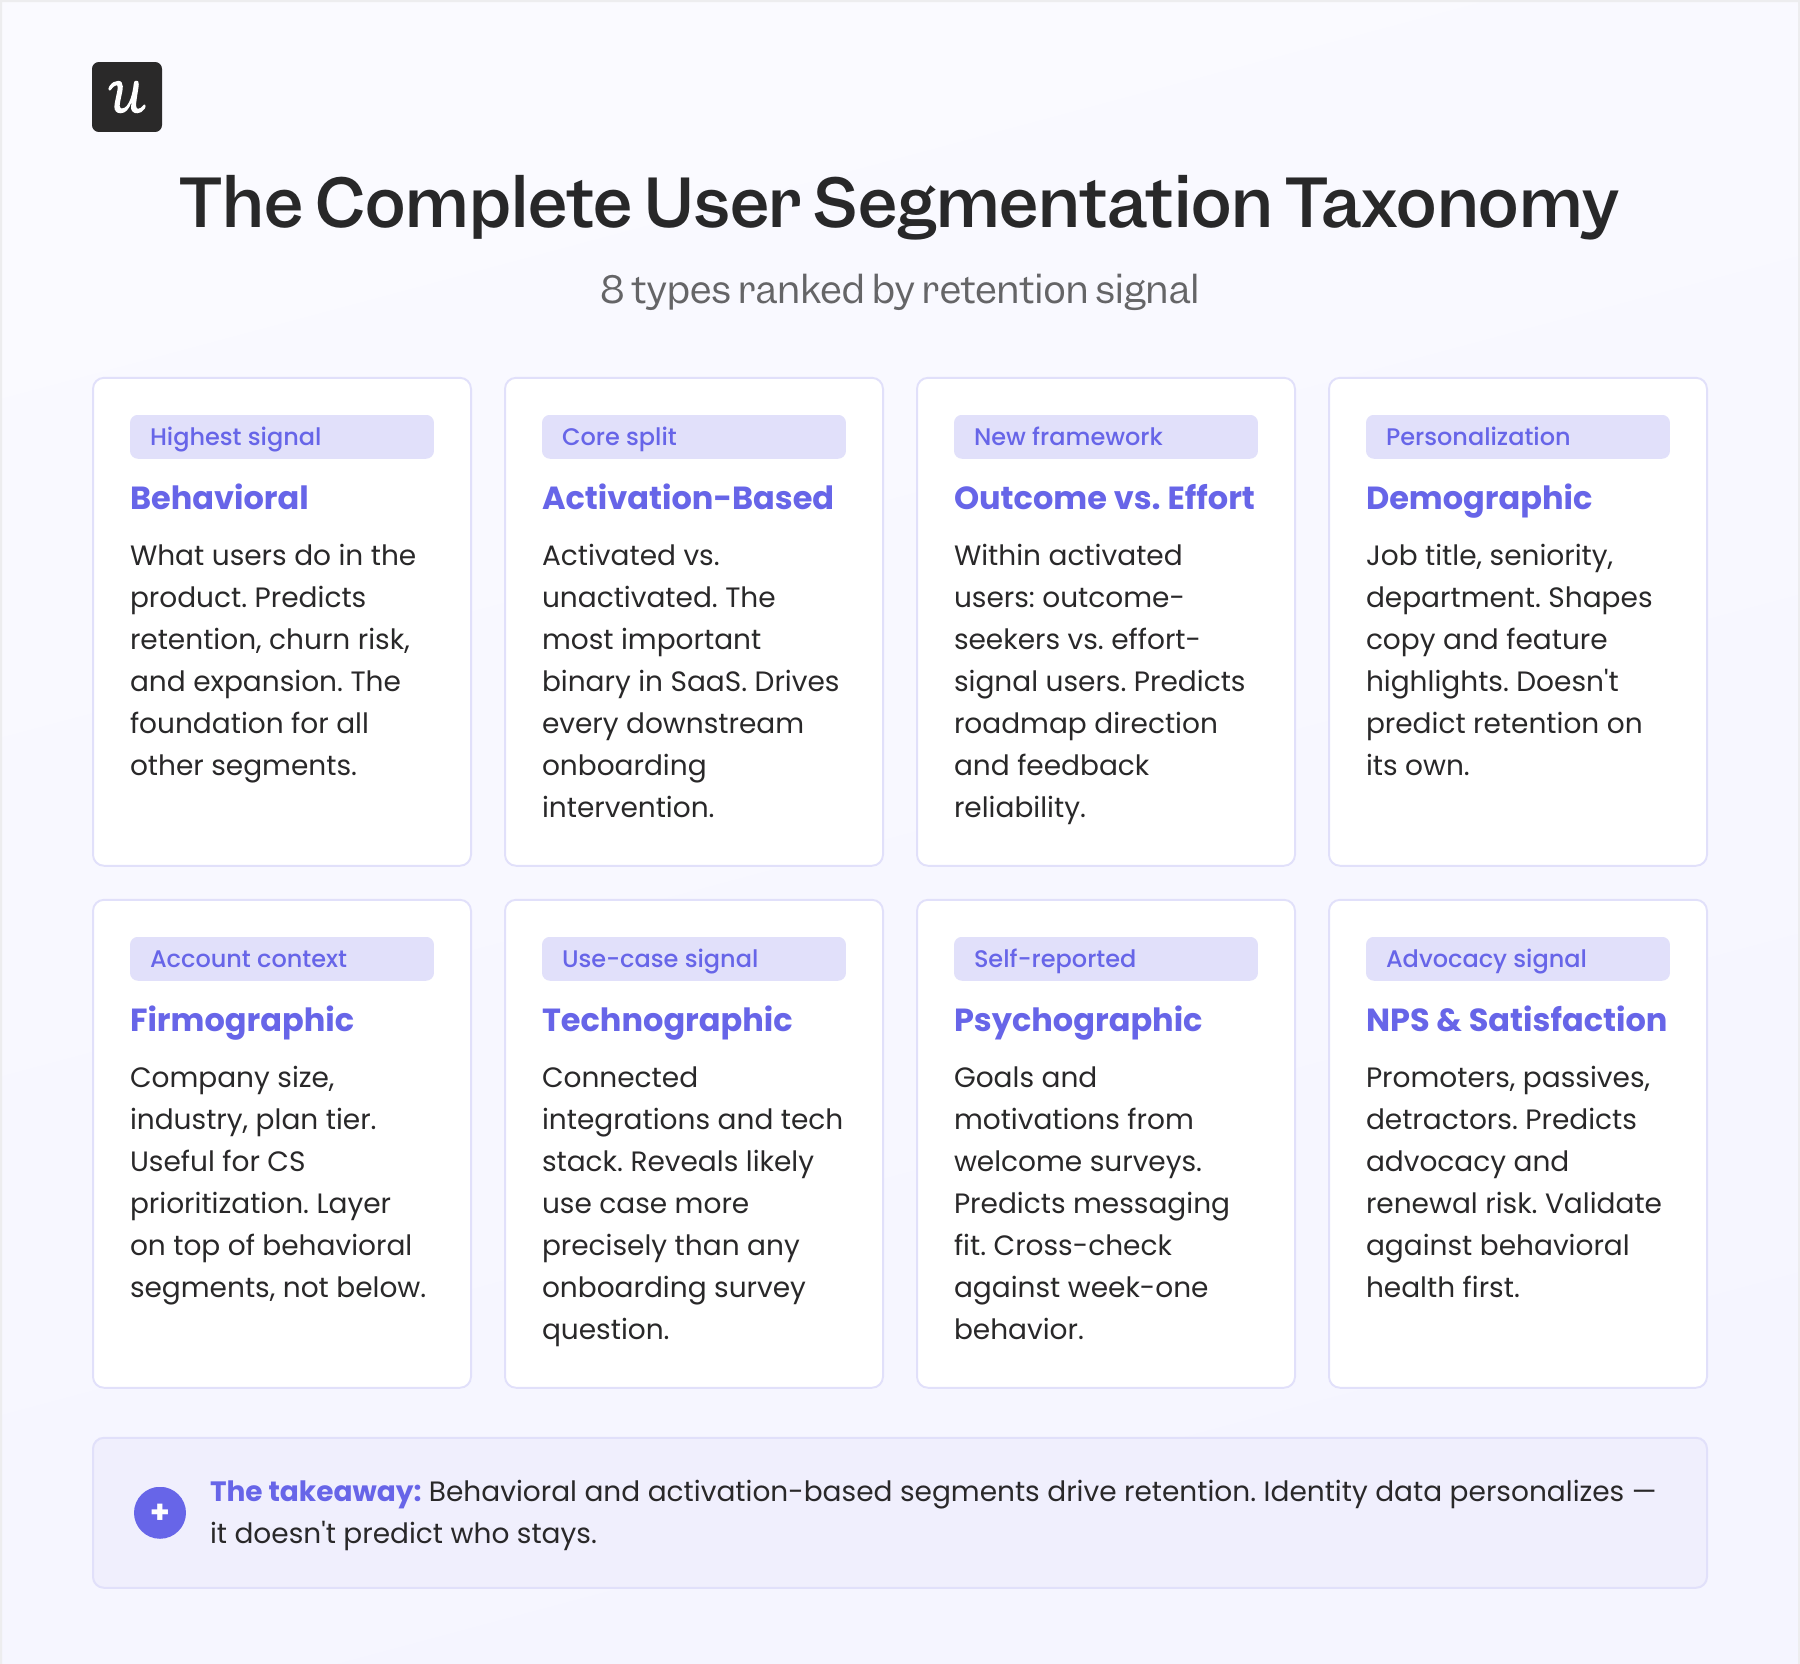
None of the segment types below are mutually exclusive, and most mature product teams use several in parallel. My goal in this section is to be precise about what each type actually predicts and, more importantly, what it doesn’t, so you can layer them in the right order rather than over-relying on whichever type is easiest to collect.
Behavioral segmentation
Behavioral segmentation groups users based on what they do inside the product: which features they use, which events they trigger, how frequently they return, and where they drop off. This is the highest-signal type for product teams because it reflects actual product usage rather than stated intent or demographic proxies. It predicts retention likelihood, churn risk, feature adoption trajectory, and expansion potential better than any other single data source.
At Amplemarket, Staff Product Manager Awni Shamah uses behavioral segments to determine when and how to surface feature guidance. His finding, documented in the Amplemarket case study: “Whenever I add a nudge to a new feature, it boosts adoption by 5x, even 10x.” That lift comes because the nudge targets a behavioral segment that has already shown relevant activity, not the full user base.
I’ve seen the same pattern in our own product work at Userpilot. When we launched the email feature, the funnel showed a sharp drop-off at domain verification, the step required to unlock email sending. Within a few hours, I built a targeting tooltip and surfaced it specifically to users who had accessed the email setup but hadn’t completed domain verification, and the drop-off closed within days without a single engineering ticket.
Activation-based segmentation
Activation-based segmentation is a specific application of behavioral segmentation that deserves its own entry, because the activated vs. unactivated split is the most important binary in any SaaS product. Whether a user has completed an action that produces a real outcome predicts 30-day retention more reliably than company size, job title, or plan tier combined. Userpilot’s benchmark puts average 1-month retention at 46.9% across 83 B2B SaaS companies, and the variance in that number tracks closely with activation-state differences at the segment level.
Beable, an educational platform, demonstrated this clearly when they introduced in-app surveys designed for specific behavioral segments rather than their full user base. The result was a 77% increase in user participation, because the survey reached users at the activation milestone where their feedback was most contextually relevant.
An unactivated user at day 7 needs a direct push toward the activation milestone, not a secondary feature tour. An activated user at the same stage needs discovery pathways for features adjacent to the ones they’ve already found value in. Running one generic flow for all new users past day 3 almost guarantees you’re serving both groups suboptimally.
Outcome vs. effort signal segmentation
Within the activated cohort, users split further into two populations: outcome users and effort-signal users. Outcome users complete actions that produce a result and return to check that result: they ran a report, completed a workflow, resolved a ticket, or sent a campaign. Effort-signal users complete configuration, sharing, and reporting actions that produce visible activity without necessarily generating outcomes on their own: they invited a team member, built a dashboard, exported data, or enabled notifications.
Both event types matter, but they predict very different retention curves and pull the product roadmap in opposite directions. Outcome users want faster paths to the result, while effort-signal users want more visibility into their activity and more ways to share it. Aggregating feedback across both groups without separating them produces a combined signal that pushes you to add features satisfying effort-signal users while slowing outcome users down, and vice versa.
To identify which type a user is, define 3 to 4 outcome events and 3 to 4 effort-signal events for your product, then look at the distribution of those events in each user’s first 14 days. A user with a 4:1 ratio of outcome events to effort-signal events is a strong outcome user, while a majority of effort-signal events identify an effort-signal user. Users in the 40/60 to 60/40 range go into a mixed segment and can be reclassified after another 7 days of data.
Demographic segmentation
Demographic segmentation groups users by personal characteristics: job title, seniority, department, language, and geographic location. It predicts which features are relevant for a user’s job function and which onboarding copy will resonate. It doesn’t predict whether that user is an outcome type or effort-signal type, and it won’t reliably predict retention beyond month one.
The most effective use of demographic data in a product context is as a personalization layer on top of behavioral segments. Knowing a user is a “Head of Marketing” doesn’t tell you whether they’ve activated. It tells you which features to highlight once you’ve confirmed they’re in an activated segment, and it informs the tone and framing of in-app messaging for that personalized experience.
Firmographic segmentation
Firmographic segmentation uses information about users’ companies: industry, company size, revenue, plan tier, and maturity stage. It’s useful for account-level CS prioritization, identifying which accounts warrant white-glove onboarding, and setting context for SMB versus enterprise differences in the product journey. What it doesn’t predict reliably is individual user retention behavior within those accounts.
Enterprise accounts structurally tend to have more effort-signal users because more stakeholders in the buying chain need to demonstrate the tool is being used, and that’s not a product failure but a reflection of how enterprise purchasing gets justified internally. Segmenting by firmographic data without also separating outcome users from effort-signal users inside those accounts gives CS teams a distorted picture of account health. An account full of active effort-signal users with no outcome events is closer to a renewal risk than a health signal, so firmographic context belongs in the behavioral analysis layer, not above it.
Technographic segmentation
Technographic segmentation groups users based on the tools in their tech stack and the integrations they’ve connected. It predicts which integrations to surface in onboarding and which use cases are most likely for that user. This type is particularly useful in products with deep integration ecosystems, where a connected tool often reveals the use case more precisely than any onboarding survey question.
A user who connected Salesforce in their first session is almost certainly using your product in a CRM-adjacent workflow. A user who connected to Slack is using it for team communication or behavioral alerts. Neither piece of information predicts retention on its own, but both are high-quality signals for which feature adoption sequence to run and which onboarding path to assign, especially when layered on top of behavioral segment data.
Psychographic segmentation
Psychographic segmentation uses self-reported information about user goals, motivations, and values, most commonly collected in onboarding surveys. It predicts tone and messaging fit, which can meaningfully improve onboarding response rates. Its primary limitation in a B2B product context: users report what they’re supposed to say, especially when the stated goal aligns with what the buyer told the rest of the team when they sold the tool internally.
A user who writes “improve team outcomes” in the onboarding survey may spend their first three sessions building dashboards and inviting teammates, which is effort-signal behavior regardless of their stated intention. Psychographic data needs to be cross-referenced against actual week-one event patterns before it’s used to classify users for retention work. Use welcome surveys to personalize onboarding copy and messaging tone, not as a substitute for behavioral classification.
NPS and satisfaction-based segmentation
NPS-based segmentation divides users into promoters, passives, and detractors. It predicts advocacy likelihood and renewal risk, particularly for detractors. Its known limitation: effort-signal users tend to score higher on NPS than their actual retention trajectory would suggest, because they’ve invested in the appearance of success and are unlikely to publicly rate the product poorly when their team can see the response.
A promoter who is also an outcome user is a genuine advocate worth recruiting for case studies and referrals. A promoter who has never completed an outcome event is a relationship asset that may not survive the next contract renewal. Use NPS data for identifying advocacy opportunities, but validate the retention signal against behavioral health before acting on it as a health indicator.
What changes in 2026: Dynamic segments and the human-vs-agent split
Two structural shifts are breaking the assumptions most segmentation systems were built on. Both are worth treating as first-principles problems rather than incremental updates to existing logic.
Static segmentation can’t keep up with how users actually move
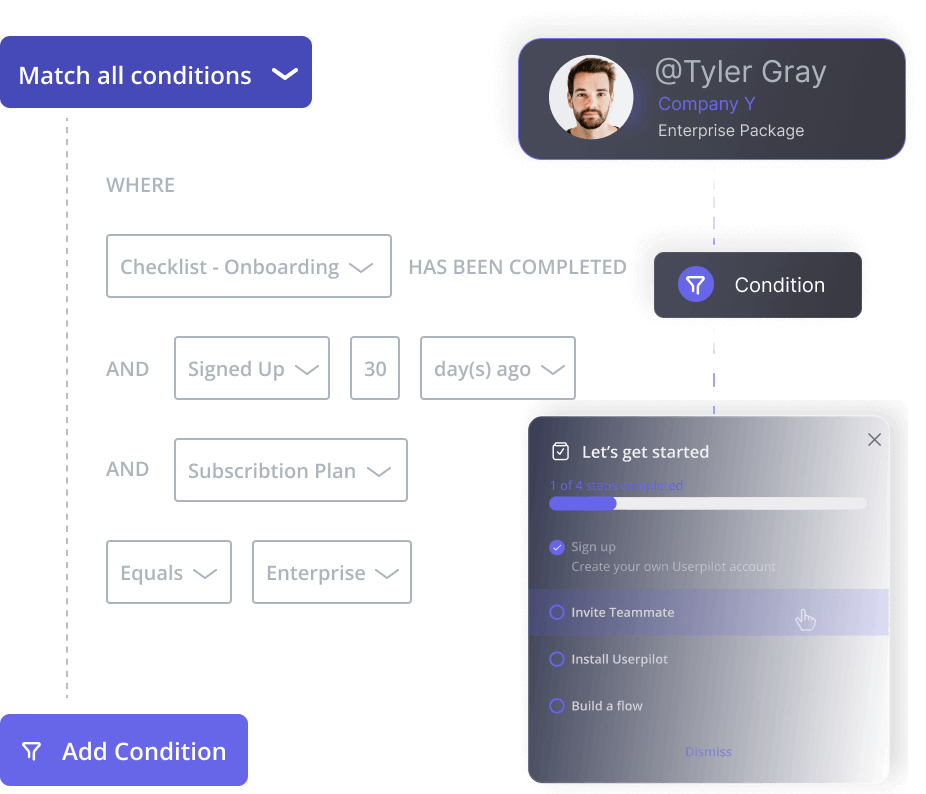
Traditional user segmentation is periodic: you define segments, build flows and interventions for each one, and revisit the logic quarterly. Users move faster than that, since an unactivated user at day 7 might activate at day 12, a power user might go quiet for three weeks without churning, and an effort-signal user might complete their first outcome event and shift their trajectory entirely. A segment defined in March will misclassify a meaningful portion of your user base by May, and the interventions designed for those stale segments will fire at the wrong users.
The fix is behavioral triggers that update segment membership in real time rather than on a review cycle. When a user completes an activation event, they should exit the “unactivated” segment and enter the “activated” segment immediately, and if an outcome user’s outcome events drop below the threshold for 14 days, they should enter a re-engagement segment without waiting for a weekly data pull. Dynamic segment logic that reacts to behavior as it happens replaces the static cohort snapshots that most analytics tools were originally built to produce.
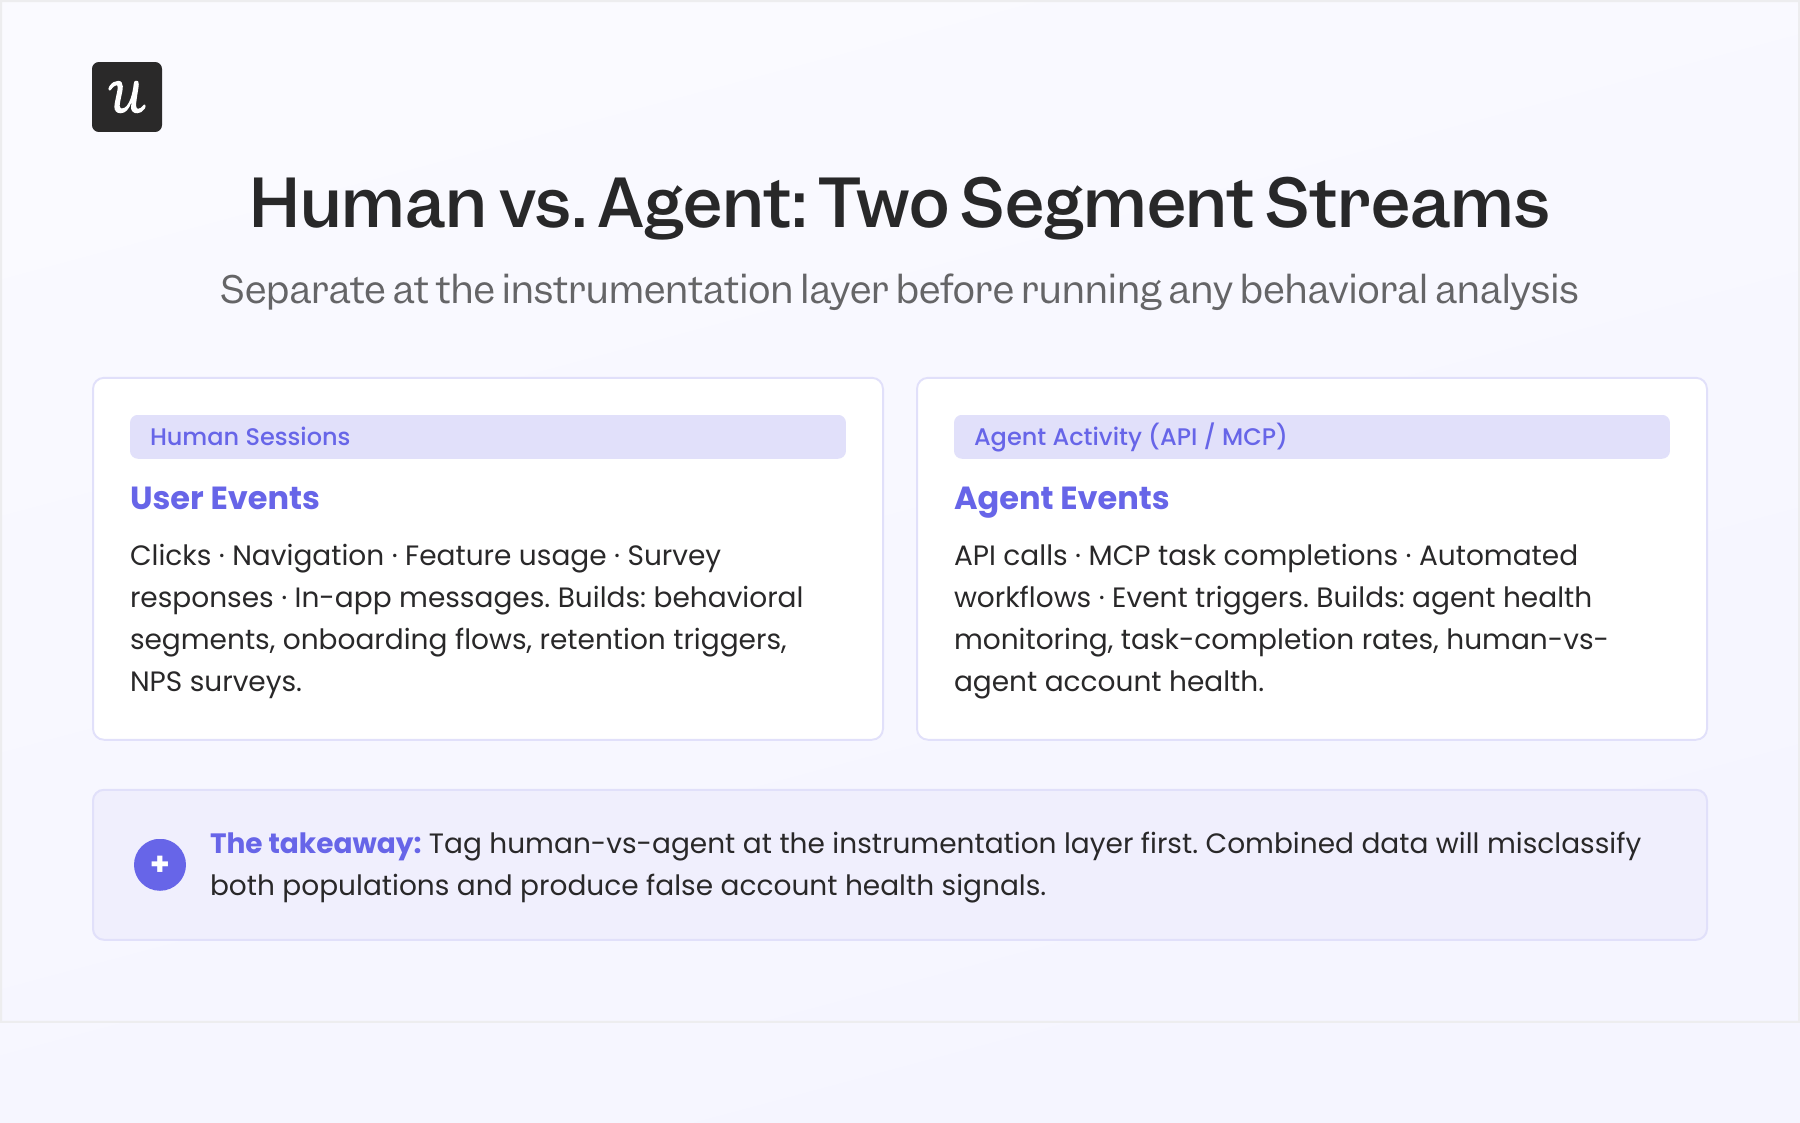
Human vs. agent as a foundational segment type
Gartner forecasts that 40% of enterprise applications will have embedded AI agents by the end of 2026, up from less than 5% in 2025. Those agents interact via API and MCP, generating events and triggering features continuously without opening a human session. They don’t click, they don’t navigate, and they don’t trigger the event patterns your analytics was built to track for human users.
An account where an agent runs 300 automated tasks per week looks like a high-engagement power user in a standard behavioral segment, while the human team inside that account may be almost entirely disengaged. Acting on that account as healthy, based on combined activity data, is exactly the kind of analytical mistake that produces a surprise non-renewal. Adding user type (human vs. agent) as a foundational attribute at the instrumentation layer, before running any behavioral analysis on accounts with API or MCP activity, is the fix.
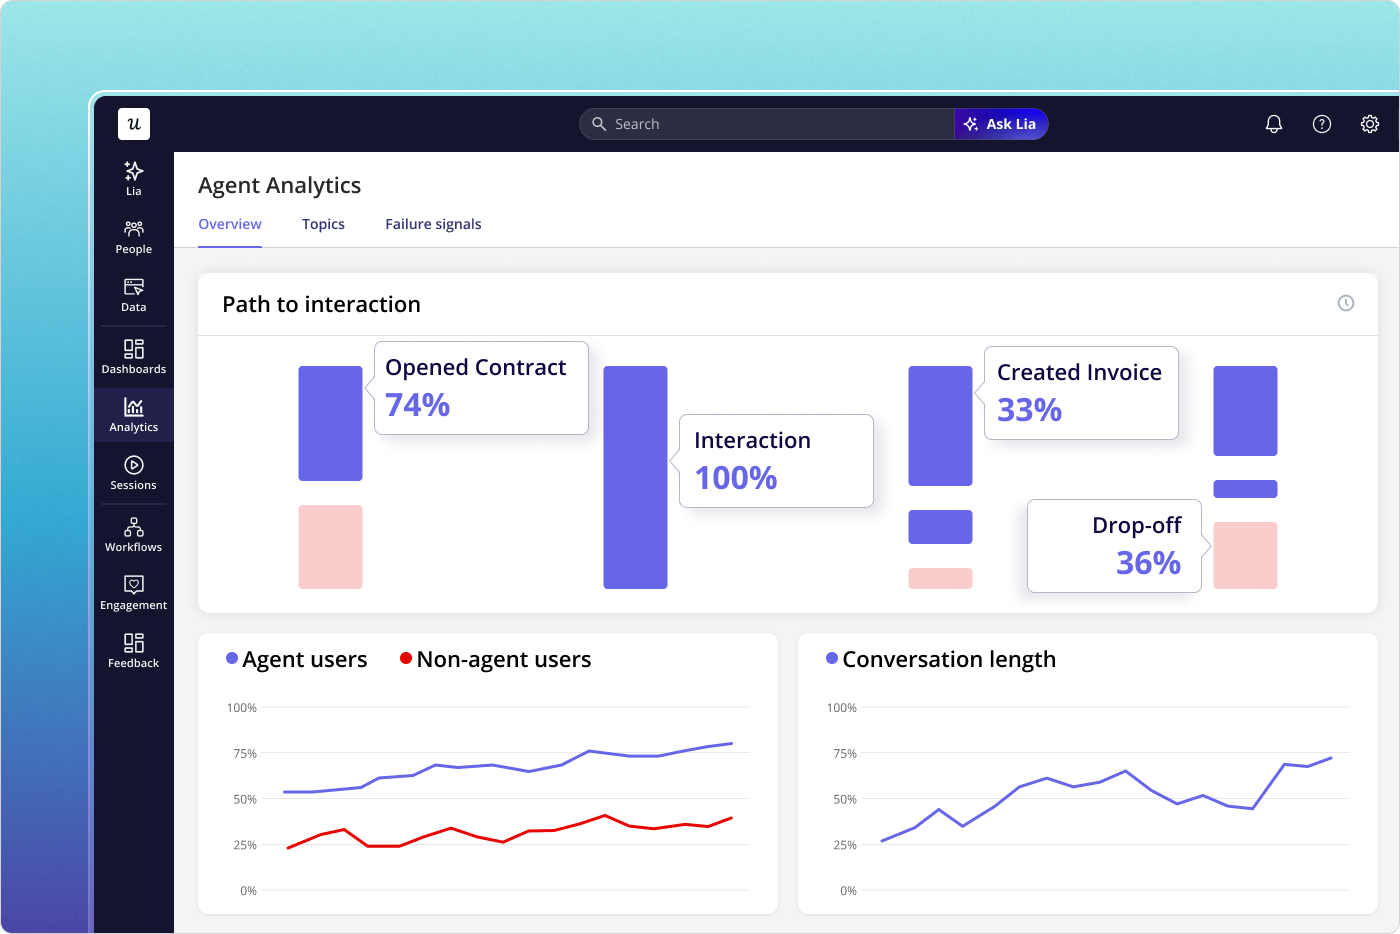
Userpilot’s Agent Analytics addresses this directly. It separates agent-generated events from human sessions and tracks both independently, so you can build behavioral segments on human activity alone, monitor agent task completion separately, and identify accounts where human engagement and agent activity are moving in opposite directions. For any product with customers who have active MCP or API integrations, this separation is no longer optional.
How to build a user segmentation strategy in 8 steps
A segmentation taxonomy is the vocabulary. Building a strategy means connecting each segment to a distinct intervention, a success metric, and a trigger for moving users between segments as their behavior changes. Here’s the sequence I’d follow for a B2B SaaS product starting from scratch or rebuilding a segmentation system that isn’t producing results.
Step 1: Define your activation milestone: “This user got a real result from the product” should map to a specific event or event combination, not a time-based proxy. If users tend to get their first result around day 3, the milestone should be the event that signals the result, not “day 3” as a date. Time-based activation points misclassify fast activators and slow ones equally.
Step 2: Separate activated from unactivated users as your primary split: Set a 7-day window for most self-serve products (14 to 21 days for products with longer setup requirements, longer for enterprise) and run everything in the strategy separately for each group. These are different populations with different needs, not a spectrum of the same population at different stages.
Step 3: Classify outcome users versus effort-signal users within the activated cohort by defining 3 to 4 outcome events and 3 to 4 effort-signal events for your product. Users with a majority of outcome events in their first 14 days are outcome users, while a majority of effort-signal events identify an effort-signal user. A 60/40 split in either direction is sufficient for initial classification, and ambiguous cases can be reclassified after another 7 days of data.
Step 4: Tag user type at the instrumentation layer: For any account with API or MCP activity, add a human-vs-agent attribute before running behavioral analysis, because human and agent events tracked together will produce behavioral segments that misclassify both populations. Do this before building any segments for accounts with connected workflow automation tools or API integrations.
Step 5: Layer identity attributes for personalization, not for retention prediction by adding demographic and firmographic data on top of defined behavioral segments to personalize the experience within each group. A VP of Marketing in the “unactivated at day 7” segment gets different messaging than an SDR in the same segment, but both need to reach the activation milestone before any other product intervention matters. Identity data shapes the message; behavioral data shapes the segment.
Step 6: Set intervention triggers for every segment, since segments without triggers are observation tools rather than growth tools. Define at least one intervention that fires automatically when a user enters each segment (an in-app flow, a targeted email, a CS task creation, a survey) and a success metric for each trigger so you can measure whether it’s working. The trigger mechanism is where most of the retention improvement comes from, not the segment definition itself.
Step 7: Separate feedback channels by user type, since outcome users and effort-signal users respond to different problems and their requests conflict directly. People in the outcome group want fewer steps and faster results, while effort-signal users want more visibility and more reporting options. Aggregating user feedback without separating by type will consistently push you to add features that satisfy effort-signal users while slowing outcome users down, so weight outcome-user input more heavily for core product decisions.
Step 8: Review segments quarterly and cut the ones that don’t drive distinct interventions: Any segment where both groups receive the same onboarding flow, the same CS motion, and the same in-app message sequence provides no operational value and should be cut. Fewer segments connected to clear actions beat more segments that just describe the population without changing what you do for each one.
How to implement this in Userpilot
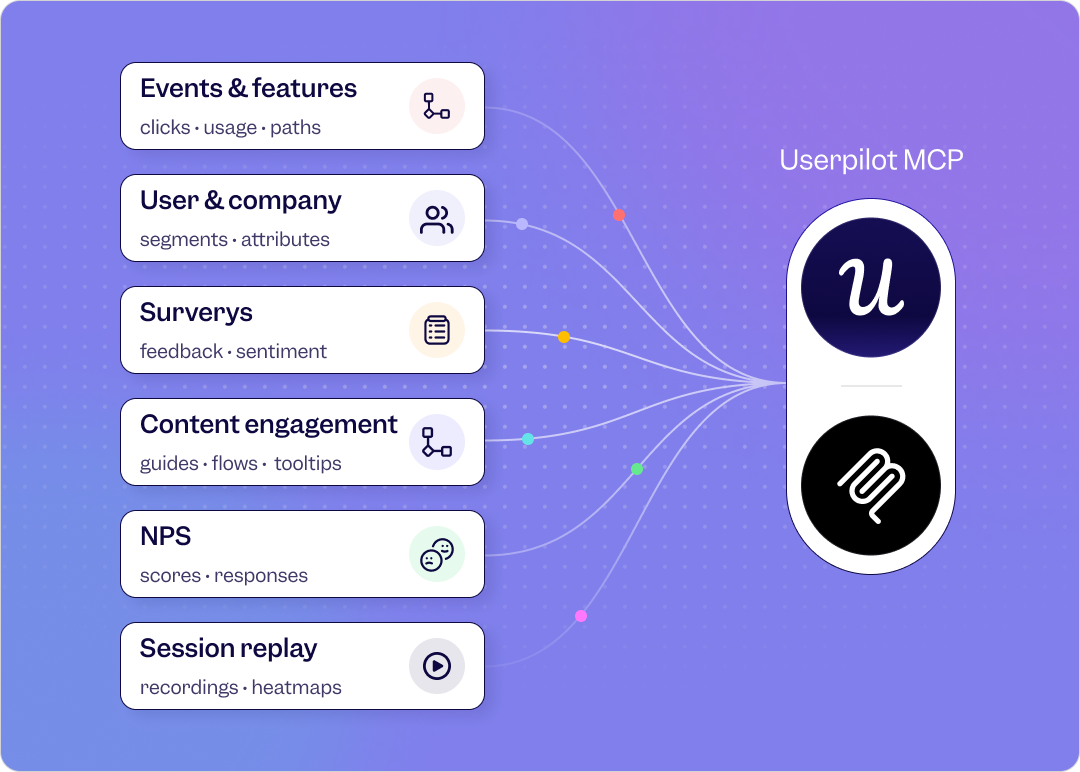
The steps above require a tool that can track behavioral events automatically, build dynamic segments on those events in real time, and trigger in-app experiences for specific segments without an engineering ticket for each deployment. That’s the core capability of Userpilot’s analytics and engagement platform, and it’s how the examples throughout this guide were built in practice.
Event tracking starts automatically after SDK installation. For outcome and effort-signal classification, you label the relevant events using Userpilot’s visual no-code labeler and build segment conditions on those events without writing a query or waiting for an engineering deployment. Dynamic segment membership updates in real time as users complete or stop completing the defined events, so the onboarding flows for each segment reflect current behavior rather than signup state.
Lia, Userpilot’s AI agent, handles natural language segment queries across all segment types. You can ask “show me all accounts where users completed only effort-signal events in their first two weeks” or “which activated accounts had declining outcome events last month” and get a usable segment list without defining conditions manually. For teams managing a large number of segments, Lia reduces the time between a retention question and an actionable segment from hours to a few minutes.
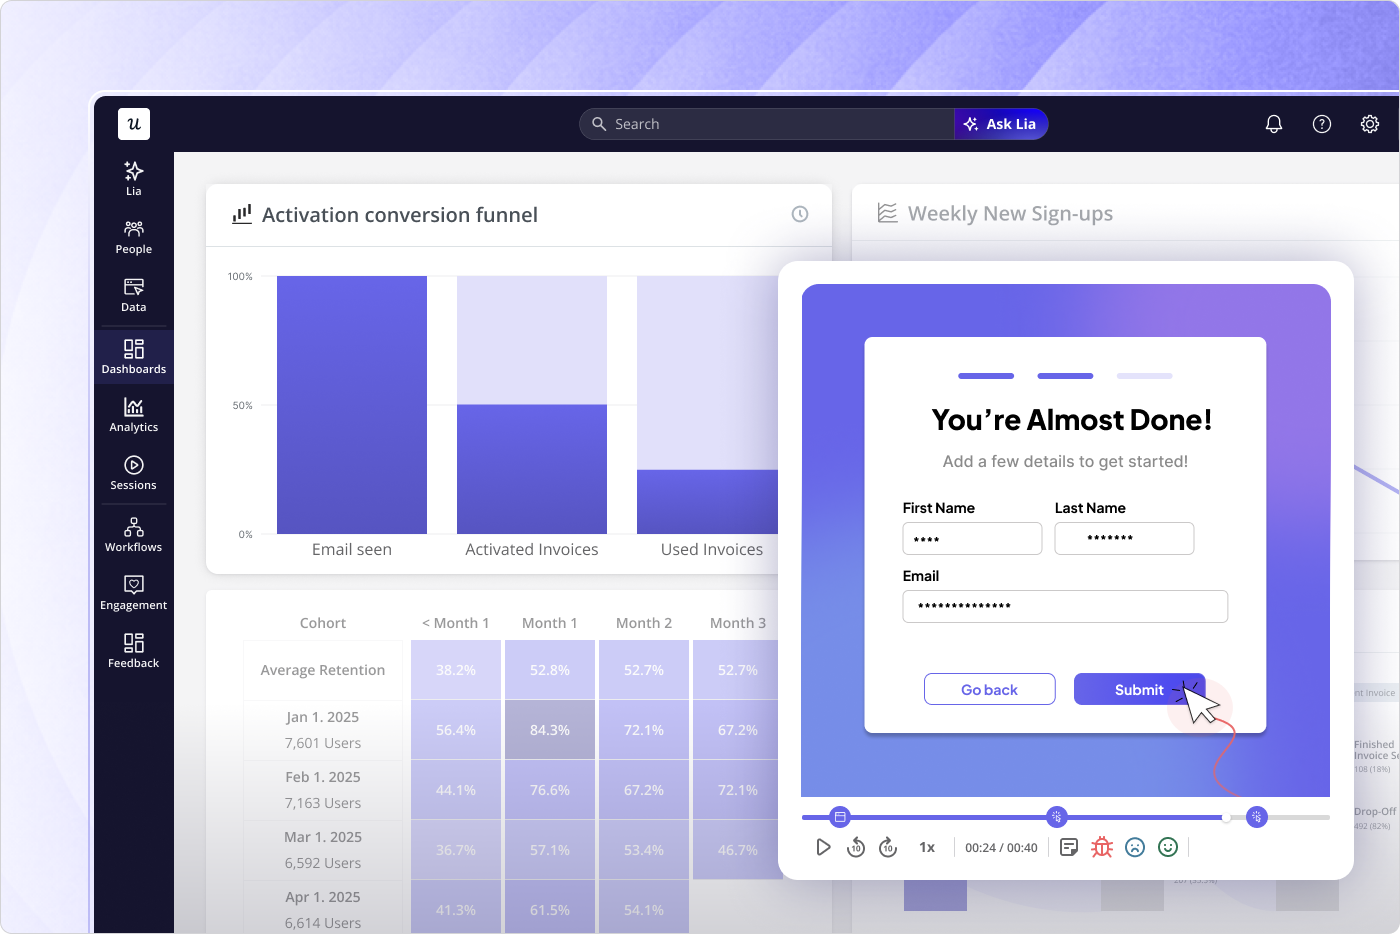
The activation dashboard covers step 2 split, showing your activation rate, time to activation, and the specific steps where users drop off before they reach the milestone. NPS and satisfaction-based segmentation uses Userpilot’s survey tool to trigger surveys to specific behavioral segments and filter results by group for direct comparison. Firmographic and demographic layering brings in CRM data via integrations and applies it as additional conditions on top of behavioral segment logic.
If you want to see what the activation dashboard, segment builder, and behavioral triggers look like for a product in your category, book a demo and we’ll walk through the setup together.
About the author