What Is Feature Usage Rate and How to Measure It


It’s no no-brainer that tracking product analytics is a key part of identifying improvement opportunities and shaping a successful product. But uncovering valuable insights is about more than just measuring random metrics, it’s vital to be strategic about what you choose to track.
For example, tracking vanity metrics like page views and the number of sessions in isolation doesn’t give you any meaningful data to act on. In this regard, one actionable metric to track is feature usage rate, a metric that leading companies like Hubspot and Salesforce are prioritizing.
In this article, we’ll have a deeper look at feature usage, help you calculate it, and interpret it meaningfully to drive real change.
What is feature usage?
The feature usage rate measures how many users have engaged with and adopted specific features in your product.
While the two may seem interchangeable, keep in mind that feature usage is not the same as product usage. Product usage focuses on the user’s behavior toward the overall product, whereas feature usage only focuses on a particular feature.
Why should you track feature usage?
Tracking the feature usage rate helps you assess the impact and relevance of different product features to users. This helps you to:
- Prioritize product development: Identify your product’s most important features and prioritize your future development efforts on features your users need.
- Improve user engagement: Identify the features driving value in your product and help users engage more with them. You can also tailor the user experience to encourage their adoption.
- Drive user retention: Identify difficult-to-use or irrelevant features and address existing pain points to improve satisfaction and boost user retention.
When should you track the feature usage rate?
It is good practice to regularly measure this metric to keep a pulse on user engagement, however, there are certain instances across the user journey where tracking feature usage becomes an absolute necessity. Some of these instances include:
- After user onboarding: Track feature usage among new users to gauge the impact of onboarding guidance in driving feature adoption.
- New feature launch or product update: Check the performance of new features or updates to see if they’re beneficial in improving the user experience or not.
- A sudden drop in user activity: Measuring feature usage at these points helps determine adoption drop-off points, thereby narrowing down improvement areas.
How to measure feature usage rate in 5 steps
1. Determine the key metrics for tracking feature usage
To correctly calculate the feature usage rate, you must first determine several key metrics that make up the rate, such as:
- Active users: How many unique users interacted with your product?
- Feature users: How many users are using the feature?
- Usage frequency: How often do they use the feature?
- Usage length: How much time do they spend on the feature?
- Time frame: What is the length of time for which feature usage is being measured?

2. Set up a product analytics tool to collect feature usage data
Tracking metrics manually is a lengthy process. You have to collect data, compile and compare it, and repeat the process regularly for meaningful results. In short – it burdens your product team.
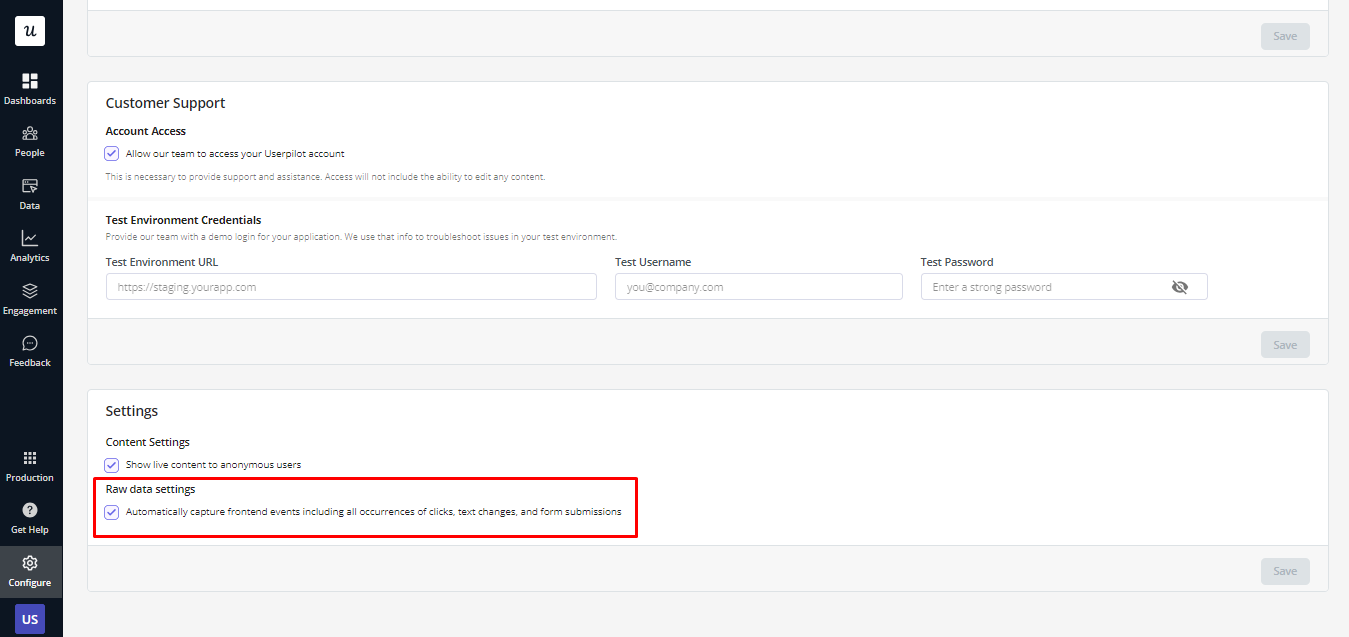
Instead, try tracking tools that enable you to seamlessly automate and scale your data collection efforts. For instance, a good tool like Userpilot has an auto-capture feature, which by default records all user actions users perform inside the app such as clicks, infills and form submissions.
You also can create custom events if you want to track multiple events as a group in instances where using a feature may involve multiple actions.
For example, let’s say you have a billing app with an auto-billing feature. To utilize the specific feature, users have to click on it, fill in auto-billing details, click set up, etc. All these count as multiple events, all within the same process.
3. Dig deeper into user behavior data to identify trends
By this point, you’ve done enough to collect all necessary data. Now it’s time to dig into the numbers.
Many analytics tools provide simple dashboards for tracking user behavior trends and patterns. You can view all-time trends or track interactions for a specific period.
Dig deep into the data to easily identify your most used features, see how feature usage has evolved, and more. You can dig even deeper to see what users were doing before getting to a feature.
For example, you can see when users are most active when using a new feature, or just compare various features’ usage rates for the same segment.

Here are 2 additional ways of analyzing trends:
Look at feature usage for different user segments
To better understand user behavior, have a look at how different users interact with each feature. This is because user engagement often varies according to each user’s needs.
By tracking feature usage by user segment you can identify patterns and trends that are specific to particular groups and see how each group interacts with a feature.
For example, you can identify the top features for each user segment, determine which features power users use, compare feature usage between old and new customers, etc.
Analyze the impact of a particular feature on retention
User retention is key to the success of any SaaS business. Your goal, therefore, with feature usage analysis is to build up feature engagement, making your product more valuable to users.
To measure the impact of feature usage on retention, you can create cohort tables to:
- Compare the usage rate of retained versus churned users.
- Identify which features are most used by retained users.
- Determine which features are most used during the periods with the highest retention rates.
- Learn how each feature correlates with retention.

Ready to get started with feature usage tracking?
Feature usage analysis can help you unlock valuable insights into your product and how it is used. From understanding users’ needs to identifying friction in the user journey, it’ll pave the path for product growth.
To successfully conduct feature usage analysis, you need the right tools. Userpilot equips you to collect, analyze, and act on relevant feature usage data points. Book a Userpilot demo today to see how its powerful insights can help you improve your user experience.
![]()
Try Userpilot and Take Your User Satisfaction to the Next Level

About the author