Are you wondering how to conduct user behavioral analysis to inform your product decisions?
If so, you’re in the right place. This article explains:
- What user behavioral analysis is
- Why it’s important
- The key steps in the analysis process
- Different types of analyses
Let’s dive right in!
Try Userpilot Now
See Why 1,000+ Teams Choose Userpilot

What is user behavior analytics?
User behavior analytics (UBA) is a research method that involves studying user interactions with the product at different stages of the user journey.
The process involves collecting, organizing, visualizing, and analyzing user behavior data, and it aims to track product performance so product teams can find ways to improve the user experience.
What is the importance of tracking user behavior data?
Tracking user behavior data is crucial for several reasons, especially when refining and optimizing product development and user experience.
- For starters, by understanding how users interact with a product and their pain points you can make informed decisions on how to improve the overall user experience. This could be by simplifying navigation or personalizing the product experience to their unique needs.
- Moreover, data on user behavior offers insights into which aspects of the product are working well and which are not. This is essential for incremental product innovation.
- Finally, more and more teams use AI and machine learning to analyze patterns in user behavior data for predictive analytics. This allows them to forecast product performance or predict future trends and act proactively to stay ahead of the curve.
Key steps for analyzing user behavior insights
With the theory out of the way, let’s have a look at what user behavior analysis looks like.
1. Define your objective
Defining your research goals is essential as it allows you to focus on the right data.
For example, a good goal would be to ‘improve user activation by 47% by the end of 2024 Q1′ (just like Attention Insight did by implementing interactive onboarding with Userpilot).
See how specific and clear the goal is?
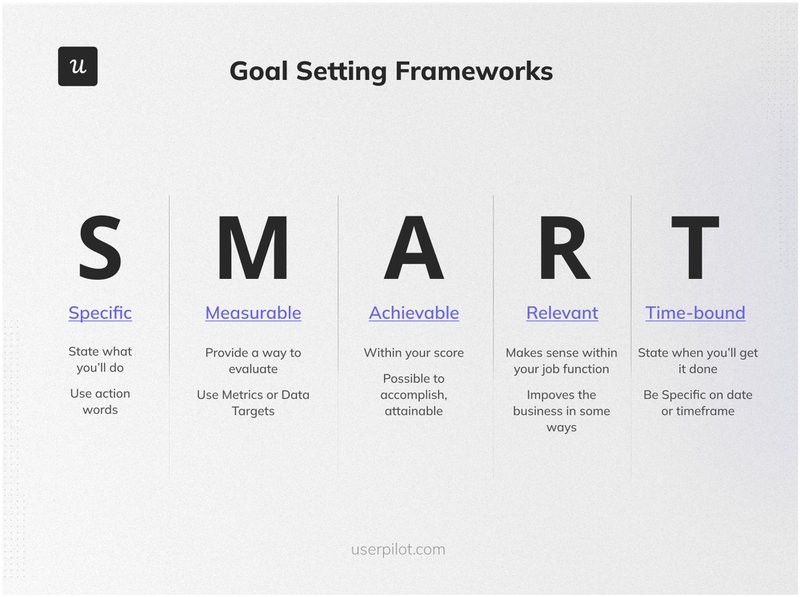
If you’re not sure how to set actionable goals, use a goal-setting framework like OKR or SMART (or both of them together).
2. Select the relevant metrics for analyzing user data
Once you have the goal, choose relevant metrics to track progress toward your goal.
For example, if your goal is to improve activation, the activation rate is the main metric. That’s your North Star metric.
Next, choose a set of supporting metrics that will provide you with granular insights into relevant aspects of user behavior.
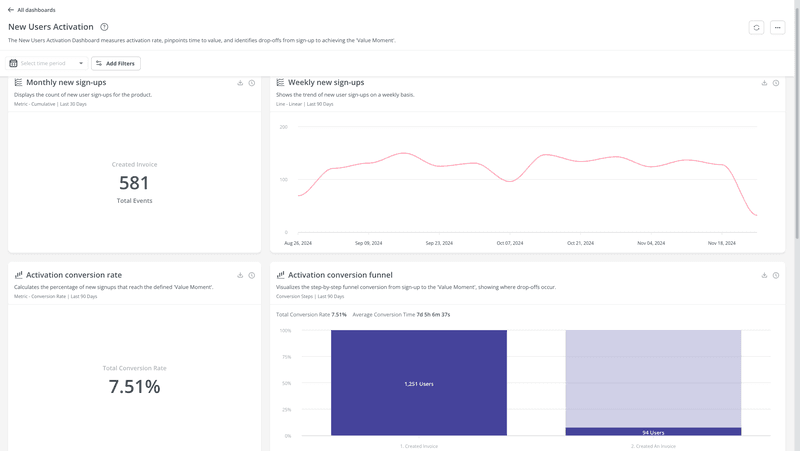
For example, this could be monthly sign-ups, conversion rates at all the stages of the onboarding process, or time to activation.
3. Pick the appropriate user behavior tracking method
With the goal and metrics in place, it’s time to choose the right method to track user behavior.
For example, you can use Google Analytics to track user engagement with your landing page and a product analytics tool such as Userpilot to track user actions inside the product.
As a SaaS PM or PMM, you’re very lucky, as all user interactions with the product are digital, so it’s easy to track them.
But it gets even better.
Thanks to integrations, you can consolidate all the data and visualize multiple data sets in a single dashboard. That’s if your analytic tool allows this, of course. (Userpilot does!)
4. Analyze user behavior data to find engagement and friction areas
Having collected and visualized the data, you’re ready for its analysis.
What analysis method you choose depends on your goals.
For instance, if you’re improving user activation, start with funnel analysis. By tracking the conversion rates at different stages and the time users need to convert, you can identify the general area in the onboarding flow where users experience friction.
Next, gather more in-depth insights by analyzing user paths and session recordings. That’s how you identify the root cause analysis.
Finally, use the insights to modify the onboarding flow and repeat the process to see if the intervention was successful. Rinse and repeat until you hit your target.
Types of user behavior analysis
What kinds of user behavior analysis can you conduct? Here are a few options that we’ve found particularly useful.
Funnel analysis
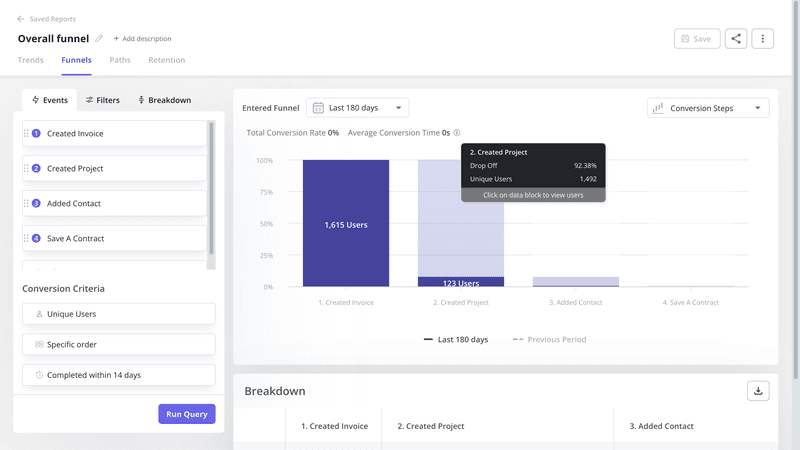
Funnel analysis allows you to track user conversions at different stages in the user journey and identify bottlenecks.
Let’s imagine you run an e-commerce site and want to boost sales. To buy a product, users need to take 3 steps: visit the home page, visit the product page, and purchase the product. Funnel analysis shows you how many users complete each step and how long it takes them.
Here’s the real kicker.
The results are super-easy to interpret. Sometimes, one look at the chart is enough to see at which stage users drop off as the funnel gets dramatically narrower.
Path analysis
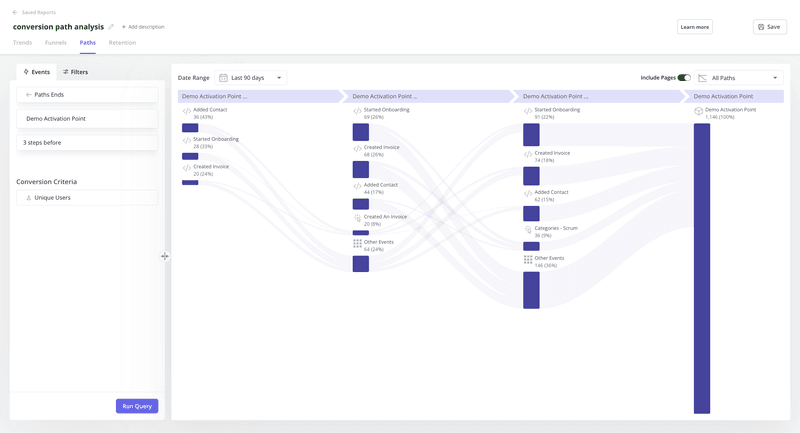
Path analysis is more detailed than funnel analysis as it gives you insights into all the user actions leading up to or following a conversion.
Such insights are valuable when you’re trying to identify the exact friction points in the user journey.
Path analysis can also help you outline the most optimal path to user activation or adoption by analyzing the behavior of your power users.
Once you have the information, you can design your onboarding experience to replicate the happy path for other users.
Trend analysis
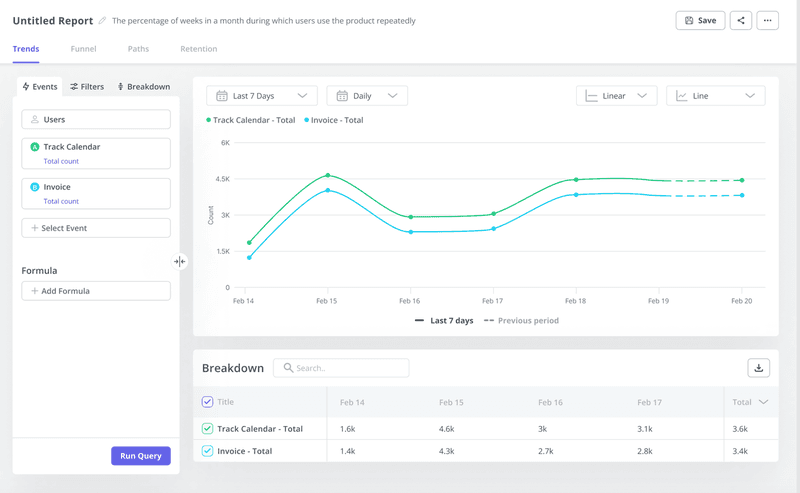
Trend analysis is used to track changes in metrics over time.
For example, if your focus is user activation, you would track trends in the activation rate. This would help determine if product changes have been successful.
Moreover, trend analysis charts are useful for identifying correlations between metrics and formulating hypotheses about causation.
For example, if you can see that a drop in feature usage overlaps with a drop in product adoption, it may indicate that the two are linked.
Feature and event analysis reports
Feature and event analyses both refer to specific user interactions within the product.
Events analysis has nothing to do with event management. It deals with specific user actions inside their product and their impact on customer success. For instance, it can help you pinpoint user actions that lead to user churn so that you can proactively engage users and stop them from leaving.
Feature analysis is about user engagement with individual features. It tracks metrics like feature adoption, frequency of use, time spent on each feature, and the impact of features on overall user engagement and satisfaction.
It can help teams identify the most and least valuable features for different user segments to make informed prioritization decisions.
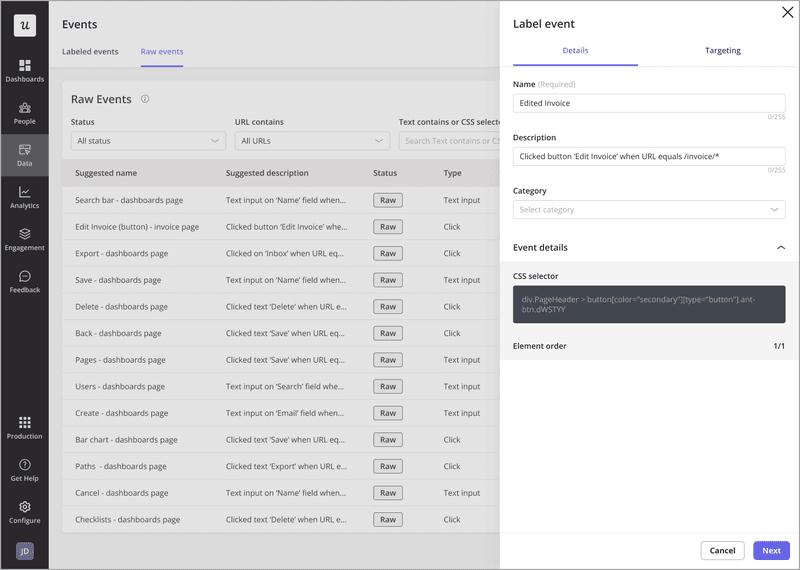
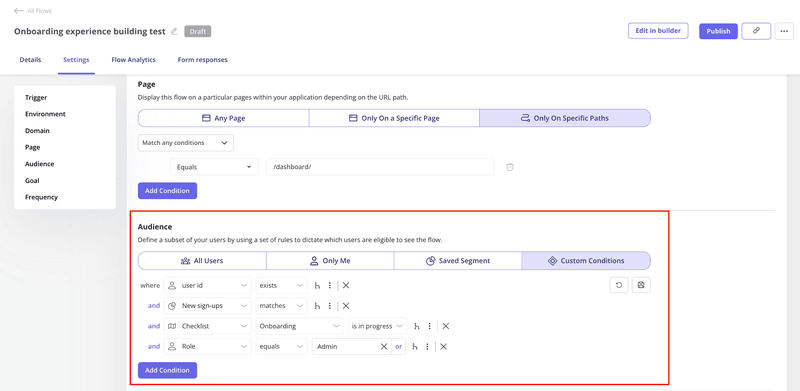
With Userpilot’s auto-capture feature, you have instant access to event data for analysis. Unlike other analytics tools, you won’t waste time setting up tracking and waiting for data – it’s all captured automatically.
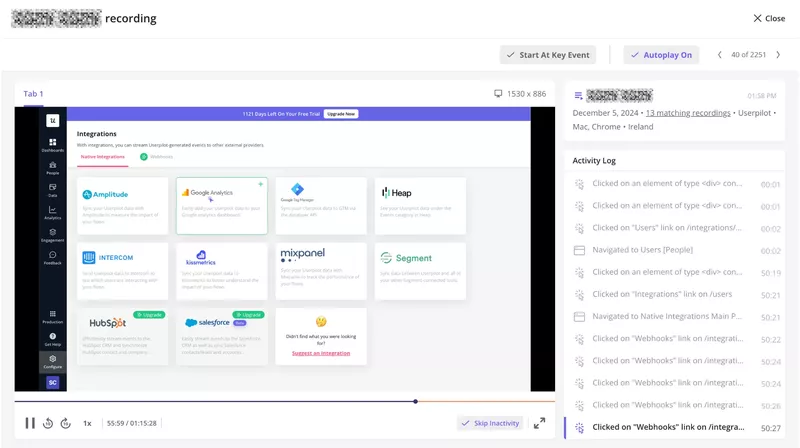
Session recordings
By watching the replays, you can see every action the user takes on a webpage or inside the product – every click, scroll, and hover. Or lack of action, when the user gets stuck.
This makes it the ultimate UI optimization tool.
Want to hear the exciting news? Session recordings are now available in Userpilot.
Conclusion
User behavior analysis is essential for product teams that don’t want to rely on hunches or luck when making product decisions.
When combined with customer feedback, it provides a comprehensive view of user needs, wants and pain points. Such insights are invaluable for improving user experience and innovating the product so that delivers even more customer value.
If you want to see how Userpilot can help your teams analyze your user behavior, book the demo!
User behavior analytics FAQs
How does UBA work?
UBA, for product teams, involves tracking and analyzing how users interact with a product or website. It collects data on user actions like clicks, page views, feature usage, and time spent on specific tasks to understand user journeys and identify areas for product improvement.
What is the difference between UEBA and SIEM?
In the product context, you don’t really need to know about UEBA and SIEM. They are primarily cybersecurity tools. Product teams mainly focus on UBA to understand user behavior within their product, not for security monitoring.
What is an example of user behavior?
User behavior includes actions like clicking buttons, navigating through different pages, using specific features, completing (or abandoning) forms, and interacting with content. For example, tracking how many users who start a free trial actually complete the onboarding process is analyzing user behavior.


