How to Analyze Open-Ended Survey Questions


Open-ended survey questions help SaaS teams collect detailed qualitative feedback, but analyzing survey responses at scale can be challenging.
This article explains practical methods for analyzing open-ended survey responses and turning them into actionable insights.
What is an open-ended question?
Open-ended survey questions invite open-ended responses. They are worded in a manner that requires an explanatory, subjective response, rather than a simple “Yes/No” or a fixed multiple-choice response.

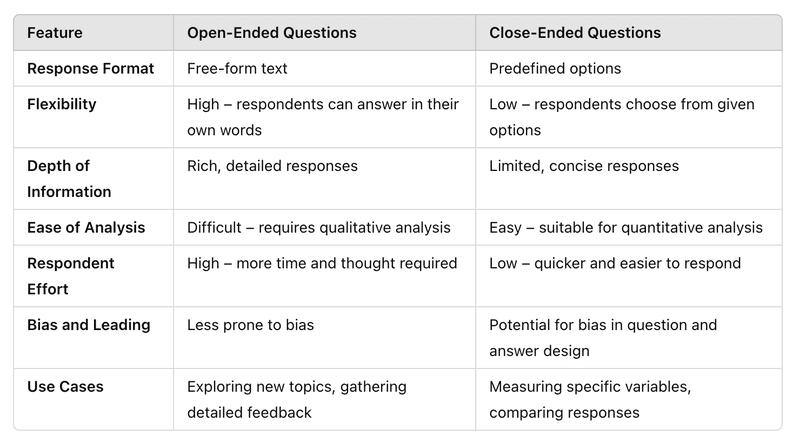
Open-ended survey questions vs. closed-ended questions
Close-ended questions are questions with fixed answer choices. This includes everything from simple “Yes/No” or “True/False” questions to rating scale questions like “On a scale of 1 to 5, rate your experience with the support agent.”
Close-ended questions, therefore, measure specific variables and are great sources of quantitative data. This makes them easy to analyze but also leaves room for bias due to the limited answer options.
Open-ended questions, however, are direct opposites. They do not limit respondents to a few answer choices, allowing them instead to provide detailed and valuable information in their own words.
An open-ended question, thus, encourages respondents to express themselves freely and is an excellent source of rich, qualitative data. While this makes them less prone to bias, it also makes them more difficult to organize and analyze.
Some surveys are designed to collect both quantitative and qualitative data. For example, a customer satisfaction (CSAT) survey may ask, “On a scale of 1 to 10, how satisfied are you with this product?” It could then follow up with an open-ended “How can we improve the product?”
Manual coding is slow and prone to bias. Userpilot helps you automate tagging, sentiment analysis, and response segmentation so you can focus on growth.
See exactly how to analyze open-ended survey questions in SaaS with our automated solution.
Why open-ended survey questions are harder to analyze
Open-ended survey questions generate free-text answers that are harder to organize and compare. Users often describe the same problem in different ways, which makes patterns harder to spot. Without a clear way to analyze this feedback, teams can miss important insights.
Unlike closed-ended questions, open-ended responses do not fit neatly into predefined categories or metrics. This means analysis often requires manual review, tagging, or interpretation, which can be time-consuming and subjective. As response volume grows, it becomes harder to maintain consistency, prioritize issues accurately, or connect qualitative feedback back to specific product decisions.
How to collect data with open-ended survey questions
Framing your open-ended survey questions correctly is key to consistently generating quality insights from them. To do that, you must avoid certain traps and pitfalls, such as:
- Combining multiple questions in one: Asking more than one question at a time can cause your survey respondents to feel burdened and lose interest. They may answer only one question or avoid it altogether. Bad example: What will you improve about your experience with feature1 and feature2?
- Asking vague questions: Vague or broad questions are often open to multiple interpretations or survey bias. So, always ensure your questions are clear and specific. If you want one-word answers, for example, start your question with “In one word, how would you…” Bad example: How is our product working for you?
- Asking leading questions: Leading questions nudge the respondent in a particular direction due to certain underlying assumptions. This means you must avoid any assumptions when framing your question. Bad example: How does [feature] make your ideal workflow more efficient?
- Asking open-ended questions in place of closed-ended questions: Always close any question with predictable responses. Requiring open responses for these questions will only provide you with data that are difficult to clean and analyze. Multiple respondents, for example, may say the same thing differently. Bad example: Where are you from?
- Asking too many (open-ended) questions: The best surveys are brief and easy to answer. This means you must avoid asking too many questions. You must also avoid asking too many open-ended questions as they are harder to answer and could easily cause survey fatigue.
How to analyze open-ended survey questions
You’ve carefully written and published your survey. Now, it’s time to analyze the results. There are two main approaches to analyzing open-ended questions: manual and automated.
Let’s explore both:
Analyzing feedback data manually
The typical manual feedback analysis involves a six-step process:
- Structure the data and explore it to get a sense of the responses you’ve received.
- As you explore, jot down any common themes you notice. Use these themes to create tags for your analysis. You can also include relevant general tags relating to your users’ goals, task types, etc.
- Next, it’s time to code the data. This involves linking each response with one or more of the tags you created in step 2.
- Calculate how many times each tag appears and tally it up. You can use simple data visualization techniques for this step if you please.
- Once that’s done, pick out the top 3-5 tags as those represent the most significant issues needing your attention.
- Finally, add more detail for each tag by writing down the insight they represent. You can also scan the data again to identify supporting quotes for each tag that explain what issues it represents and bring it to life.
Although this involves some time-consuming work, carefully following each step will leave you with a large amount of rich, qualitative data that you can begin acting on.
Analyzing feedback data with automation
You can always streamline the feedback analysis process by using automated online survey tools instead of manually analyzing the data. The analysis process here may look like this:
- Collect your data using online survey tools like Typeform, Google Forms, or Userpilot. These tools offer easy-to-use templates that you can quickly customize and publish. If you will connect to a different software for analysis, ensure the data you receive is in a clear, structured CSV or Excel file.
- Analyze your data using the tools provided by your preferred analysis software. Use text analytics to create and assign tags to your responses quickly. You can also use sentiment analysis to determine which responses are negative or positive.
- Visualize your data to easily identify the valuable insights hidden within. You can automatically create graphs, charts, and visual dashboards using data visualization tools to generate shareable reports with easy-to-spot actionable insights.
Finally, you can act on the insights gained from your survey responses, addressing the most common concerns first, and moving down the line accordingly.
How to analyze open-ended survey questions with Userpilot
Userpilot is a versatile code-free product growth tool. It boasts many features that help you to collect and analyze different kinds of customer feedback data.
Your feedback analysis process with Userpilot will look like this:
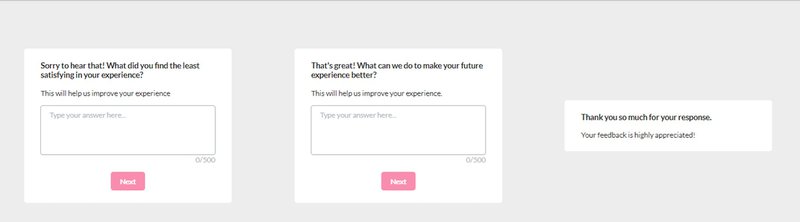
Collect qualitative data with micro surveys
Userpilot enables you to create different types of in-app micro surveys, including NPS, CSAT, and CES surveys, among others, or customize existing survey templates to match your needs.
The survey localization feature enables you to automatically translate survey questions in minutes. You can also combine multiple surveys and define the sequence of appearance for each question (as seen below).
Even more, Userpilot grants you full control over where and when your survey will appear. You can define frequency intervals, set event triggers, or define the specific audience segments to see the survey.
Visualize your open-ended survey data for easier analysis
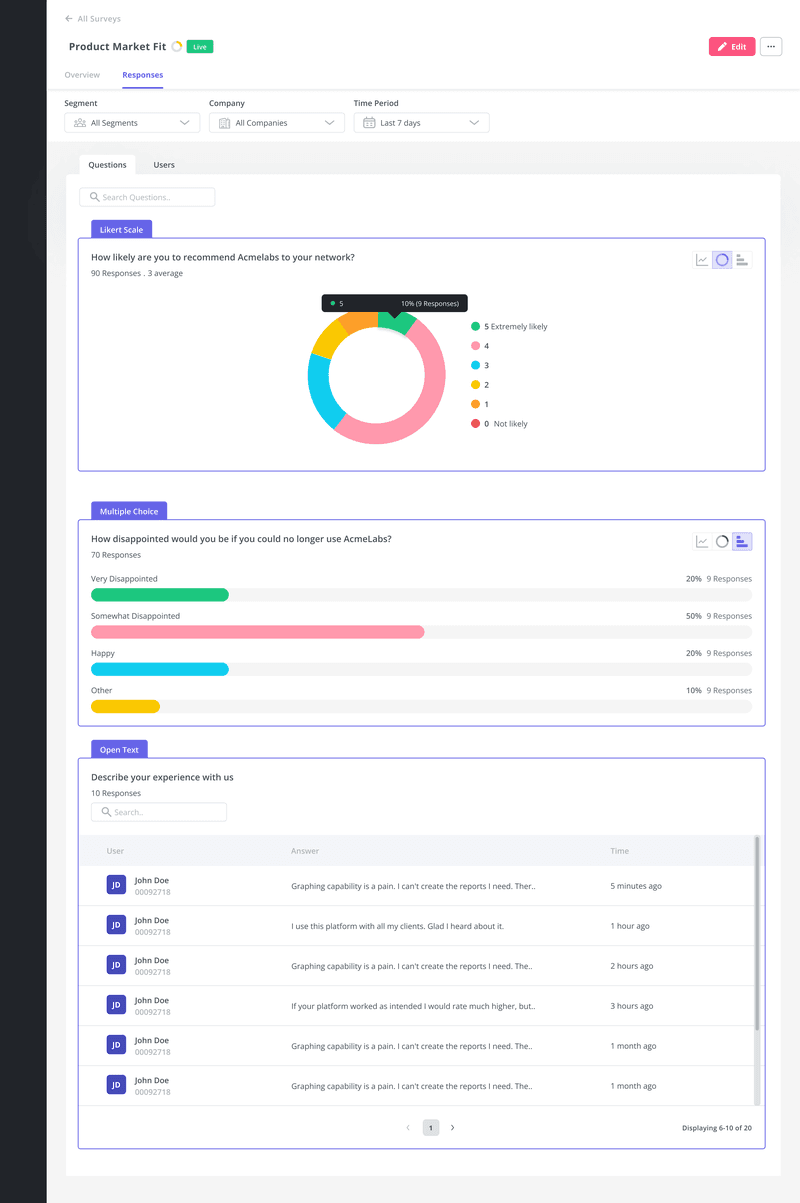
Userpilot also provides advanced survey analytics features to help you easily extract insights from your survey.
For example, it provides an easy-to-read NPS dashboard that shows you all the key data from your NPS surveys. This includes the number of views, NPS score, response rates, score trends, etc.
In fact, each survey you create has an analytics tab to help you visualize response trends. You can see the most popular choices for a closed question, track the distribution of responses, and review qualitative responses.
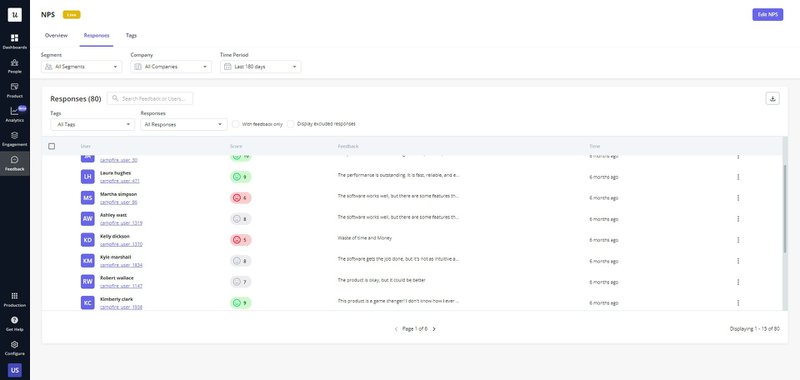
Use NPS tagging to categorize open-ended survey responses
Tag qualitative NPS responses to help you easily organize them into different themes and identify common pain points.
You can then sort responses by tags to make better sense of your users’ concerns.
This sort of feedback categorization also makes it easier for you to separate high-value features from underperforming ones, identify feature requests, etc.
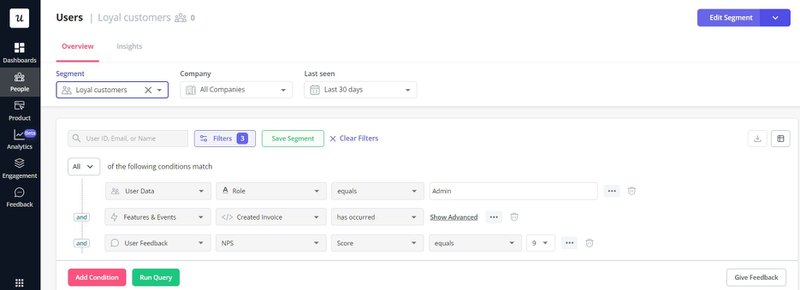
Segment open-ended responses to identify trends among user groups
To make better sense of large volumes of feedback data, Userpilot also enables you to filter survey responses by segments. This means that you can define different focus groups and track the responses from that group alone.
For example, you may want to see what complaints are most common to new users so that you can improve the first-time user experience.
To that end, you can define new users based on their account creation date or user engagement level and view the responses from that user segment alone.
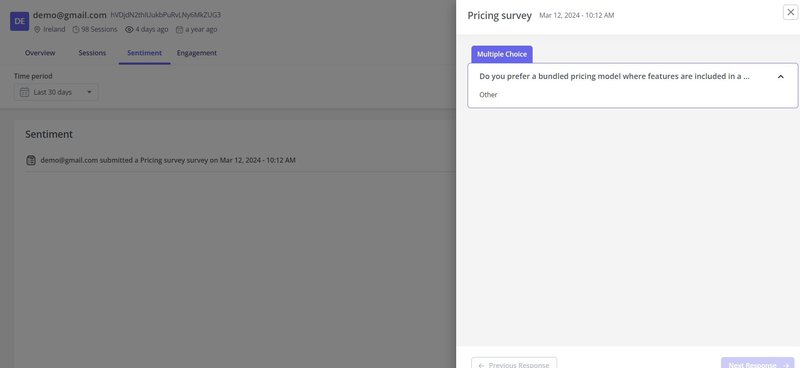
Zoom in on an individual user for a more granular analysis
Userpilot’s user sentiment dashboards enable you to get even more granular insights from specific users or companies and observe how their feelings towards your business have evolved.
Simply open the user or company profile, head over to the sentiment panel, and view their responses to your in-app surveys over any time frame. Where necessary, you can then set up follow-up interviews to discuss their experience further.
For example, suppose you notice that a previously positive high-profile power user has left a series of negative feedback. In that case, you can quickly reach out, address their problems, and prevent churn of a valuable customer.
Conclusion
Properly analyzing user feedback is the key to increasing customer retention and driving product growth. This article has explored everything qualitative researchers need to craft effective questions and analyze survey results accurately.
Ready to get started collecting qualitative feedback and analyzing it code-free? Book a Userpilot demo today and get started right away.
About the author