How to Calculate NPS (Net Promoter Score)


Developed in 2003 by Bain & Company, NPS has become the predominant customer success framework for two-thirds of the Fortune 1000. To take advantage of it yourself, you must first learn how to calculate NPS.
This guide will walk you through the process of calculating the NPS and explain how NPS feedback can help you improve your product and service. It also highlights best practices to follow and mistakes to avoid when conducting an NPS survey.
What is the Net Promoter Score (NPS)?
Net Promoter Score is a customer experience metric that helps businesses gauge customer loyalty to a product, service, or brand.
It is a simple yet powerful tool for tracking customer satisfaction, predicting future growth, and making data-driven business decisions to improve your product or service.
NPS Categories
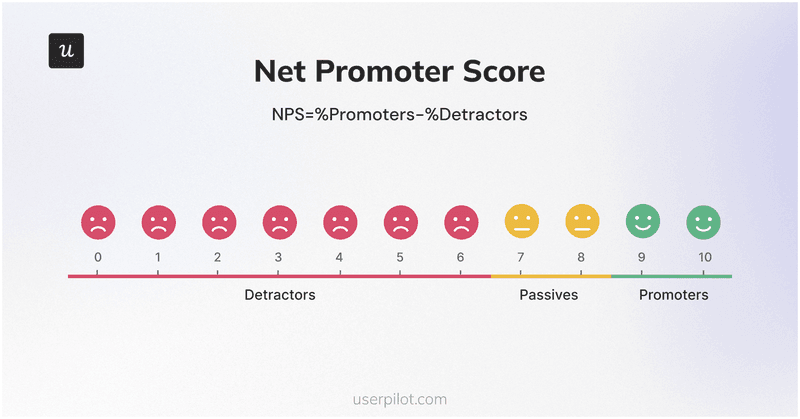
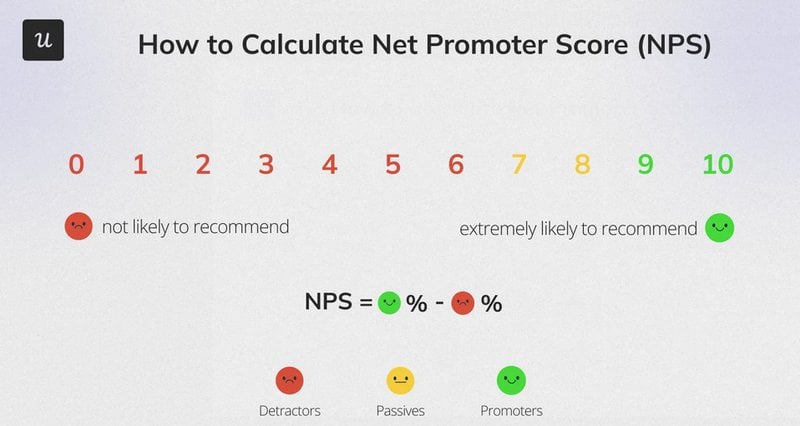
NPS questions are rating scale questions rated from 0 (not likely) to 10 (extremely likely). Customers are then placed into either of 3 categories depending on their response:
- Detractors: Customers who respond with a score between 0 and 6. These are unhappy customers who are unlikely to buy from you again. They are also likely to discourage others from buying from you.
- Passives: Customers who respond with a score of 7 or 8. They are satisfied with your product but not happy enough to freely promote it.
- Promoters: Customers who respond with a score of 9 or 10. These are loyal customers who are enthusiastic enough to get the word out and attract other customers.
How to calculate NPS (Net Promoter Score)
Calculating the net promoter score is a four-step process that looks like this:
- Launch an NPS survey with the question: How likely are you to recommend this product/service/company to a friend or colleague?
- Divide the responses into the categories above: Detractors, Passives, and Promoters.
- Calculate the percentages for each category.
- Finally, apply the NPS calculation formula: percentage of promoters – the percentage of detractors.
Calculating NPS with different NPS score calculation methods
Now, you don’t need to manually crunch the numbers before calculating your NPS. Here are a few (non-manual) ways to go about it:
Calculate your NPS in an Excel template
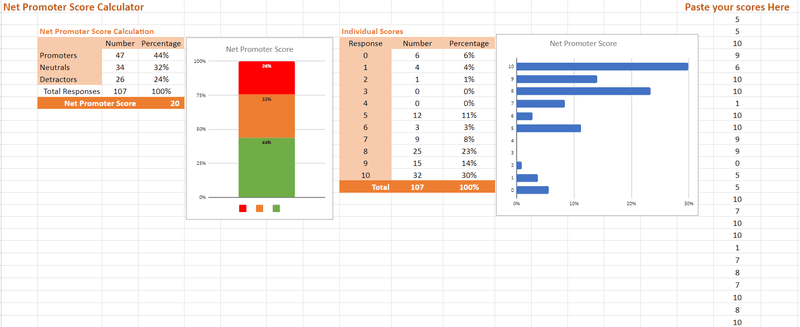
Excel is best used when your NPS data consists of raw data (rows of individual ratings (0-10)) for each customer in a .csv or .xls file. There are different Excel templates out there, but we love this template from Genroe.
Here’s how to calculate the Net Promoter Score using the template:
- Download and make a copy of the template.
- Copy and paste the data from your NPS survey results file into the cell marked “Paste your scores here.”
- After you paste your scores, the spreadsheet will automatically do the following:
- Display the count for promoters, passives, and detractors, and generate a graph using their percentages.
- Display a count for each score from 0 to 10 and generate a graph of their percentages.
- Calculate and display your NPS.
Use an NPS calculator
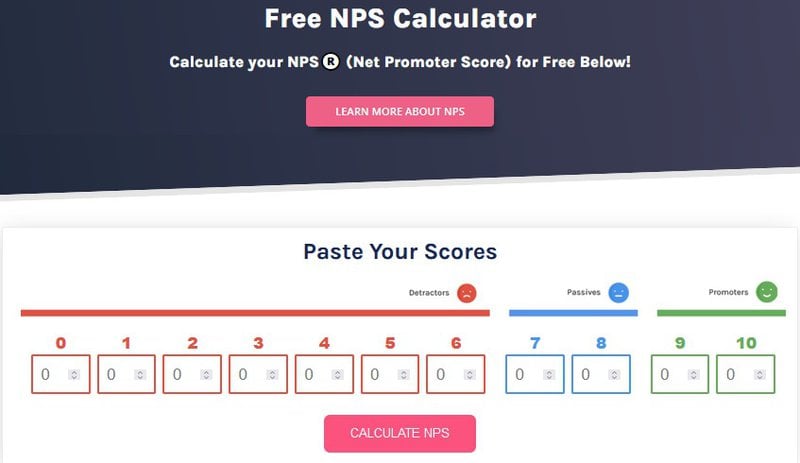
If you’ve already tabulated the number of responses for each score (0-10), an online NPS calculator can do the math for you instead.
To calculate your NPS with Userpilot’s NPS calculator, input the number of respondents for each score, then click “Calculate NPS”. The calculator will automatically:
- Calculate your NPS.
- Display the percentage of detractors, passives, and promoters in a donut chart.
- Display a bar graph showing the percentage share for each score.
Calculate NPS using a survey tool
As we noted earlier, any NPS calculation begins with an NPS survey. Thankfully, some survey tools have built-in functionality to help you calculate your NPS in one click.
Userpilot, for example, provides one such tool. It automates the process of launching your survey and calculating your score. Some of its features include:
- Auto-trigger NPS surveys: Userpilot’s advanced survey settings enable you to set up contextual survey triggers. You can send NPS surveys to specific user groups, after an interaction, or to a unique domain(s).
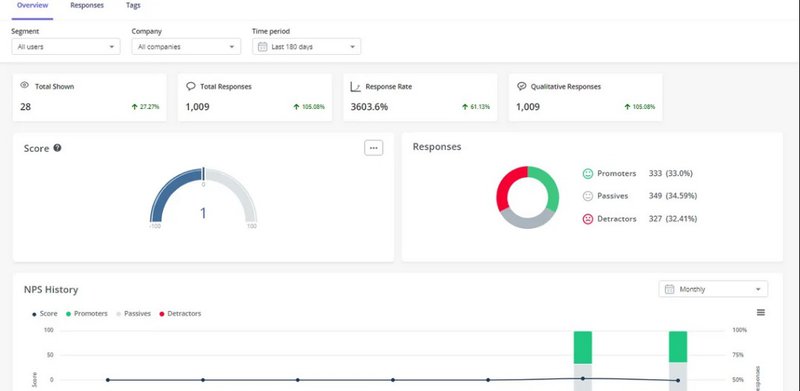
- NPS Dashboard: Userpilot’s dedicated NPS dashboard automatically calculates and visualizes NPS results. It also enables you to track changes to your NPS scores in real time and compare trends over time.
- Advanced Analytics: Userpilot also enables you to tag and categorize qualitative responses to NPS follow-up questions. This way, you can easily find common themes behind the scores users provide.
NPS calculation example
Let’s assume your company surveyed 100 customers with the following distribution:
- 10 customers gave a rating of 9 or 10 (promoters)
- 70 customers gave a rating of 7 or 8 (passives)
- 20 customers gave a rating of 0-6 (detractors)
Step 1: Calculate percentages
- Promoters percentage: (10/100)*100 = 10%
- Passives percentage: (70/100)*100 = 70%
- Detractors percentage: (20/100)*100 = 20%
Step 2: Apply the NPS formula
NPS = % Promoters – % Detractors
NPS = 10% – 20% = -10
Note that NPS can range between -100 and +100. A positive score (above 0) is generally considered good, while a score of +50 is considered excellent.
This example suggests that your company has more detractors than promoters, which means there is a need for improved customer experience.
Why should you calculate NPS?
NPS provides valuable insights into a company’s overall health and growth potential. Here are some of the benefits of calculating NPS:
- Simplicity: The NPS is one of the easiest customer experience metrics to implement. Due to its simplicity, setting it up is quite easy and customers can quickly respond, which makes them feel comfortable. It can also be rolled out on different platforms, including mobile, web, and SMS, leading to higher response rates.
- Actionable: An NPS survey lets you feel the pulse of customers. With the follow-up question, you get to see the reasons for your customers’ feedback. This allows you to take immediate action to reduce churn and enhance customer retention.
- Flexibility: Some companies launch NPS surveys once or twice every year. Other companies launch smaller, more regular “drip NPS” surveys to track customer sentiment on an ongoing basis. This flexibility lets you track changes over time and make continuous improvements to your product, service, and experience.
- Proactive problem-solving: NPS surveys provide a snapshot of customers’ sentiment, offering insights into why they feel that way. This way, you can detect negative trends early on, allowing you to address the issue before it spreads and damages your reputation.
NPS Calculation Best Practices
Now that we know how to calculate the Net Promoter Score and its many advantages let’s consider some best practices to help you get the best out of this metric.
Use NPS surveys to collect customer feedback
NPS is calculated by asking customers, “On a scale of 0-10, how likely are you to recommend to a friend?”.
This survey can be launched in different ways: an in-app survey, an email follow-up to an interaction, or even a social media poll. To get an accurate NPS, respondents must provide an answer between 0 and 10.

The responses provided will give you an idea of customers’ overall impression of your brand and how much work is needed to improve that impression.
Use a follow-up question in your NPS survey for NPS tagging
Use a follow-up question after customers give their ratings to understand why they gave the answer they did.
This can be as simple as asking: “Why did you choose this score?” Their responses to this question will provide rich qualitative feedback that can help you identify areas for improvement.

You can then tag the responses to categorize the feedback and detect trends. This will enable you to cross-reference the data to see how specific patterns influence the NPS score. This means you can gain deeper insights into what’s working and what’s causing friction.
Use a tool to automatically categorize NPS responses
Last but not least, take advantage of existing NPS software to easily analyze your responses. These tools can help you automatically segment users into promoters, passives, and detractors, and calculate each group’s percentages.
Userpilot’s NPS analytics tool, for example, automatically computes results from the NPS scale and visualizes them on a dashboard. You can filter the responses by time frames to identify or compare trends within a period.
You can also divide the responses by user segments or groups to understand differences in your product’s perception across different groups. This should help you identify and satisfy groups with large clusters of detractors.
NPS calculation mistakes to avoid
Although calculating NPS is relatively straightforward, there are a few common mistakes that can produce inaccurate results.
Here are some key pitfalls to look out for:
- Deriving an average per customer: Using an average score can give you NPS scores like 6.5 and 8.5, making it tricky to decide whether your score is positive or negative. Taking an average also minimizes the impact of those who don’t respond (who are likely detractors), and this can skew your results positively.
- Failing to segment your data: Segmenting your data by different customer groups based on factors like product usage, demographics, feedback, and behavior can help you identify trends that are not obvious in the overall NPS score. For example, you may find that your NPS score is high among young, tech-savvy customers but low among older customers. This can help you improve the customer experience for this demographic.
- Recording only one response per customer: B2B products often have multiple end-users and decision-makers. As a result, your relationship with a company isn’t dependent on one user’s feeling alone. To avoid skewing your results towards larger-sized companies, however, you can limit the number of responses from each company to a maximum number of end users and decision-makers.
- Ignoring non-respondents and passives: It can be tempting to focus on detractors to close the loop and promoters to measure customer loyalty and advocacy. However, it is important to consider non-respondents and passives as well, as this will provide a clear picture of your overall business health.
Conclusion
Knowing how to calculate NPS and tracking your results over time can help you gain valuable insights into your customers’ sentiments, monitor trends, and identify areas for improvement.
Userpilot’s advanced NPS analytics features can help you make better NPS-driven decisions. Book a demo today to learn more.
FAQ
What is the formula for NPS?
NPS = % promoters – % detractors
How do you calculate NPS manually?
There are two ways to go about it:
- Calculate the percentage of promoters and detractors and subtract the detractors from the promoters.
- Subtract detractors from promoters, divide the figure by total responses, and multiply the result by 100.
How to calculate NPS in Excel?
Download the Excel template and export your NPS feedback in a .csv or .xls format to the Excel software. Use the NPS formula to subtract detractors from promoters and display your result.
How is NPS measured?
NPS is measured through survey responses. Using follow-up questions and categorizing your feedback can help you make the most of your NPS surveys.
About the author