Around 25% of users abandon an app after one use, often before they experience any real value.
That drop happens inside the mobile app funnel. Between install, app onboarding, and the first meaningful action, friction builds quietly. New users stall, skip steps, or leave altogether. Marketing dollars keep flowing, but user retention never catches up.
Mobile app funnel optimization focuses on fixing that gap. It shifts attention from downloads to activation, user behavior, and the user journey through different funnel stages inside the mobile app experience. With the right data and in-app interventions, you can reduce drop-offs and improve conversion rates before users churn.
In this guide, I’ll show how to analyze mobile funnels, identify friction points, and improve activation using product analytics and in-app experiences.
What is a mobile app funnel?
A mobile app funnel is the path a user takes from first becoming aware of your app to becoming a loyal, paying customer. It is rarely a straight line, but visualizing it linearly helps identify where friction appears.
Think of it as different stages. At the top, you have everyone who visits your app store page. At the bottom, you have users who renew their subscription months later. Every step in between either moves users forward or causes them to drop.
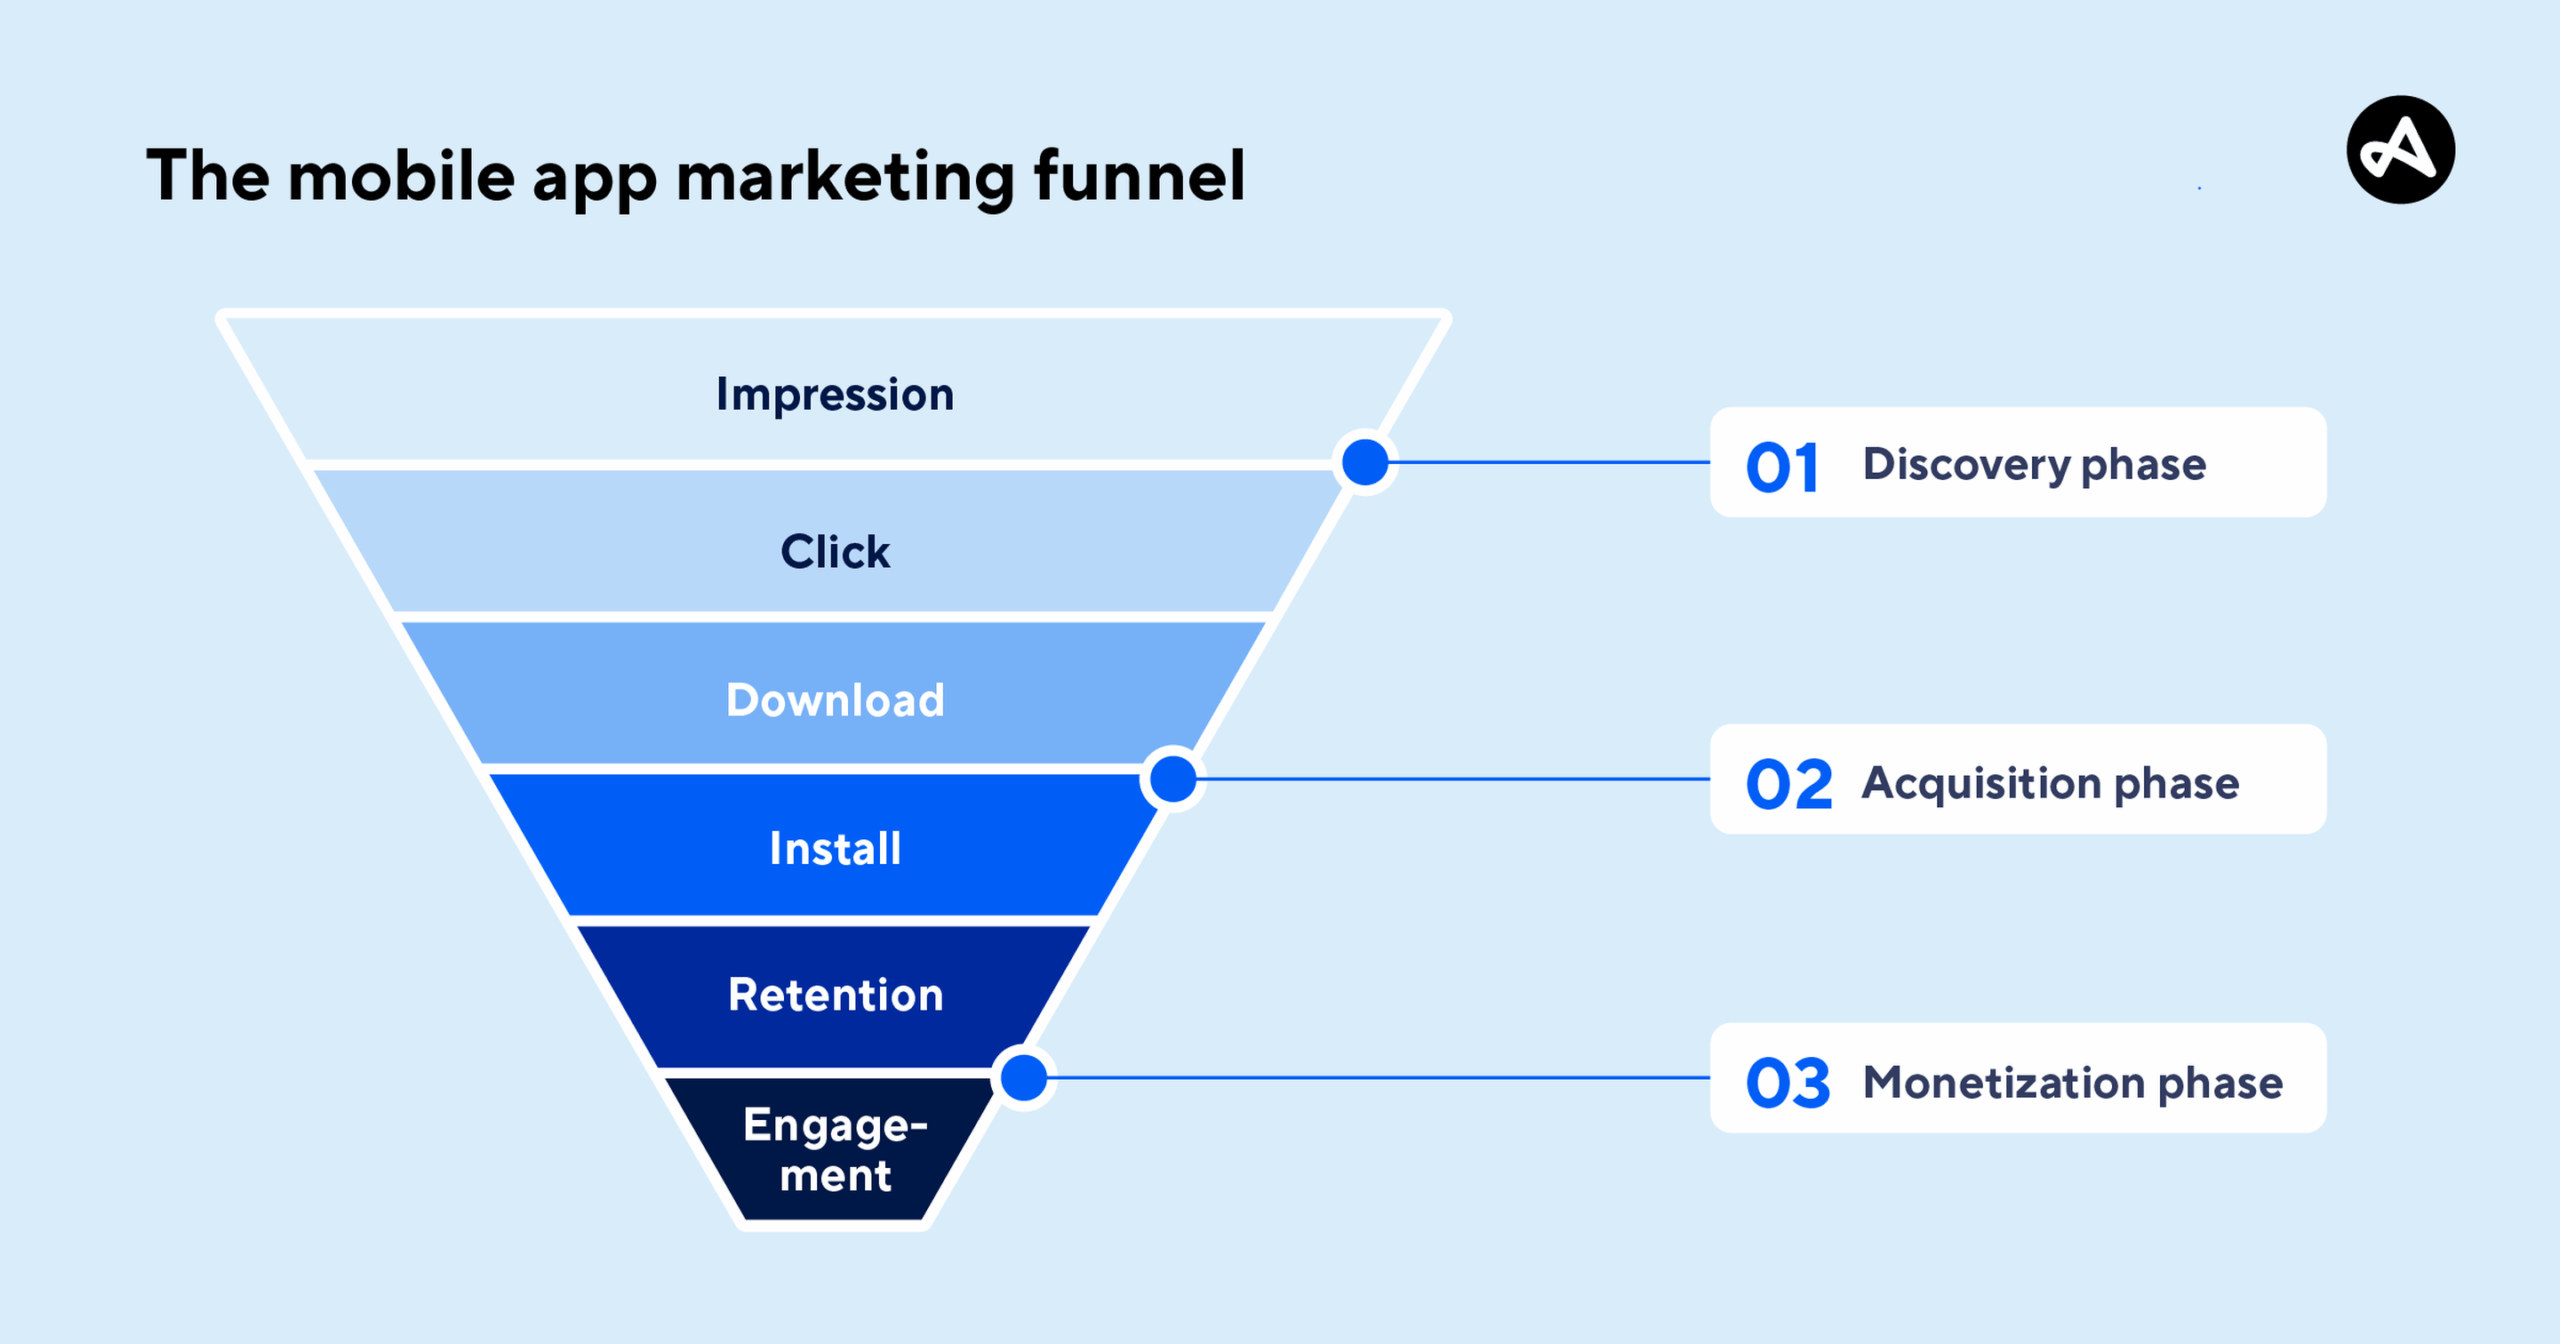
In practice, mobile app funnel optimization focuses on understanding how app users move through each funnel stage, how many users complete key actions, and where users drop before they experience value. Most product teams break the mobile app funnel into five stages: acquisition, activation, retention, revenue, and referral. The mistake is trying to optimize all of them at once.
Diagnose your funnel with the AARRR framework
Do not try to fix everything at once. Use the AARRR framework to locate the biggest bottleneck in your mobile app funnel and identify friction points to focus on first.
Start with data that reveals user behavior. If there is a large drop-off between install and sign-up, that is an activation issue. If users sign up but never return after day one, the problem lies with retention. Analyzing patterns among churned users reveals which steps predict abandonment.
Map the user journey across different funnel stages:
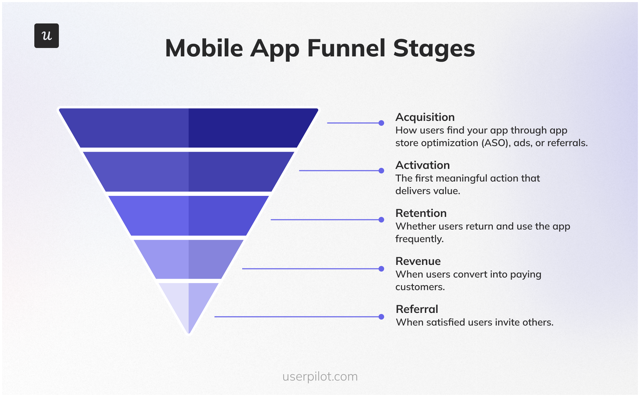
- Acquisition: How users find your app through app store optimization (ASO), ads, or referrals.
- Activation: The first meaningful action that delivers value.
- Retention: Whether users return and use the app frequently.
- Revenue: When users convert into paying customers.
- Referral: When satisfied users invite others.
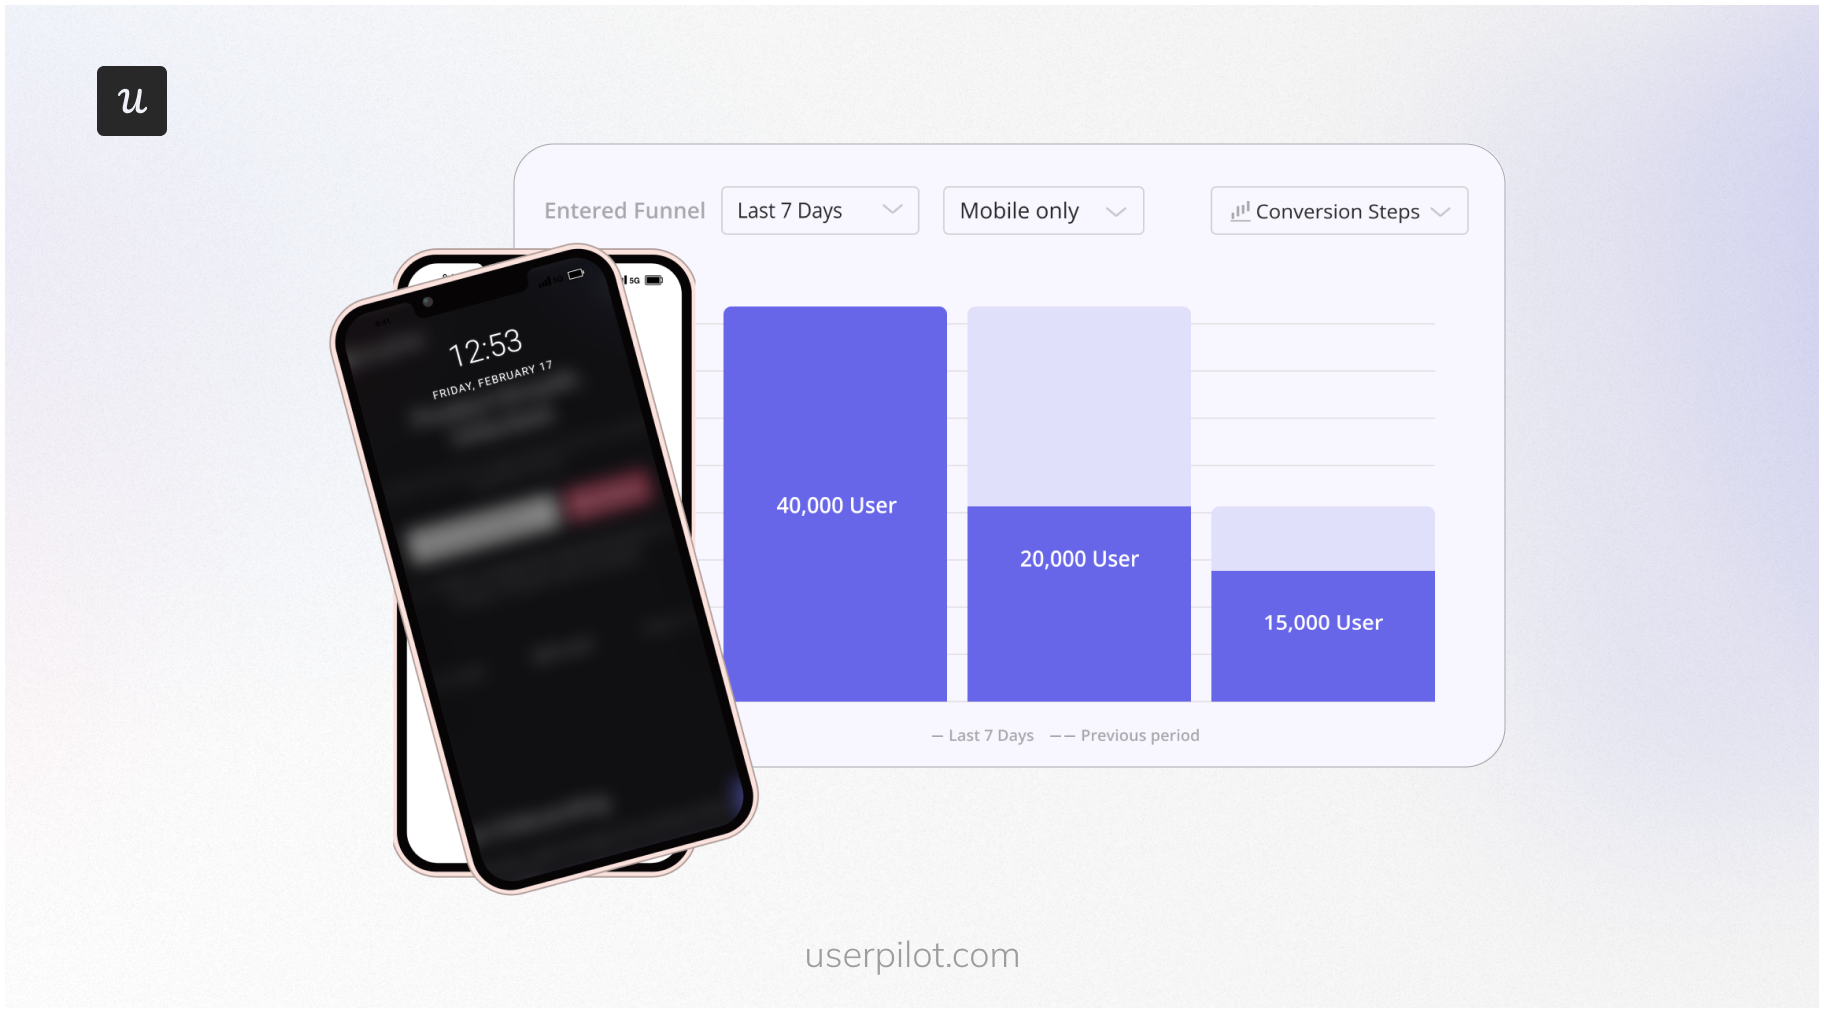
Next, analyze conversion rates between each step. If 1,000 new users install the app, 400 sign up, but only 20 complete a core task, the issue is onboarding, not targeting.
This is where mobile app funnel analysis matters. Look at the between-step conversion closely. If one step drops 90%, pause acquisition spending and fix that stage before investing more.
How to define activation metrics for your mobile app?
You cannot improve what you cannot measure. Many teams define activation as “Account Created.” That is a vanity metric. An account is an administrative step, not proof of value.
A strong activation metric reflects user behavior that shows the app solved a real problem. For a ride-sharing app, that is when new users complete their first ride.
For a banking app, it might be completing the first transfer. For a project management app, it is creating the first task and moving work forward.
Review your key metrics to confirm they represent value, not surface-level activity. If you track the wrong goal, you will optimize the mobile app funnel for behavior that does not improve user retention or conversion.
Which metrics must you track to optimize mobile funnels
Beyond activation, you need an analytics tool and dashboard that reflects the real health of your mobile app funnel. I track these metrics to understand where users drop off, how quickly they reach value, and whether the product retains users over time.
Focus on the following key metrics:
- App Store Conversion Rate: The percentage of users who install after seeing your listing.
- Drop-off rate: The percentage of users who abandon the funnel at a specific step.
- Time to Value (TTV): How quickly app users reach their first meaningful outcome.
- Churn rate: The percentage of users who stop using the app during a given period.
- Customer lifetime value (CLV): The total value a user generates over time.
These metrics can be tracked in specialized mobile analytics platforms like Userpilot or combined with tools like Google Analytics for a fuller view of user behavior.
Tracking these mobile app metrics consistently gives you valuable insights into user behavior and conversion rates across different funnel stages. Without them, mobile app funnel analysis becomes guesswork.
How to optimize mobile app funnels
Once you know where users drop, the next step is action. Fixing leaks in a mobile app funnel is not about redesigning everything at once. It is about preventing user churn by addressing the highest-impact friction points in the right order.
Start with data accuracy, then move toward app onboarding, customer experience improvements, and monetization. Each step builds on the previous stage, so you are fixing the funnel systematically instead of chasing symptoms.
Step 1: Audit data before you make decisions
Before you design a new feature or change a single pixel of UI, you must trust your data. I have seen teams spend weeks fixing a “drop-off” that later turned out to be a broken analytics event.
Create a robust data tracking plan. Verify that events fire when they should. Ensure user properties populate correctly. If your map is wrong, it does not matter how fast you move; you will still get lost.
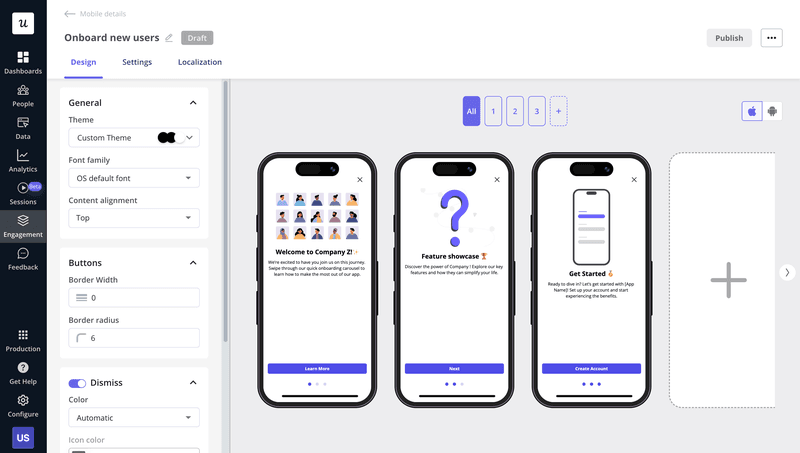
Step 2: Bridge the gap from download to value
The gap between a download and a habit is where users drop. Your onboarding flow is the bridge. It needs to be sturdy, short, and motivating.
Use contextual carousels to prime permissions
Mobile apps often need permissions for the camera, location, or notifications. Asking for these immediately on app launch is a fast way to get denied. Users get defensive when an app they just installed asks to track their location without context.
I use mobile carousels in Userpilot to explain why a permission is needed right before requesting it. Context changes everything. “Allow location access to find drivers near you” performs far better than a system prompt that appears without explanation.
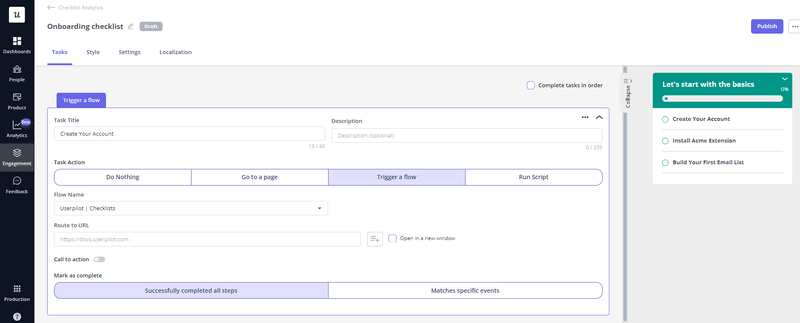
Deploy checklists to leverage the Zeigarnik effect
The Zeigarnik Effect suggests people remember unfinished tasks better than completed ones. We are wired to finish what we start.
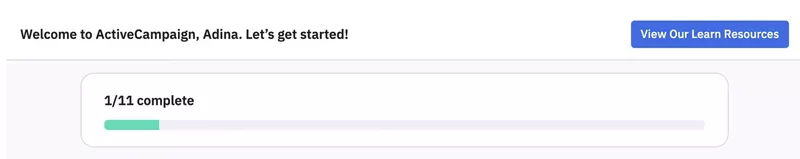
Add a customer onboarding checklist to the home screen. Show progress clearly, such as 20% complete. Break the path to value into small, concrete steps. Each completed item reinforces momentum.
Eliminate empty states to prevent dead ends
When a user lands on a dashboard with no data, the app feels broken. Empty states create confusion and stall progress. Avoid blank screens.
Replace them with educational content, demo data, or a clear call to action that helps users create their first data point. If the screen is “My Projects” and none exist, the primary focus should be a clear “Create First Project” action, not decorative placeholders.
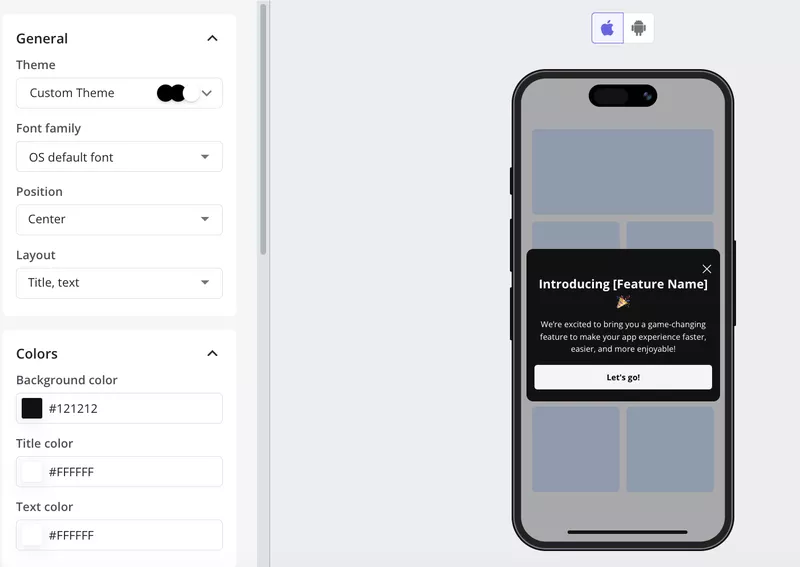
Step 3: Drive secondary feature adoption with slideouts
Once a user is onboarded, the goal is to move them deeper into the product. Pop-up modals on mobile often work against that goal. They cover the full screen and interrupt the workflow.
I’ve found mobile slideouts work better. They take up less screen space and feel less intrusive. Use them to introduce secondary features or prompt users to try workflows that correlate with higher retention.
Step 4: Re-engage users with deep-linked push notifications
Re-engagement channels vary by platform. While email marketing works for web apps, mobile relies heavily on push notifications. Used poorly, users disable them.
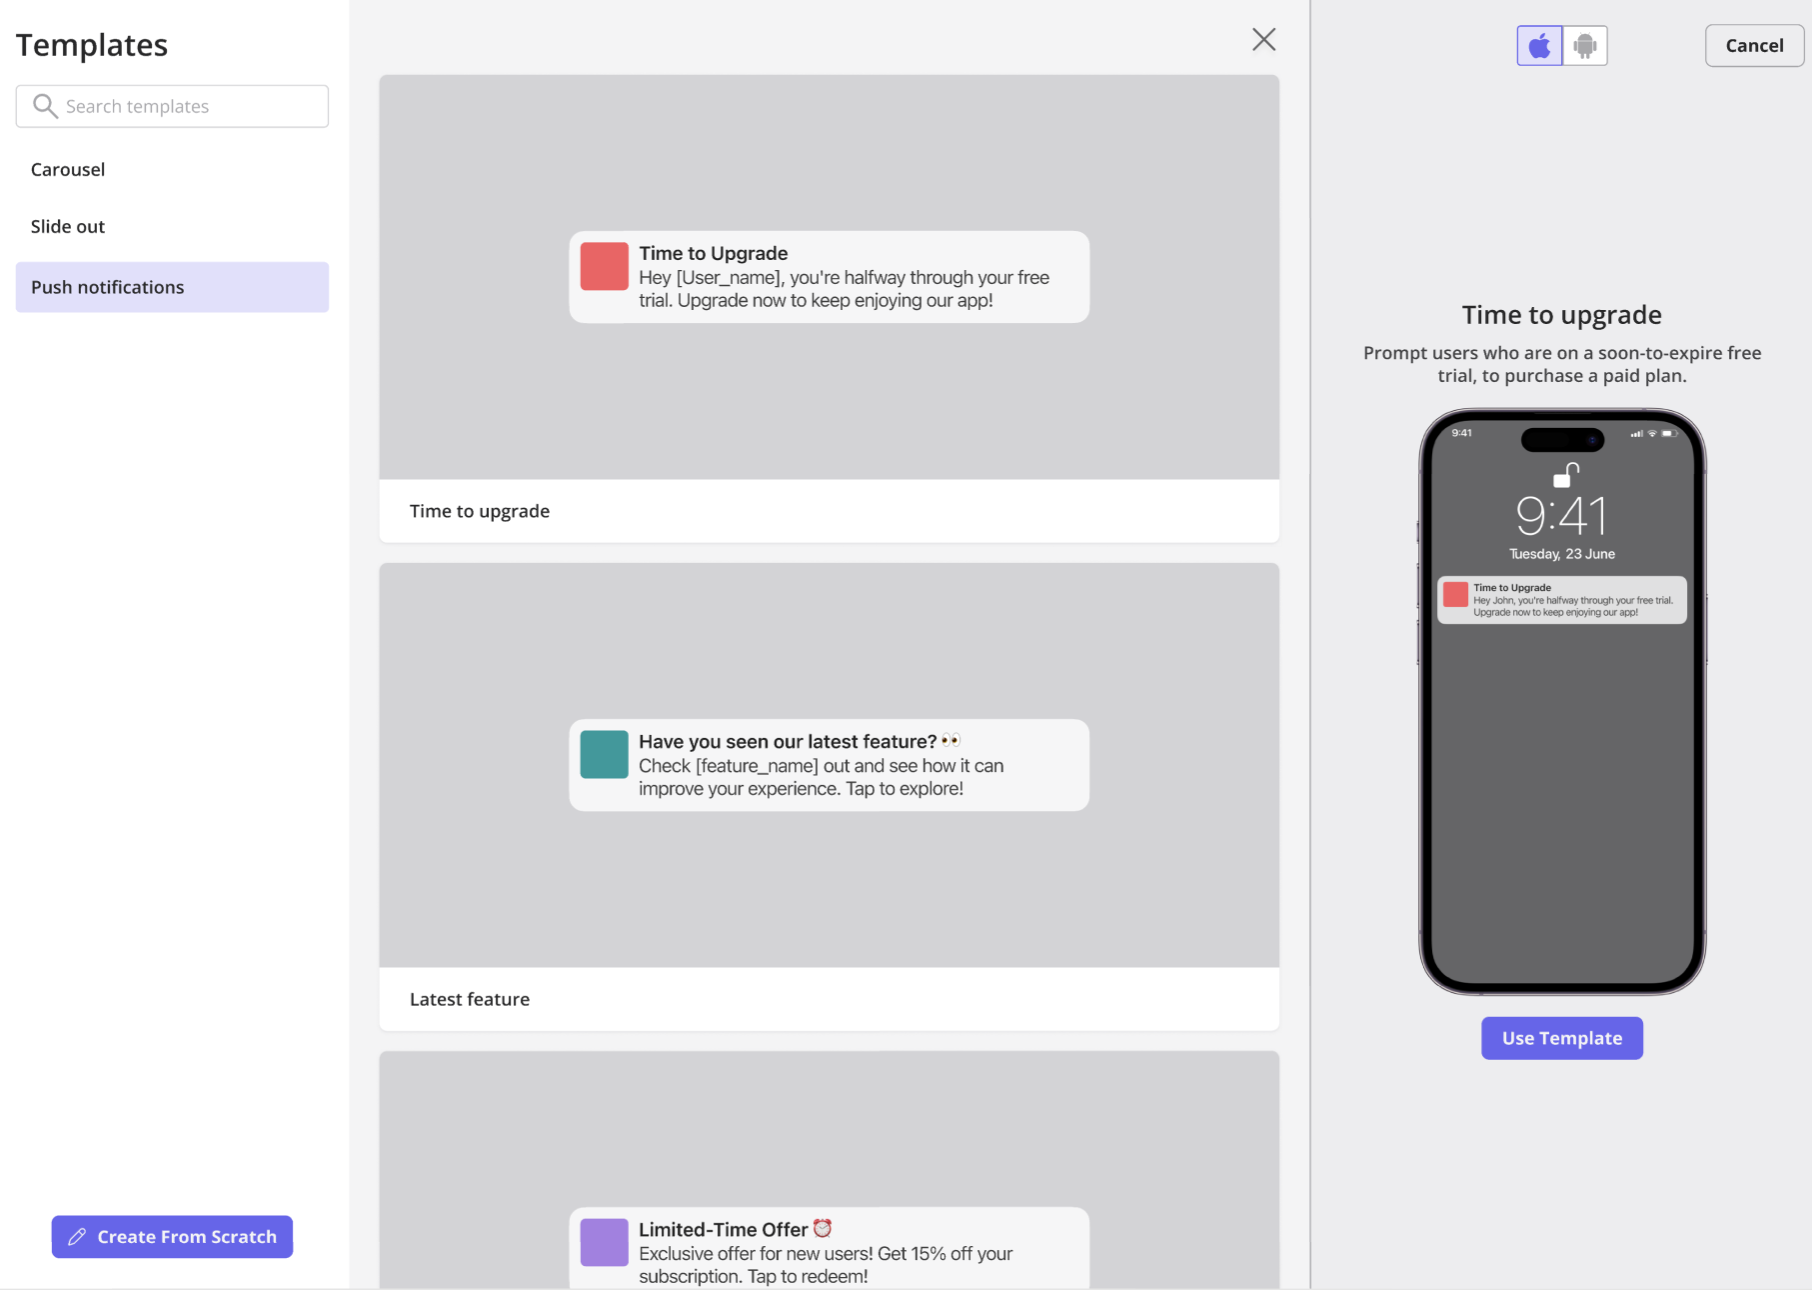
The key is relevance and deep linking. Avoid generic messages like “Come back to the app.” Trigger notifications based on user activity, such as “Your weekly report is ready.”
That notification must deep-link to the exact screen where the content lives. If users land on the home screen and have to search for it, the opportunity is lost. Poor targeting here leads to disabled notifications and churn.
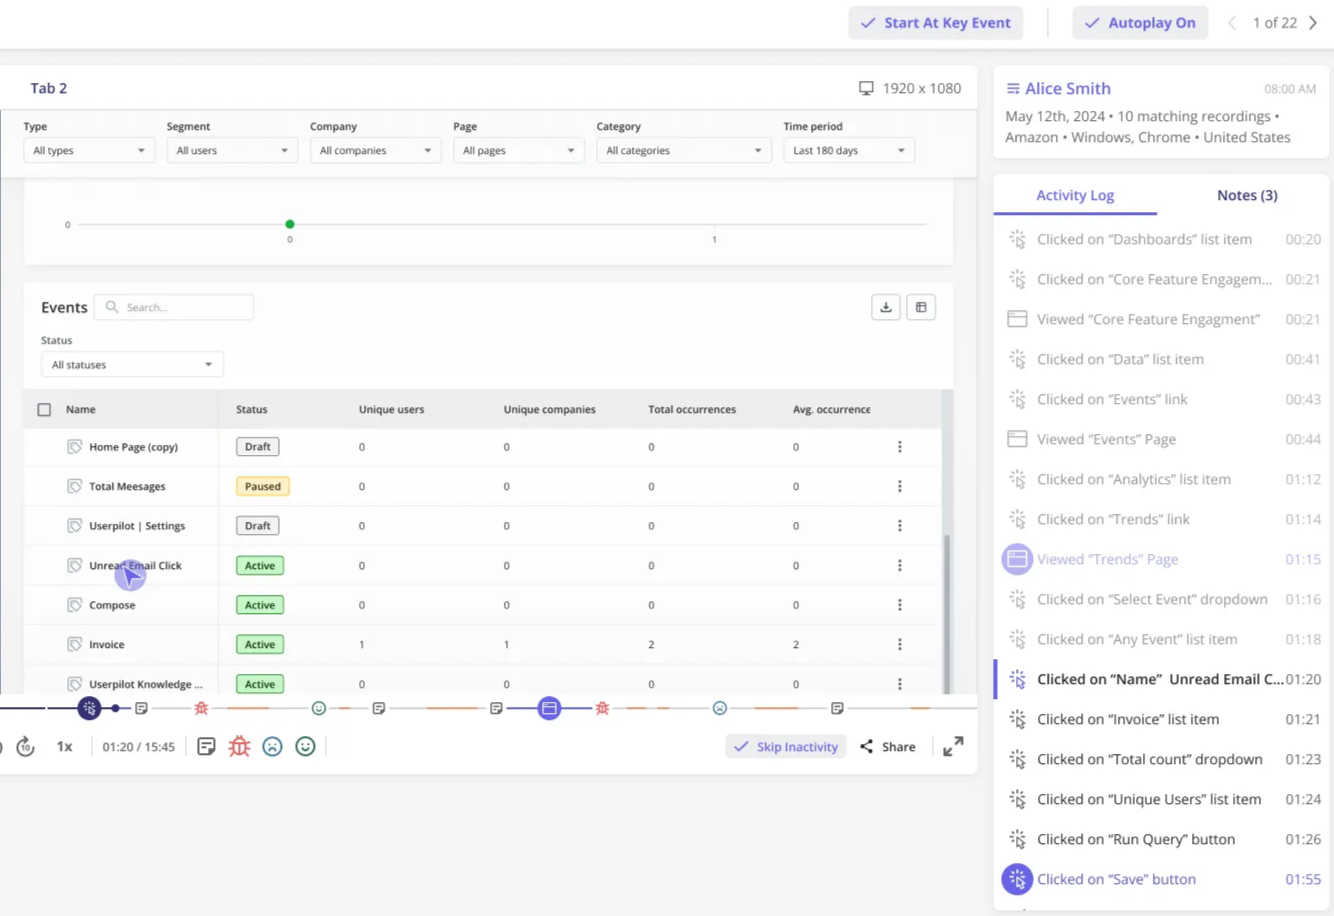
Step 5: Identify UI friction via session replays
Quantitative data shows what is happening. It rarely explains why. A checkout step might show a 40% drop-off, but the cause could be hidden below the fold or tied to unclear validation.
Session replays reveal these issues quickly. Watching real users interact with the interface exposes hesitation, misclicks, and frustration. As a product manager, this makes friction visible and actionable without guesswork.
Step 6: Gate features contextually to monetize
Freemium apps need a clear upgrade path through subscriptions or in-app purchases, but aggressive paywalls often backfire. Blocking users immediately after signup can stop them before they experience value.
Contextual gating works better. Let users interact with a premium feature first. Show its value. Then introduce the paywall at the moment the intent is highest. This approach aligns monetization with user motivation instead of interrupting it.
How product adoption platforms accelerate funnel optimization
You can build onboarding flows, tooltips, and analytics dashboards from scratch. That work takes engineering time. In practice, it often competes with core product development.
A product adoption platform like Userpilot reduces that overhead. It lets teams iterate on onboarding flows, in-app messages, and experiments without waiting for a new app store release. Small changes can ship faster, which matters when you are fixing leaks and turning potential customers into engaged users across a mobile app funnel.
Funnel optimization is a continuous product discipline
Mobile app funnel optimization is not a one-time fix. It is a loop. You measure where users drop, remove friction, encourage users to progress with in-app experiences, and repeat as the product evolves.
Teams that move fastest here win. Not by guessing, but by acting on data. I prioritize small, frequent experiments over waiting on long release cycles. The result is better customer experience, more users reaching activation, and a loyal user base that drives growth.
If you want to see this in practice, book a demo with Userpilot to explore how mobile analytics and in-app experiences can help you improve activation and reduce drop-offs.
FAQ
What is the mobile app sales funnel?
The mobile app sales funnel is the visual representation of the customer journey, tracking users from the moment they land on your app store page to the moment they make a purchase or subscription.
How do I identify where my funnel is leaking?
Start by visualizing drop-offs between each funnel step using funnel analysis tools like Userpilot or Google Analytics. Look for sharp conversion drops between consecutive actions, not overall conversion alone.
Common patterns to watch for:
- High install-to-activation drop-off usually points to onboarding friction or a mismatch between ad messaging and in-app value.
- High trial-to-paid drop-off often signals paywall friction or that users did not experience enough value during the trial.
The goal is to fix the single biggest drop first before optimizing anything else.
How much data is needed for reliable testing?
For statistically reliable A/B testing, you typically need around 1,000 conversions per variation. That gives enough signal to detect meaningful changes in activation or conversion rates.
If your traffic is lower, rely more on qualitative inputs. Session replays, usability testing, and targeted user interviews help surface major UX issues faster than waiting months for statistical significance.
What causes onboarding drop-offs?
Common causes include too many permissions requests, lengthy sign-up forms, forced account creation before value is shown, and confusing UI that leaves users unsure of what to do next.
What tools help optimize mobile onboarding?
Tools like Userpilot allow you to build and A/B test onboarding flows, track user analytics, and deploy in-app messaging without needing engineering resources for every change.
What are benchmarks for mobile funnel performance?
Benchmarks vary by app category and region, so they should be used as directional signals, not targets. On average, app store conversion rates sit around 25–27%, while only 2–4% of users reach activation or start a trial after install. Retention drops sharply, with roughly 25% of users returning on Day 1 and under 7% by Day 30. Trial-to-paid conversion typically lands around 35–40%, depending on the category.
About the author