The Complete Mobile Analytics Guide for 2026: Tools and Blind Spots



Mobile analytics enables product managers to track smartphone app usage patterns. However, it’s running into a problem in 2026 that its toolset was never designed for. Platforms assume that every “user” is a human tapping a phone screen. But that’s not the case.
On the web, the assumption that all traffic is human is already breaking. HUMAN Security’s 2026 State of AI Traffic report found that AI agent traffic grew 7,851% year-over-year, with automated traffic now growing eight times faster than human traffic. That wave has just started touching mobile-backed products, but the product teams waiting for it to fully arrive before updating their approach will likely spend months measuring a population they don’t fully understand.
The good news?
Your mobile analytics stack is still the right foundation. Daily active users, retention rates, crash rates, and funnel metrics still tell you everything you need to know about your human users. The question in 2026 is whether you’re prepared for the potential AI agent traffic wave.
This guide covers what mobile analytics is and the four types you need to know, the key challenges, including the agentic one most guides skip entirely, the seven metrics that matter most with current benchmarks, the best mobile analytics tools for 2026, and how AI is making the whole analysis process faster for product teams.

What mobile analytics is and why it still matters in 2026
Mobile app analytics is the process of collecting data from app users to understand their behavior, track app performance, and measure business outcomes like retention and profitability. It provides insights in two forms: qualitative data (such as session replays) and quantitative data (such as daily active users), and you typically need both to understand what’s actually happening.
If your daily active users are dropping, for example, a raw number tells you something is wrong. A session replay tells you where users are getting stuck or giving up. Used together, mobile analytics data moves you from knowing there’s a problem to finding exactly where to fix it.
At a practical level, mobile app analytics helps teams attract better customers by identifying which acquisition channels bring your most engaged users, improve UX by spotting friction in key flows before users abandon them, and increase revenue by understanding what drives conversion and where it breaks.
There are four main types of mobile analytics, and which ones you focus on depends on where you are in the product lifecycle and what questions you’re trying to answer.
-
Mobile Advertising Analytics: Tracks attribution, click-through rates, and customer lifetime value (CLV) to verify ROI on ad spend and identify campaigns that bring high-retention users.
-
App Monetization Analytics: Analyzes user behavior around in-app ads, purchases, and subscriptions to optimize pricing models and eliminate friction in the checkout flow.
-
Performance Analytics: Monitors app stability, load times, and network latency while aiming for the industry standard of over 99% crash-free sessions to prevent abandonment.
-
In-App Engagement Analytics: Maps screen time, navigation paths, and feature usage to understand user behavior, directly guiding product decisions to lift long-term retention.
The challenges of mobile analytics in 2026
Mobile app analytics isn’t straightforward, and several challenges consistently trip up teams that try to run it without the right platform.
1. Cross-platform tracking
If you have both a mobile app and a web app, users will likely switch between them. Tracking those users separately across platforms creates three problems:
- Fragmented data that makes it hard to understand the complete user journey.
- Inconsistent reporting that leads to flawed decisions.
- Increased tooling complexity and cost.
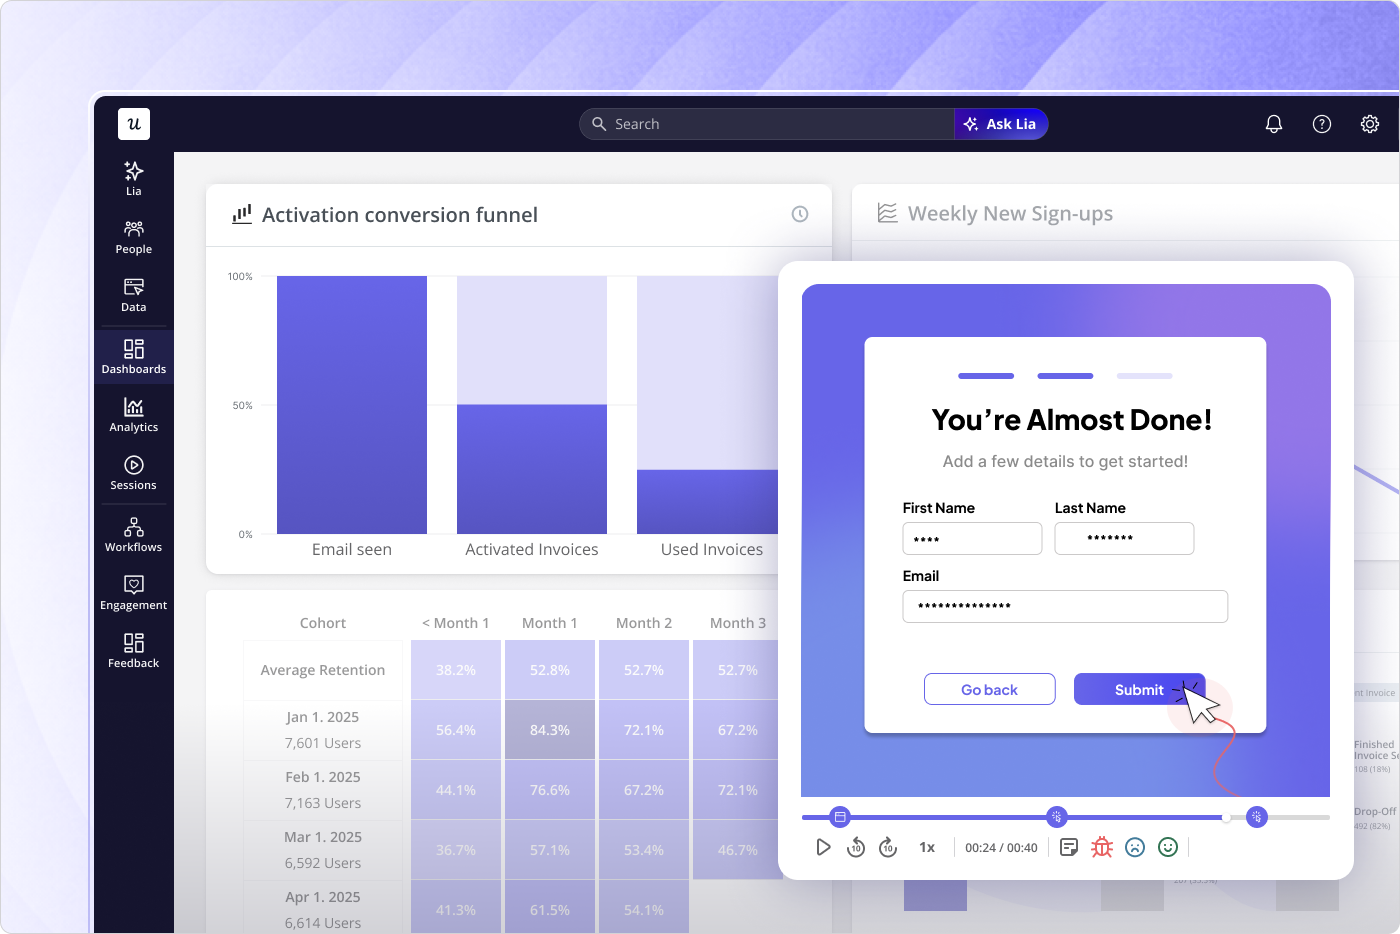
The fix is a unified platform that handles cross-platform tracking in one place. Userpilot’s product analytics gives you a centralized dashboard for viewing user behavior analytics across web and mobile apps, so your marketers and PMs are looking at the same numbers without needing manual data reconciliation.
2. User privacy and compliance
Violating regulations like GDPR, CCPA, and Apple’s App Tracking Transparency framework can mean reduced app revenue, app store removal, and lasting damage to user trust. A typical mobile app integrates multiple third-party SDKs for analytics, advertising, crash reporting, and feature functionality. Under GDPR, the app publisher is the primary data controller responsible for all processing, including what happens inside third-party libraries.
Choosing a mobile analytics platform that handles compliance transparently is the most straightforward path here.
3. Technical limitations and integration issues
Many companies struggle to integrate third-party analytics tools with their app backend, leading to incomplete or siloed mobile data. SDK management alone becomes a maintenance burden as the number of integrations grows, and each new SDK adds potential failure points. You should choose a platform that can integrate easily without a lot of coding.
4. AI agent traffic: The new measurement blind spot
This is the challenge most mobile analytics guides don’t cover yet, but it’s the one that will matter most over the next two to three years. As mentioned above, the State of AI report found that AI agent traffic on the web grew 7,851% year-over-year in 2025. Automated traffic is now growing eight times faster than human traffic.
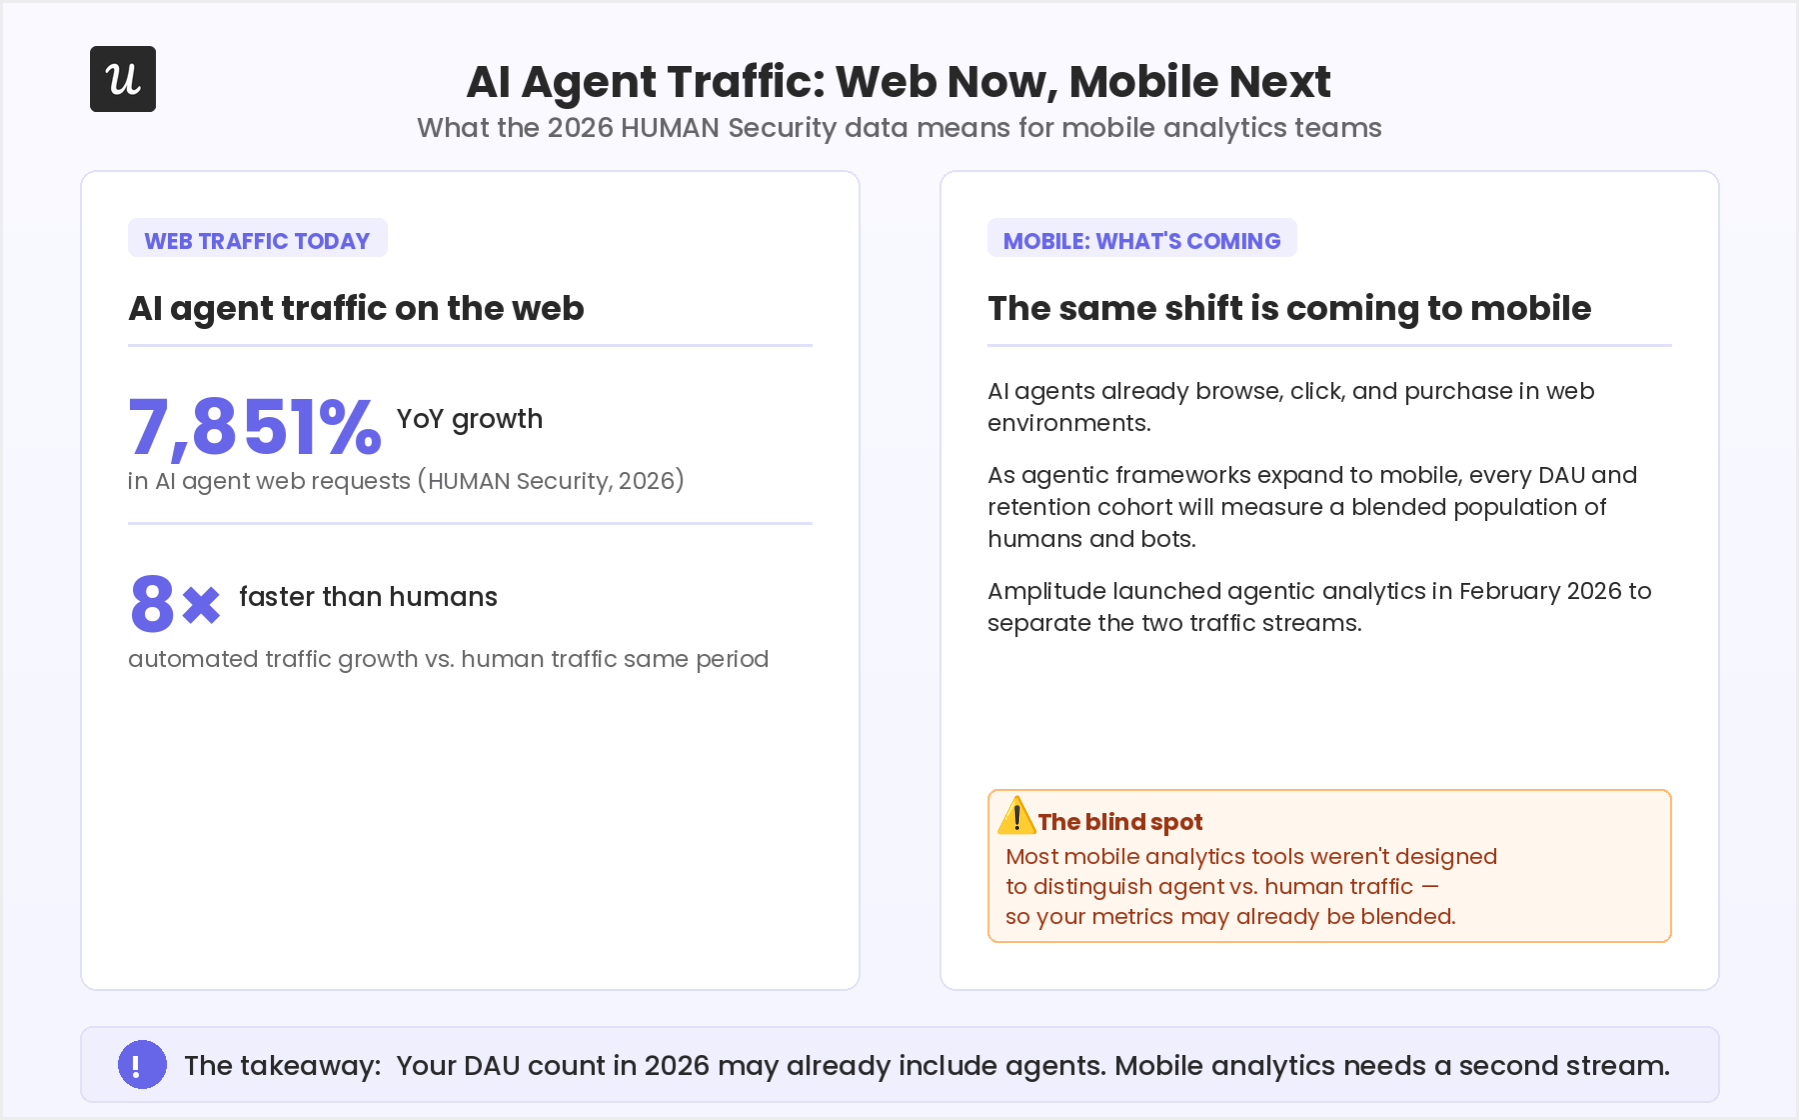
The problem for mobile product teams is that standard mobile analytics tools are built entirely around human behavior of screen taps, session opens, scroll depth, and event triggers. An AI agent doesn’t open a session. It calls an API or an MCP server directly, executes a task, and moves on. None of that activity shows up in your tools.
The practical implication for how you think about mobile analytics data is direct. If a meaningful share of your product’s traffic eventually comes from AI agents, your daily active users count, monthly active user figures, and conversion rates will measure a mixed population. A spike in DAU might reflect real human engagement growth, or it might reflect an increase in automated interactions. You won’t be able to tell without a system that separates the two streams.
As our CEO Yazan Sehwail puts it:
We see Userpilot as becoming the infrastructure that powers your product usage data for that sort of system. As teams start deploying their own AI agents, those agents are gonna tap on our existing infrastructure that will be powering all of the usage and all the product data, and that’s extremely powerful.
Standard mobile analytics tools are still the right foundation for measuring human user behavior. The preparation step in 2026 is understanding that foundation well enough to extend it when the agent traffic arrives at scale on mobile.
7 Important metrics to track for mobile app performance
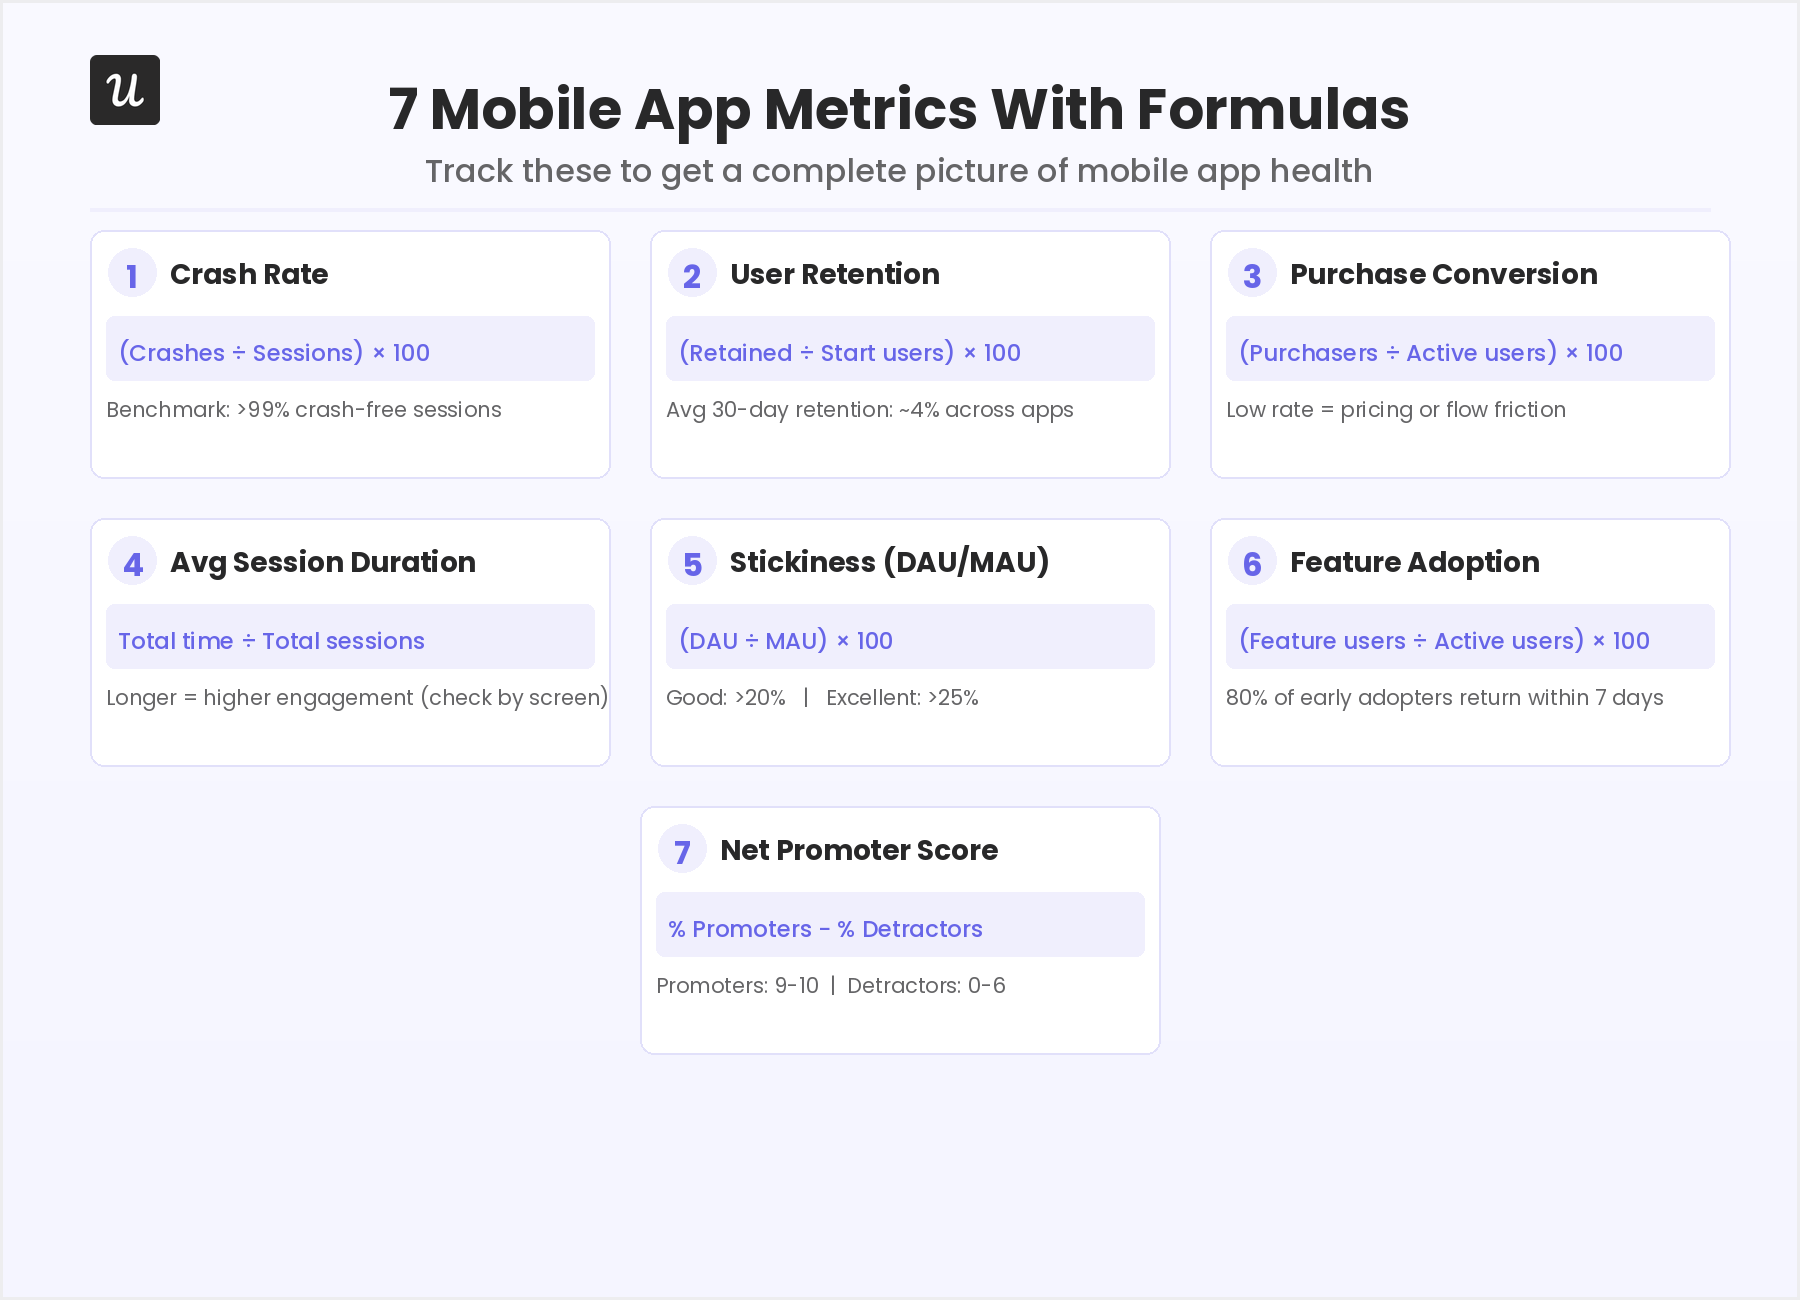
There are more mobile app metrics than any team can realistically act on. But the seven below cover the full picture of app health without drowning you in data you won’t use.
1. Crash rate
The crash rate is the percentage of app sessions ending in an unexpected termination. Frequent crashes directly cause poor reviews, negative word-of-mouth, and high customer churn, and tracking it regularly lets you spot and address instability before it compounds. The industry benchmark for crash-free sessions is above 99%, so anything below that warrants investigation.
Formula: Crash Rate = (Number of Crashes / Total Sessions) × 100
2. User retention rate
Your app’s user retention rate measures the percentage of mobile users who keep engaging with your app over a given period. A high rate signals that users are finding real value. On the flip side, a low rate is your clearest sign that something in the experience or the product itself needs work. App retention rate tends to drop drastically in the first few days, which makes retention the single most important metric for most mobile teams to optimize.
Formula: Retention Rate = (Users retained at end of period / Users at start) × 100
3. In-app purchase conversion rate
This metric tracks the percentage of active users who complete an in-app purchase. A consistently low conversion rate points to issues with pricing, the product offering, or friction points in the purchase flow itself, and each of those has a different fix. Monitoring it with conversion funnel analysis over time tells you whether changes you make to the purchase experience are actually working.
Formula: Conversion Rate = (Users who made a purchase / Total active users) × 100
4. Average session duration
Average session duration tells you how long users are actively engaging with your app during a typical visit. Longer sessions generally indicate higher engagement, but sessions that are longer than expected on a specific screen can equally indicate confusion rather than interest. Tracking changes in session duration by screen or flow helps you separate the two.
Formula: Average Session Duration = Total time spent across all sessions / Total number of sessions
5. Daily active users (DAU) and monthly active users (MAU)
DAU counts the number of unique users engaging with your app in a 24-hour window; MAU does the same over a rolling 30-day period. The stickiness ratio (DAU divided by MAU) tells you how habit-forming your app is, with anything above 20% considered strong and above 25% considered excellent.
Formula: Stickiness Ratio = (DAU / MAU) × 100
6. Feature adoption rate
Feature adoption rate tracks what percentage of users are actively using a specific feature within a given period. Low adoption can mean users haven’t found the feature (a discoverability problem) or understood its value (a communication problem). You need to distinguish between the two to understand what needs fixing. A strong feature adoption rate indicates that users have discovered value in your app, and it could lead to a higher retention rate.
Formula: Feature Adoption Rate = (Users engaging with feature / Total active users) × 100
7. Net Promoter Score (NPS)
NPS measures user loyalty by asking how likely users are to recommend your mobile app on a scale of 1 to 10. This survey divides users into Promoters (scores 9 to 10), Passives (7 to 8), and Detractors (0 to 6), with the final score calculated as the difference between the percentage of Promoters and the percentage of Detractors.
After collecting scores, you can trigger a follow-up question asking why users chose their rating and cross-reference the results with session replays and support tickets to understand what’s driving sentiment. A low NPS score indicates issues with your app.
Formula: NPS = % Promoters minus % Detractors
You can build and trigger mobile NPS surveys directly in Userpilot’s mobile analytics suite, with targeting conditions that let you serve the survey to specific user segments at the right point in their journey.
The top mobile analytics tools for 2026
The best mobile analytics platform for your team is one that matches your primary use case without forcing you to manage more tools than you need. Below is an overview table followed by a short profile of each tool.
Overview: Mobile app analytics tools
| Feature | Pendo | Appcues | Mixpanel | Userpilot | Google Analytics (Firebase) |
| Supported Platforms | iOS, Android, Xamarin, MAUI, React Native, Expo, Flutter, Swift UI | iOS, Android, React Native, Flutter, Ionic | iOS, Android, React Native, Unity | iOS, Android, React Native, Flutter, Ionic, Capacitor, Cordova, Xamarin + Web | iOS, Android (Firebase SDK), Flutter, React Native |
| Mobile Event Tracking | ✅ | ✅ | ✅ | ✅ | ✅ |
| Cross-Platform Analytics | ✅ | ✅ (Limited) | ✅ | ✅ | ✅ |
| Multi-App Funnel Tracking | ✅ | ❌ | ✅ | ✅ | ✅ (Limited) |
| In-App Engagement (surveys, guides) | ✅ (Limited mobile) | ✅ | ❌ | ✅ | ❌ |
| Ease of Use and Setup | ❌ Complex setup | ❌ Requires multiple installs | ✅ Intuitive | ✅ Easy, code-free | ✅ Easy via Firebase SDK |
| Pricing | Custom (enterprise) | Custom | Free tier + paid plans | Growth from $249/mo | Free |
| Best For | Deep analytics and AI-driven insights | In-app experiences and feature adoption | Behavioral analytics and funnel analysis | User engagement, onboarding, and re-engagement | Free app analytics for developer teams |
1. Pendo
Pendo is an experience management tool known for its advanced product analytics and autocapture capabilities.
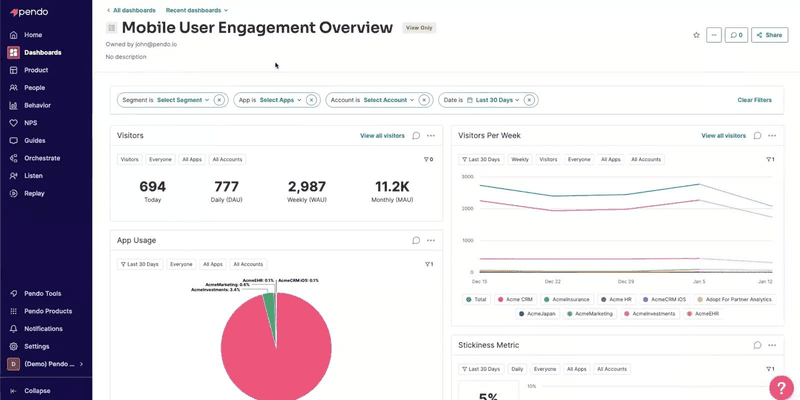
It tracks user behavior across web and mobile apps and automatically begins capturing behavioral data once installed, with the ability to tag specific features retroactively for historical analysis. Setup is complex and may require technical support, and its mobile UI components (tooltips, pop-ups, guides) have limited customization compared to the web version.
2. Appcues
Appcues is a mobile adoption tool that helps teams understand product usage and design in-app experiences for iOS and Android.
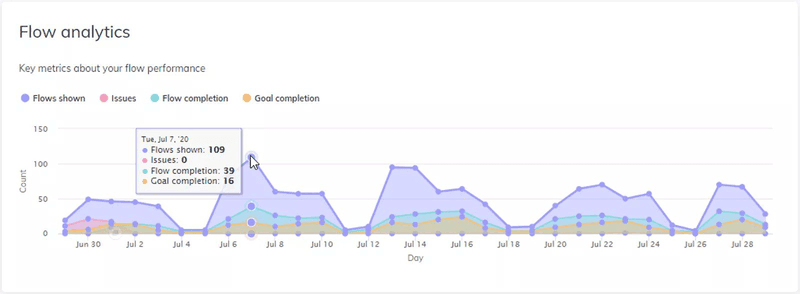
It offers strong user segmentation for grouping users by feature usage or purchase history, built-in NPS survey analysis, and flow analytics that show where users drop off in onboarding sequences. That said, it doesn’t support cross-platform analytics or AI-powered content localization. So, if you’re working across web and mobile, you’ll need to supplement it.
3. Mixpanel
Mixpanel is a leading product analytics platform built around event tracking. It excels at funnel analysis that pinpoints where users drop off, retention analysis to measure stickiness, and user journey mapping to visualize how different user segments navigate through your app.
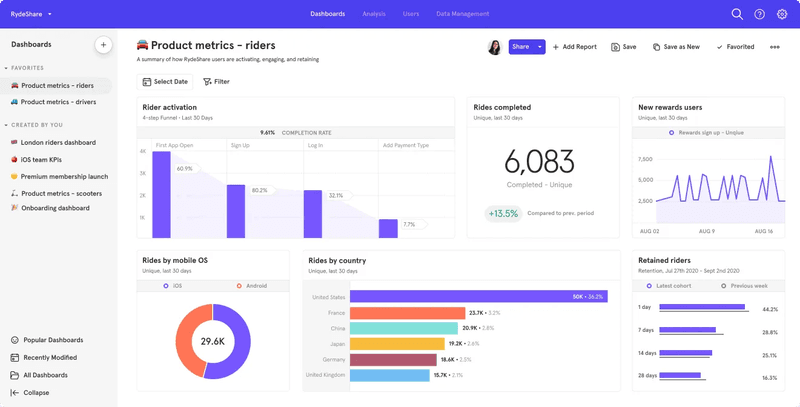
It’s one of the more affordable options with a generous free tier covering up to 20 million events per month. However, it doesn’t have in-app engagement capabilities, so you’ll need a separate tool to act on what it shows you.
4. Userpilot
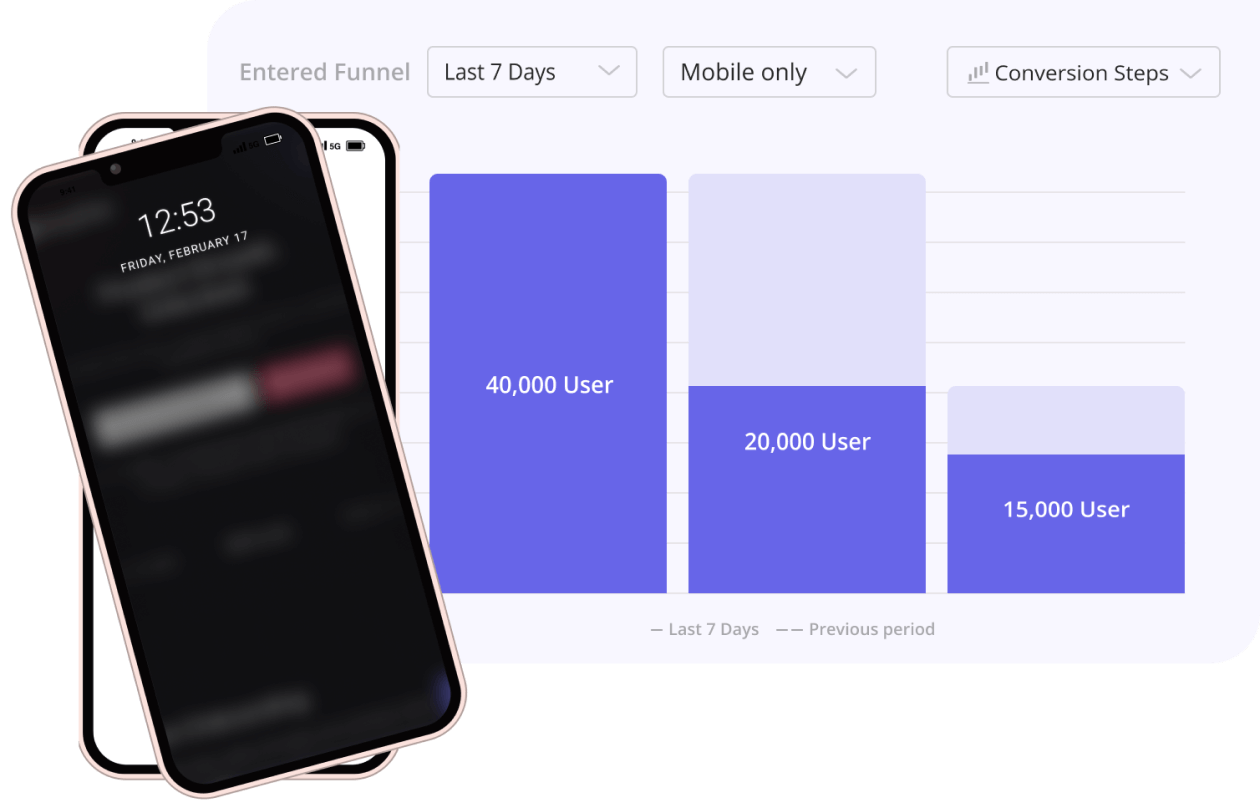
Userpilot is a multi-channel product growth platform built for non-engineering teams. It provides mobile analytics features for tracking user behavior and app performance across iOS and Android, alongside onboarding and engagement tools to help teams act on what the data shows, all from one SDK.
Some of its key features include:
- Cross-platform tracking that consolidates web and mobile analytics data in a single dashboard.
- Advanced segmentation and personalization based on user behavior, device, OS, and language preferences.
- Push notifications triggered by in-app behavior without additional engineering work.
- AI agent, Lia, that makes accessing insights easier through natural language conversations (more on that below).
The strongest differentiator for Userpilot in 2026 is that it closes the loop between analysis and action. For instance, most mobile analytics platforms show you the drop-off. But with Userpilot, you can immediately build a tooltip, checklist, or push notification to address it without filing an engineering ticket.
How AI is making mobile analytics easier to use
One of the less-discussed shifts right now is how AI product analytics is changing the workflow of actually using mobile analytics data. The traditional model requires a PM to build dashboards, write queries, schedule reports, and spend time every week interpreting what the numbers mean. That process is getting shorter.
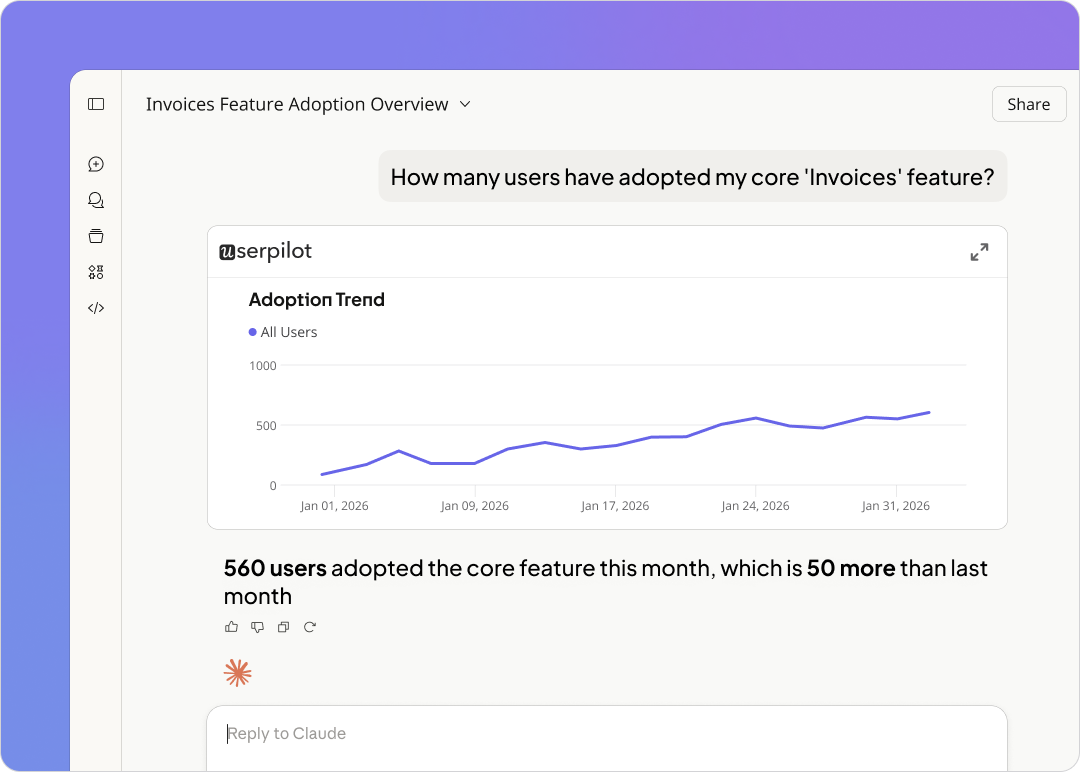
Lia, our AI agent, changes how product managers interact with their mobile analytics data. Instead of navigating dashboards to find a feature’s adoption rate or building a cohort to check retention for a specific user segment, you can simply ask the question in plain language and get the answer immediately. It provides on-demand access to analytics with ease.
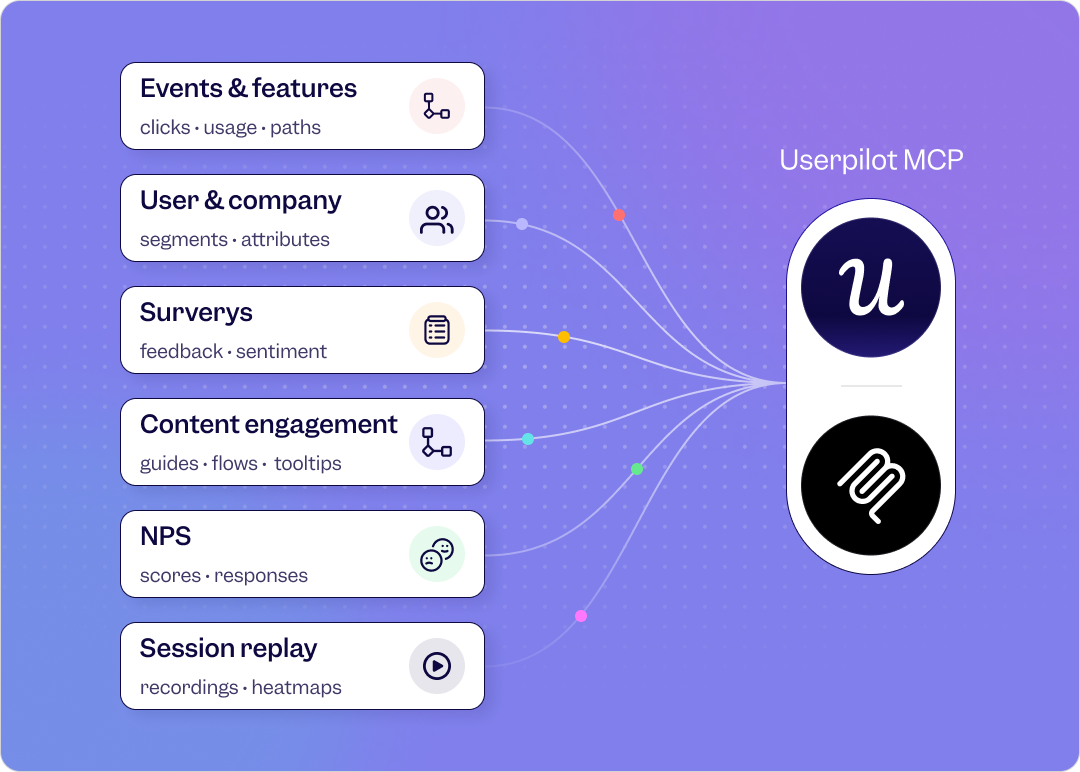
Userpilot’s MCP Server takes this further.
It connects your product usage data to the AI tools your team already uses, so you can query session replay data, NPS results, survey responses, and behavioral analytics without opening Userpilot at all. As Yazan Sehwail, our CEO, explains:
If you as a marketer wanted to see, using session replay, NPS data, survey data, and product usage data, you’re able to get your answer without having to go to Userpilot, without having to pull data and upload it to someone. So this is why MCP is gonna be a game changer.
The shift Yazan describes matters practically. Rather than a PM spending two hours in a product dashboard before a weekly review, Lia can monitor product health continuously and surface the insights that need attention before the meeting happens. The human role shifts from operating the analytics system to evaluating what Lia has already found and deciding what to do about it.
For mobile product teams specifically, this means faster iteration cycles.
Lia can identify where users are dropping off in a new onboarding flow within hours of launch rather than waiting for a manual report cycle, and the fix can go out in the same session.
Standard mobile analytics tools are still relevant and necessary. They’re the data layer everything sits on top of. What’s changing is the interface between that data and the decisions your team makes, and in 2026 that interface is increasingly a conversation rather than a dashboard.
5. Google Analytics for Firebase
Google Analytics for Firebase is Google’s free app analytics solution built into the Firebase development platform.
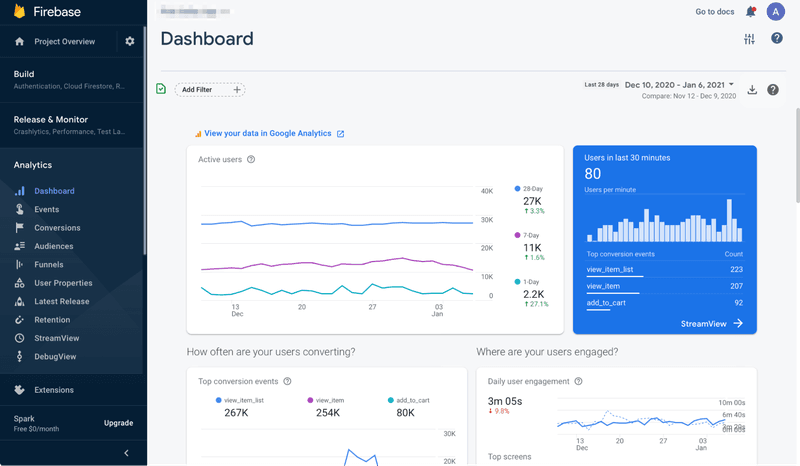
It provides unlimited reporting for up to 500 event types, audience segmentation for targeted messaging via Firebase Cloud Messaging, crash reporting through Crashlytics, and a BigQuery export for teams that want to run deeper analysis on their mobile data. It’s the most common starting point for developer-led teams, especially those already in the Google ecosystem (here’s how Userpilot vs Google Analytics compares).
Making mobile analytics work for you
Mobile analytics reveals in-depth details about your app usage, enabling you to understand where users get stuck so you can deploy fixes quickly. In the long run, it helps you build a product that compounds in value over time.
Ready to see it in practice? Get a free trial of Userpilot to see how it can help you track mobile analytics data, act on what you find, and build better mobile experiences without depending on your engineering team for every fix.
FAQ
How do mobile analytics differ from web analytics?
The key distinction is in the data source. Mobile analytics collects data specifically from mobile apps experience, while web analytics gathers information from user behavior on desktop and mobile websites accessed through a browser. Mobile analytics also includes app-specific metrics like crash rates, push notification open rates, in-app purchase conversion, and app download trends, which don’t exist in web analytics.
Who uses mobile analytics?
App developers and product teams use mobile analytics to track feature adoption, user behavior, and app stability. Likewise, marketing teams analyze mobile analytics data to optimize campaigns and measure acquisition channel performance. Growth and monetization teams focus on metrics like ARPU, LTV, and in-app conversion rates. Similarly, customer support and UX teams use session replays, user feedback, and NPS scores to identify friction and improve usability. Finally, executives and business leaders use high-level metrics like ROI, acquisition costs, and revenue trends to guide product investment decisions.
What is the difference between mobile analytics and traditional analytics?
Traditional analytics is any form of business intelligence used to understand customers and broad market trends, covering web analytics, mobile websites, and other data sources across the business. Mobile app analytics, on the other hand, is specifically focused on metrics relating to how users interact with mobile apps, including session behavior, feature engagement, in-app purchases, and app performance data that only exists in the app environment.
Will AI agents affect my mobile analytics data?
Not immediately for most teams, but this is the right question to be asking now. AI agent traffic on the web already grew drastically in 2025, and a similar trend could play out on mobile apps soon. As these agents use MCP servers and API to interact with your app, standard mobile analytics tools will be blind to them. You’ll need to adopt a different approach to track agent traffic.
About the author