12 Actionable Ways to Improve NPS Scores and Customer Loyalty


You already know that NPS is a metric that SaaS teams use to measure customer loyalty.
But did you know how closely it’s correlated with revenue growth?
Companies with high NPS have lower churn rates and find it easier to acquire new customers (through referrals). Plus, a 10+ increase in the NPS score correlates with a 3.2% increase in upsells.
I stress the word “correlate” on purpose. The revenue doesn’t grow because NPS grows but because of everything you do to improve it.
What exactly can you do?
That’s what you will learn from the article. I will share 12 tried-and-tested strategies to improve user experience and drive customer loyalty.
12 Strategies to optimize your net promoter score
Without further ado, let’s get to the 12 strategies to improve NPS.
1. Increase response rates to your NPS survey
When I asked Ashley Cheng, the Growth and Product Marketer at Usersnap, about ways to improve the NPS score, she stressed the importance of increasing response rates.
Let’s dive into it a bit deeper:
There’s no direct correlation between response rates and the NPS score. However, increasing the response rates will help you better understand your customers’ pain points and needs. So, by acting on the insights, you will increase the NPS score in the long run.
Here’s how to do it:
- Explain the purpose of the survey and its benefits for the user, like improving their experience.
- Make the open-ended follow-up question optional.
- Use analytics to learn when users are most engaged, for example, X minutes after logging in – that’s when you send the survey.

2. Pair NPS with other surveys for a holistic view
There’s another way to improve your understanding of your users: gather additional insights through other surveys.
Here are three common survey types I recommend:
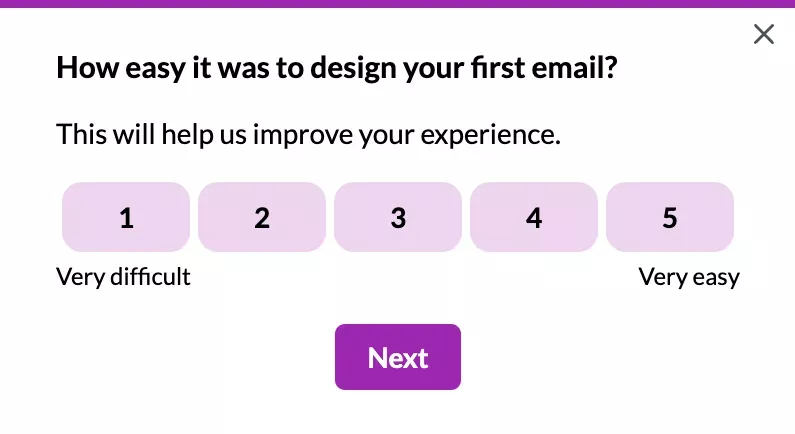
- CES survey, or Customer Effort Score, gauges how easy it is to complete a task or use a feature. Making your product easier to use is a surefire way to improve customer satisfaction.
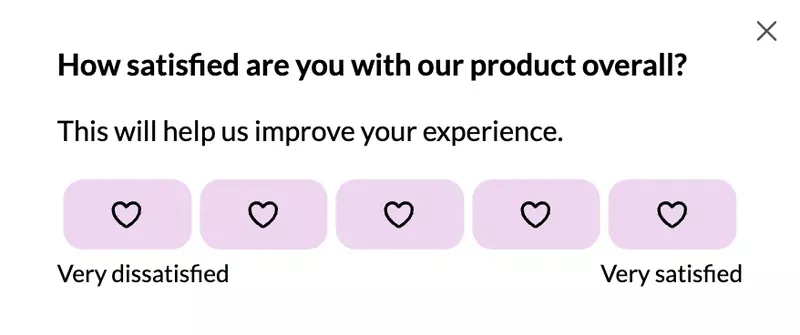
- A CSAT survey, or Customer Satisfaction Score, measures overall satisfaction with the product and can help you identify customer experience gaps.
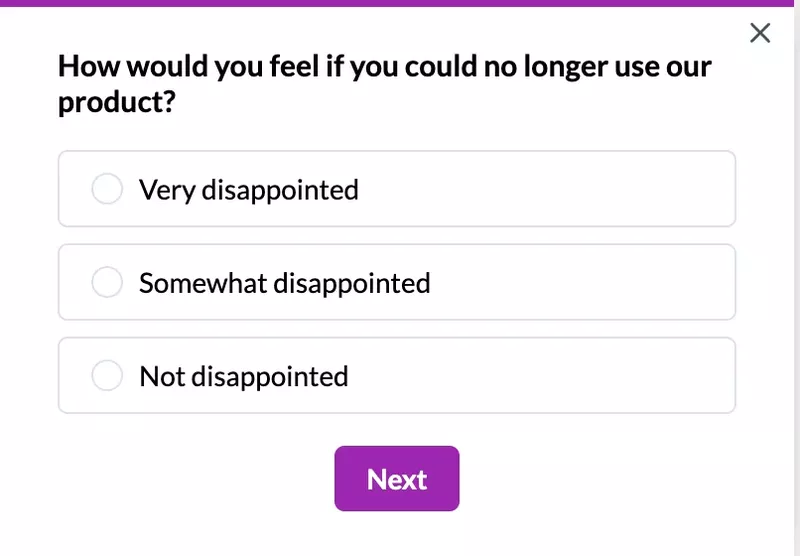
- PMF survey, or Product-Market Fit, asks how disappointed customers would be if they couldn’t use the product. This survey measures how successful your product has been in satisfying market demand.
3. Interview detractors to understand their pain points
Negative feedback stings. But it’s also your best opportunity to find ways to improve the customer experience.
Invite your dissatisfied users to a quick interview to drill into the issues that bother them.
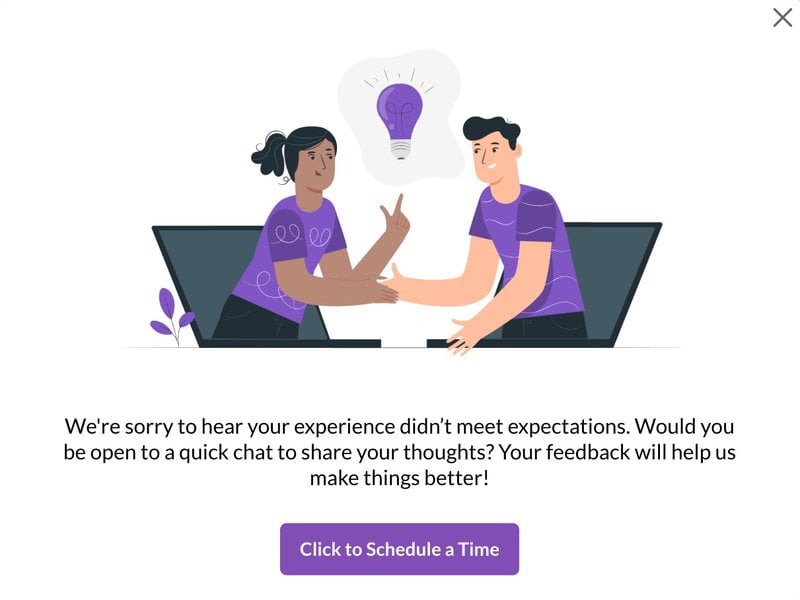
The easiest way to do it? Create custom messages that you can send automatically to acknowledge customer feedback. In the message for detractors (score 0-6), say how sorry you are that the product doesn’t meet their expectations and ask if they could help you by chatting about their pain points.
4. Convert passives into promoters
Unlike detractors, passives (score 7-8) don’t have major issues with your product. When you ask them, they might not even know why they haven’t given you a higher score!
There’s a better way to understand their reasons than a survey: in-app behavior analysis. Looking at how they interact with your product can clue you in about what works for them or what doesn’t.
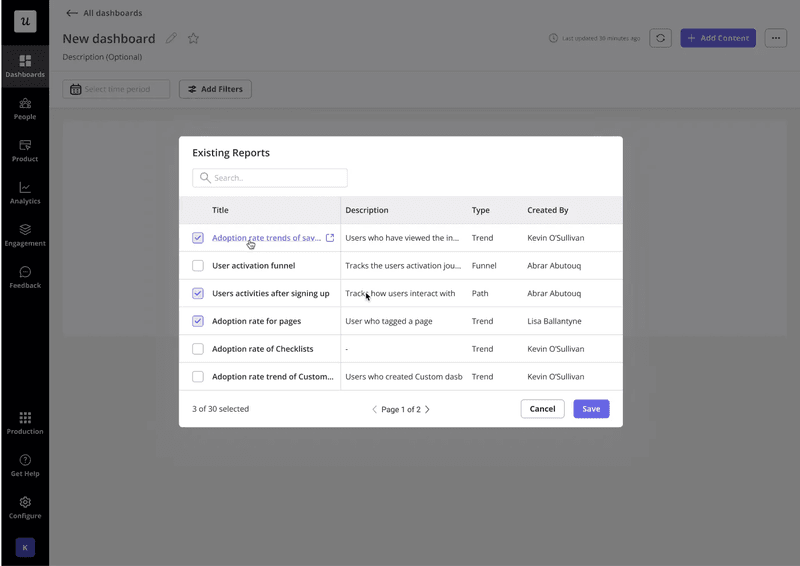
That’s how we found friction in Userpilot’s report dashboard. Session recordings revealed that instead of clicking on the “Add” button, the users would click the report name.
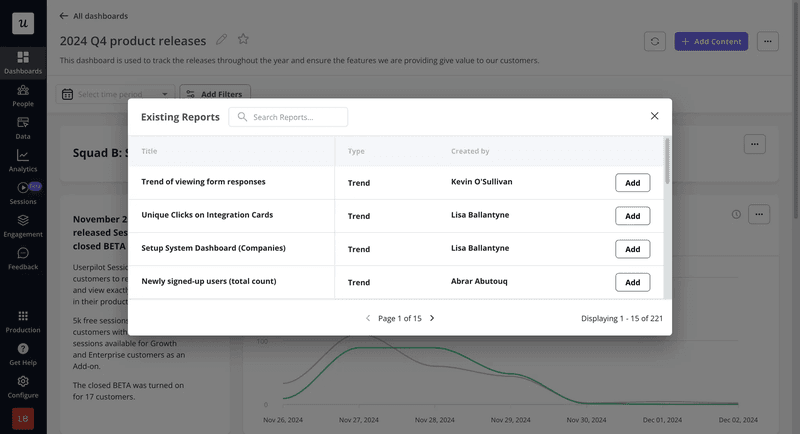
Armed with the insights, our UX Researcher Lisa optimized the design by removing the button and adding links to the report names.
5. Leverage the insights from promoters
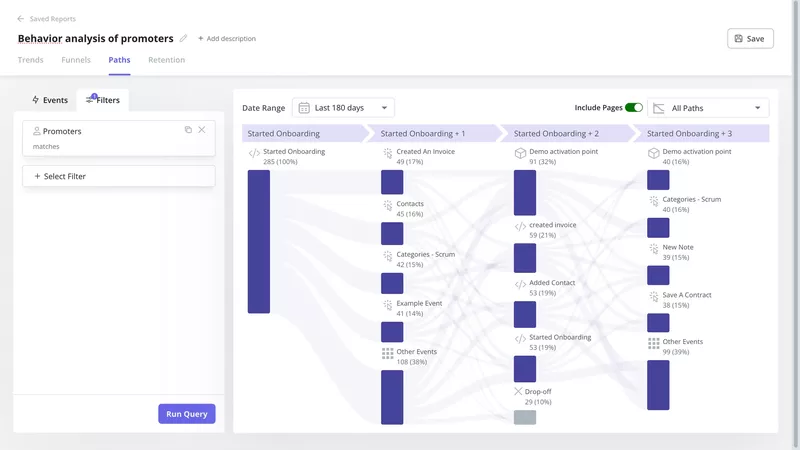
You can also improve your NPS score by analyzing the behaviors of your promoters. They are successful product users, and by looking at their behavior inside the product, you can find patterns that other users could replicate.
For example, a path analysis could show you the most optimal route to activation and adoption. You can use the insights to create onboarding flows that guide the less satisfied users to success.
But wait — there’s more!
Promoters are your fans; they want your product to succeed because it helps them succeed, too. Use this to your advantage. Interview them to understand their main satisfaction drivers and discover how else you can add value to the product.
6. Create an effective NPS feedback loop
When asked about the biggest mistakes that companies make, Meagan Glenn, the Senior Program Manager at Lavender, said it was not acting on feedback.
It’s a problem for two reasons.
First, you show your users there’s no point in completing surveys because it makes no difference. And that you don’t care. Second, you waste resources collecting and analyzing data, and no positive change comes from it.
So don’t just pester your users with surveys for their own sake. Close the feedback loop!
Unolo, one of our customers, reduced their churn rates by up to 1% by doing just that. They ran NPS surveys, tracked the results, and followed up with customers to understand their challenges. The insights informed changes that improved the user experience.
And do it quick! CustomerGauge research shows that companies that close the feedback within 48 hours see the biggest boost in NPS scores.
7. Prioritize the feedback with the highest impact
Let’s face it: not all feedback is worth acting on. Product teams often find that implementing some customer suggestions doesn’t justify the level of effort it requires.
How do you decide? Use a prioritization framework.
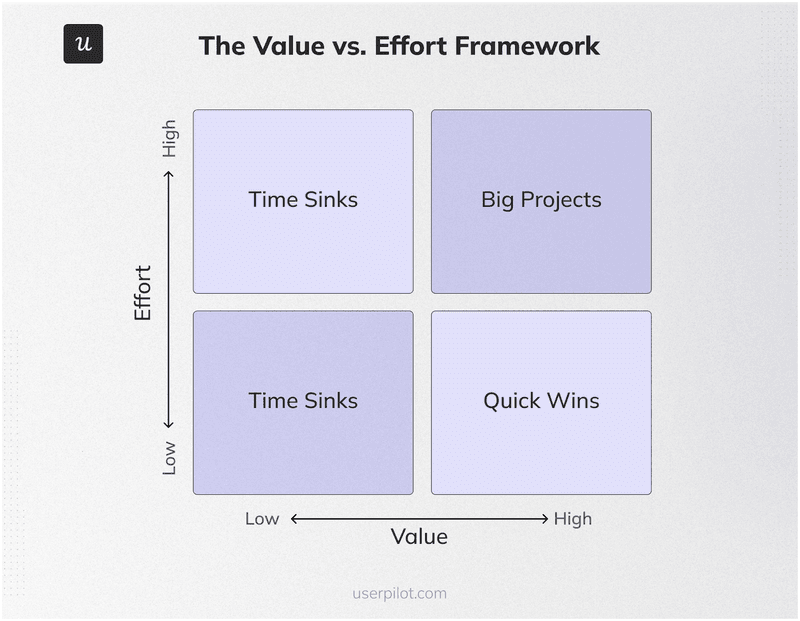
My favorite is the Value vs. Effort Matrix. It groups requests into four main buckets:
- High value, low effort (Quick Wins)
- High value, high effort (Big Projects)
- Low value, low effort (Fill-ins)
- Low value, high effort (Time Sinks)
8. Onboard customers to familiarize them with the product’s functionality
User onboarding is the secret sauce of high NPS scores. By helping users discover features and learn how to use them, it allows them to achieve their goals.
How do you design onboarding experiences that hit the mark?
- Personalize them for different user personas. Jane from Accounts needs to know how to create expense reports, not how to configure the software.
- Use onboarding checklists to guide users through key activation tasks. Pick 3-5 tasks whose completion is most correlated with user retention.
- Create interactive walkthroughs to guide users through each task.

9. Provide self-service support to combat user friction
Onboarding is just a start. Customers need help to overcome friction throughout the customer journey.
And most of them, about 67%, would rather not deal with a support agent when they find an issue.
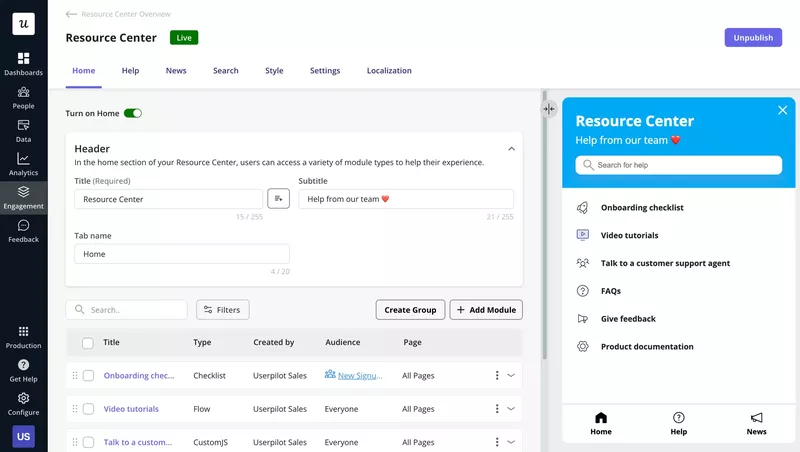
So, give them the self-service resources they need to resolve their problems independently. Think of a resource center with guides, video tutorials, product documentation, FAQ pages, an AI chatbot, or a community forum.
Of course, these resources won’t solve all problems, and sometimes, help from the customer service team is essential. However, it will be easier for the agents to resolve complex issues if the user has already tried common solutions.
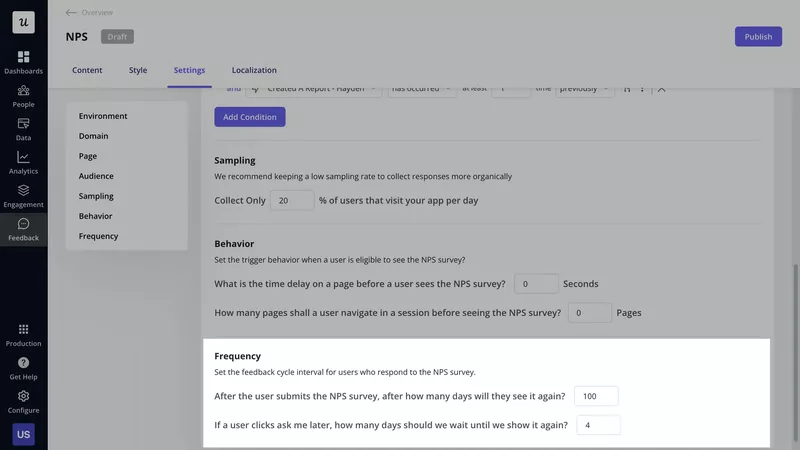
10. Conduct NPS surveys frequently to monitor trends in scores
Running a single NPS survey is like looking at a single frame out of a movie. It doesn’t give you much context.
To get a complete picture, you need to conduct them regularly. Only then can you understand if all the hard work of your teams makes sense.
How often is often enough? Research suggests that companies that run surveys quarterly see the highest increase in retention rates.
So, set your NPS surveys to recur every 3 months.
11. Use product analytics to identify at-risk customers
I already showed you how to use product analytics to understand the factors leading to promoters’ success and pinpoint issues stopping passives from becoming promoters.
But what about those users who are too disengaged to participate in surveys? Suffering subpar user experience in silence? Technically, they don’t lower your NPS score, but they won’t remain your customers for long.
Analytics can help you identify them, prevent their churn, and convert them into promoters in the long run.
First, conduct funnel analysis to find the users that drop off. In Userpilot, you do it by clicking on the chart bar. Once you have the user list, engage them individually or segment them and analyze their behavior for broader patterns.
12. Monitor competitors to learn how to exceed customer expectations
Monitoring what your competitors do well and where their products are lacking can help you identify customer expectations and exceed them.
Imagine that your competitor launches a new feature, and their customers can’t stop raving about it on their socials or in reviews. That’s a sign you need this feature.
And if the feedback is negative? Consider if it applies to you. If it does, act on it to fill any user experience gaps.
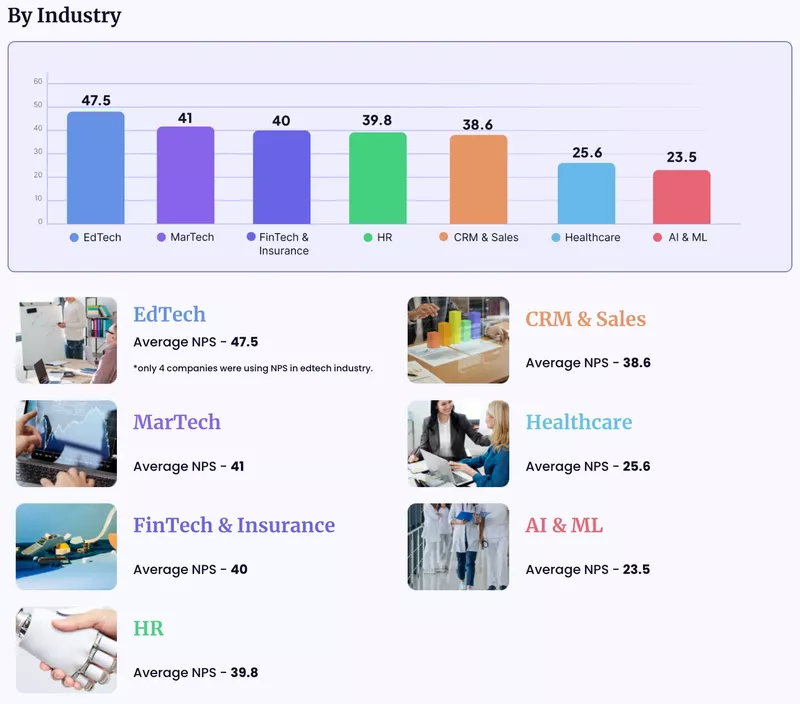
What is a good NPS score improvement?
There’s no easy answer to this question. It depends.
Our data shows considerable discrepancies in NPS scores across industries. EdTech companies have an average NPS score of 47.5, while AI & ML products — 23.5. If you’re in the latter, the room for improvement is smaller than in the industries with higher average NPS scores.
The maturity of your product is another factor. If you’re only starting, you can expect quicker gains. Once you pick all the low-hanging fruit, the progress is slower.
About the author