Retention Rate Formula: A Guide for 2026


Your retention rate is the percentage of users or customers who continue using your product over a period. It confirms if your product delivers ongoing value or loses momentum after the first interaction.
In SaaS, retention usually falls into two categories:
- Customer retention is when paying accounts stay subscribed. This directly affects revenue and ARR.
- User retention tells you whether individual users remain active in the product. This signals future churn, expansion, or contraction before revenue changes.
For example, a B2B company might renew its annual contract (customer retained), but only one admin logs in while the rest of the team stops using the product (users not retained).
Revenue looks stable, but adoption is eroding. That’s why tracking both customer and user retention is essential for understanding “true” product health.
Select your industry to benchmark your retention rate formula:
How to calculate retention rate
Retention rate is calculated slightly differently depending on whether you’re tracking customers or users.
1. The former answers a revenue question: are paying accounts staying subscribed?
2. The latter answers a product question: are people actively using our product and getting value?
Here’s how to handle both:
1. Customer retention rate
This reveals the paying accounts that stayed with you over a period.
Formula:
Customer retention rate = ((Customers at end of period − New customers acquired) ÷ Customers at start of period) × 100)
Where:
- Customers at start of period = all active paying accounts at the beginning of the timeframe
- New customers acquired = accounts added during that period
- Customers at end of period = total active paying accounts remaining at the end
2. User retention rate
This measures whether individual users continue with your product, regardless of billing status.
Formula:
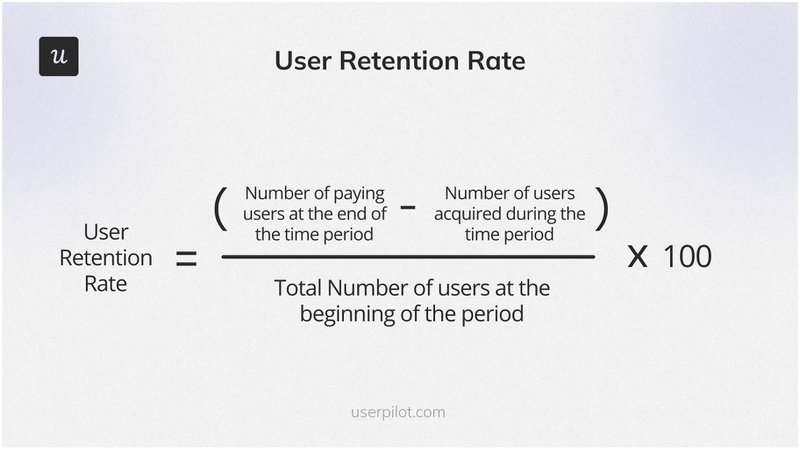
Where:
- Users at start of period = total active users at the beginning of the timeframe
- Users at the end of the period = total active users at the end of the timeframe
- New users acquired during the period = users who signed up within the timeframe
Both formulas follow the same logic and are commonly used across SaaS teams for tracking long-term product health.
![]()
Boost Your SaaS Retention Rate Formula Outcomes with Userpilot

What is a “good” retention rate?
A “good” retention rate is contextual. It depends on your product type, audience, and usage frequency. A daily-use B2B SaaS tool, like Slack, for example, will naturally retain product managers better than a niche or occasional-use product, like Docker Swarm.
Nonetheless, there’s a benchmark.
According to our 2025 SaaS Product Metrics Benchmark Report, the average Month 1 retention rate across 83 SaaS companies is 46.9%, with a median of 45.25%.
Going deeper, we explored the averages by industry. Check yours:
- Fintech & Insurance: 56–58%
- AI & ML: 43-54%
- CRM & Sales: 52–57%
- Martech: 44–45%
- HR: 22–42%
- Healthcare: 29-35%
So, as a rule of thumb, if you’re above your industry’s median, you’re in a healthy range. If you’re below it, retention is likely your biggest growth lever.
💡 Can’t find your industry?
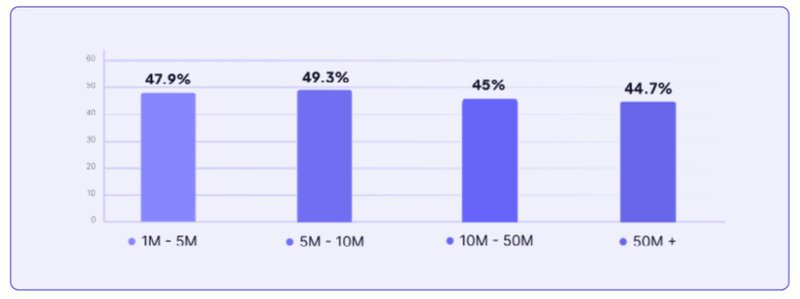
- Check by company size; or
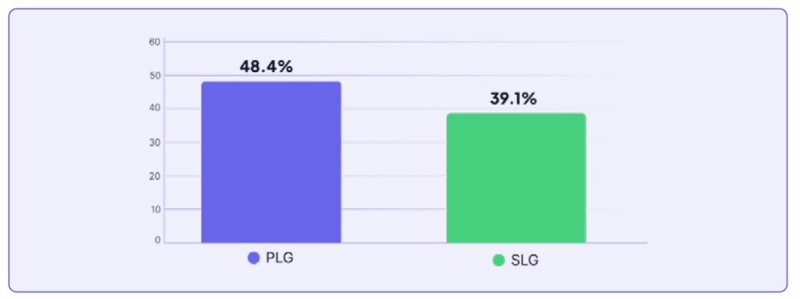
- PLG vs. SLG
3 Retention rate calculation examples
I used examples across customer and user retention, as well as an early-stage SaaS, to show how the retention rate formula works in practice.
Retention rate calculation #1
For customer retention:
- Starting customers: 500
- New customers added: 100
- Customers at end: 520
Retention rate = ((520 − 100) ÷ 500) × 100) = 84%
Interpretation: An 84% retention rate reveals that most existing customers stayed. But churn still affected 16% of the base. In other words, new acquisitions influenced growth, not existing customers at that period.
Retention rate calculation #2
For user retention:
- Starting users: 2,000
- New users added: 800
- Users at end: 1,900
Retention rate = ((1,900 − 800) ÷ 2,000) × 100) = 55%
Interpretation: A 55% user retention rate means nearly half of the original users became inactive during the period. The number of total users is high due to new signups, but core engagement is weakening. That often signals onboarding or early value issues.
Retention rate calculation #3
For early-stage SaaS:
- Starting users: 1,000
- New users added: 300
- Users at end: 1,050
Retention rate = ((1,050 − 300) ÷ 1,000) × 100) = 75%
Interpretation: A 75% retention rate shows healthy early traction. Most users who signed up stayed active, suggesting that the value proposition lands.
Through the examples, retention rate tells you what happened (outcome), not why (behavior). To fix it, you must understand user behavior. Userpilot can help with that.
Userpilot connects retention drops to in-app behavior, such as activation gaps, low feature adoption, and friction points in key workflows. This provides clear signals on what to fix and when, so you can intervene early before churn compounds.
What are common mistakes when calculating retention rates?
Even with a standard retention rate formula, results can vary based on how the data is grouped or interpreted. Understanding the nuances will help you make better product decisions.
Mistake #1: Using the “shortcut” formula
Calculating retention by dividing “users at the end of the period” by “users at the start” blends new signups with existing customers. That makes retention appear healthier than it really is.
For example, if you lose 200 users but add 300 new ones, your total user count will grow. The shortcut formula will show “good” retention, even though a large chunk of existing users left.
Do the right thing: Always subtract new users first so retention reflects who actually stayed, not who merely replaced losses.
Mistake #2: Treating a single retention percentage as insight
A single retention number makes sense for a board slide. But it is weak for making product decisions. Here is why:
When you blend all users into one percentage, you hide what’s actually happening underneath. New users, long-time customers, and different plans all behave differently. For example, users who signed up last month may churn sooner than those who did six months ago.
A single retention percentage smooths those differences.
Do the right thing: Cohort-based retention. Instead of asking “Are we retaining users?”, it guides you to ask “Which users are we retaining, and when do others drop off?”
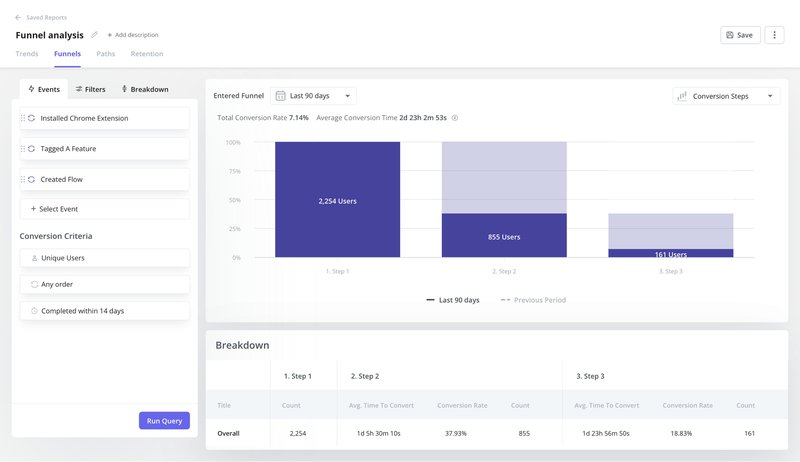
Tools like Userpilot make this practical. With Userpilot, you automatically visualize retention by cohort, spot behavioral patterns, and fix them right there.
Mistake #3: Ignoring revenue retention entirely
User or customer retention does not equal revenue health. A product can retain most of its accounts and still lose money if the customers leaving are your highest spenders. This is common in B2B SaaS, where a few enterprise accounts can represent a large share of ARR.
That’s why logo retention alone creates false confidence. Losing two high-value customers can outweigh retaining twenty low-tier ones.
Do the right thing: To avoid this blind spot, track Net Revenue Retention (NRR) next to retention rate.
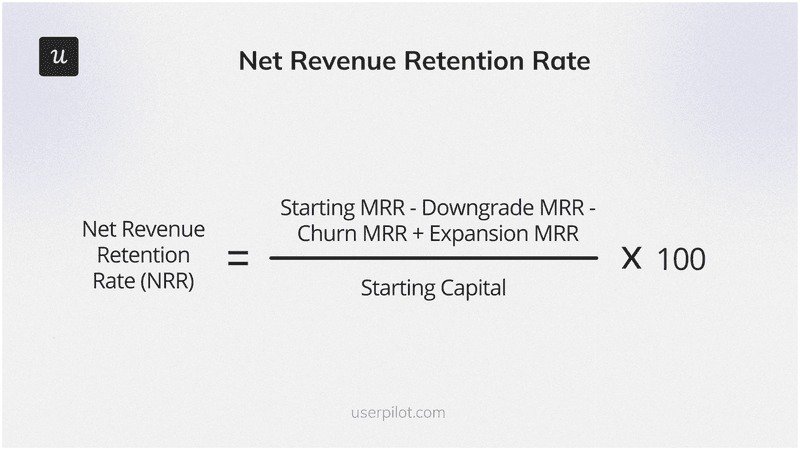
NRR shows whether expansion, contraction, and churn are growing or shrinking revenue within your existing customer base.
Retention rate works best when it’s tied to user behavior
Retention is only useful when you connect it to what users actually do in your product. By itself, it tells you what happened. Behavior tells you why.
When you link retention to activation events, feature usage, and friction points, patterns become obvious. You’ll also see which actions drive stickiness, where users disengage, and what you need to rectify before churn risks increase.
Userpilot helps here. It ties retention changes to in-app behavior, helping you spot activation gaps, low feature adoption, and friction early, then act with targeted in-app guidance.
Book a demo now and fix the “why” behind your low retention rate!
![]()
Drive Your SaaS Retention Rate Formula Outcomes with Userpilot
FAQ
How do companies track retention rate?
Companies track retention by measuring the number of users or customers who remain active over a given period. Using analytics tools, SaaS teams calculate retention by cohort and then connect the results to user behavior (like activation and feature usage).
What does an 80% retention rate mean?
An 80% retention rate means 8 out of 10 users or customers from the start of a period are still active at the end, excluding new signups. Whether it’s good for your business’s long-term success depends on product type, stage, and timeframe.
What is a retention rate in HR?
In HR, retention rate (meaning employee retention rate) measures the percentage of employees who stay with a company over a specific time period. It’s used to assess workforce stability, employee satisfaction, turnover rate, and the effectiveness of hiring and retention strategies.
How do employee retention strategies affect retention rate, and how can you measure it?
Employee retention strategies like fair employees’ yearly salary, strong work-life balance, and clear growth paths improve stability. Use a retention rate calculator to track how many employees stayed over time and confirm you’re achieving a higher retention rate.
How many employees should be included when calculating employee retention?
Include how many employees you had at the start of the period, excluding new hires. This shows whether retention strategies are working and prevents growth from masking underlying retention problems.
About the author