Marketing Automation ROI in 2026: The $5.44 Stat Is a Lie


Marketing automation ROI is the easiest number in SaaS marketing to inflate, yet the hardest one to defend when scrutinized. Every dashboard tells the same story of automated emails sent and workflows triggered, but none of that tells you whether those efforts resulted in revenue that wouldn’t have been generated otherwise. The number everyone quotes to prove that marketing automation works comes from the research firm Nucleus Research:
“We found that for each dollar spent, deploying organizations realized $5.44, on average, in benefits over the first three years post-deployment, with a payback period under six months.”
This number was extracted from a review of 16 vendor-published case studies from the 2016 to 2020 period. However, none of those case studies ran a control group. All they can prove is that revenue went up, not whether those revenue gains would have happened regardless. Organic growth, seasonal spending, and other factors could just as easily have had an equal or greater effect on the revenue growth rate during that period without anyone realizing it.
In reality, you should be using user behavior analysis as your control mechanism to distinguish between growth that would have happened anyway and growth that resulted directly from your automations. This guide will show you how to prove the true ROI of your marketing automation efforts, avoid vanity metric pitfalls, and identify key areas where automations can still provide genuine value.

What marketing automation ROI actually has to prove
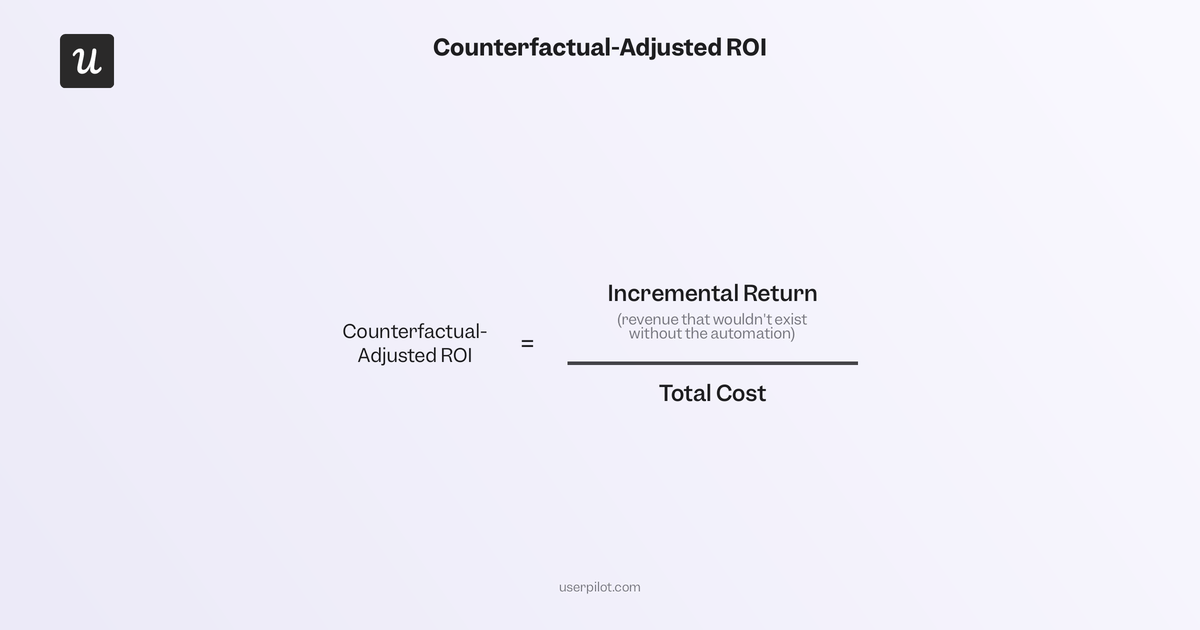
The honest ROI formula that we should have all been using from the start is counterfactual-adjusted ROI. Counterfactual-adjusted ROI equals incremental return (not total return) divided by total cost. Incremental return consists of revenue that wouldn’t have been generated without the automation.
Arielle Feger, Senior Analyst at EMARKETER, explains why incrementality is so important for measuring return on investment:
“Incrementality isolates true lift by comparing audiences who saw an ad against a control group who did not.”
In fact, 52% of brand/agency marketers in the US now use some form of incrementality testing to measure campaigns. The same approach applies to in-app onboarding flows and automated email sequences just as much as it does for paid advertising, yet SaaS product marketers and automation specialists are lagging behind performance marketers when it comes to adopting this new standard of ROI measurement.
This is doubly baffling when you realize that creating a control group is far easier in marketing automation than it is for media buying. All you have to do is withhold a workflow from 10% of your target segment, run it on the remaining 90%, and compare product marketing KPIs between both groups after a month or two. Early-stage SaaS companies with fewer customers can get around the sample size problem by just allocating a larger percentage of users to their control group with an even 50/50 split.
The vanity-activity trap (and silent churn within it)
When I asked James Mitchinson, our Head of Customer Success here at Userpilot, how he separates healthy accounts from those at risk of customer churn, he told me about a customer who got off to a slow start:
“It was clear progress wasn’t being made, but there were still a lot of logins. Being able to look at the difference between those two things, lots of activity, but the outcomes aren’t really materializing, gave us the opportunity to have a more frank conversation with the executive stakeholder before they gave up.”
Everything looked fine on paper with strong login numbers, steady product usage, and nothing that would raise alarms on activity alone.
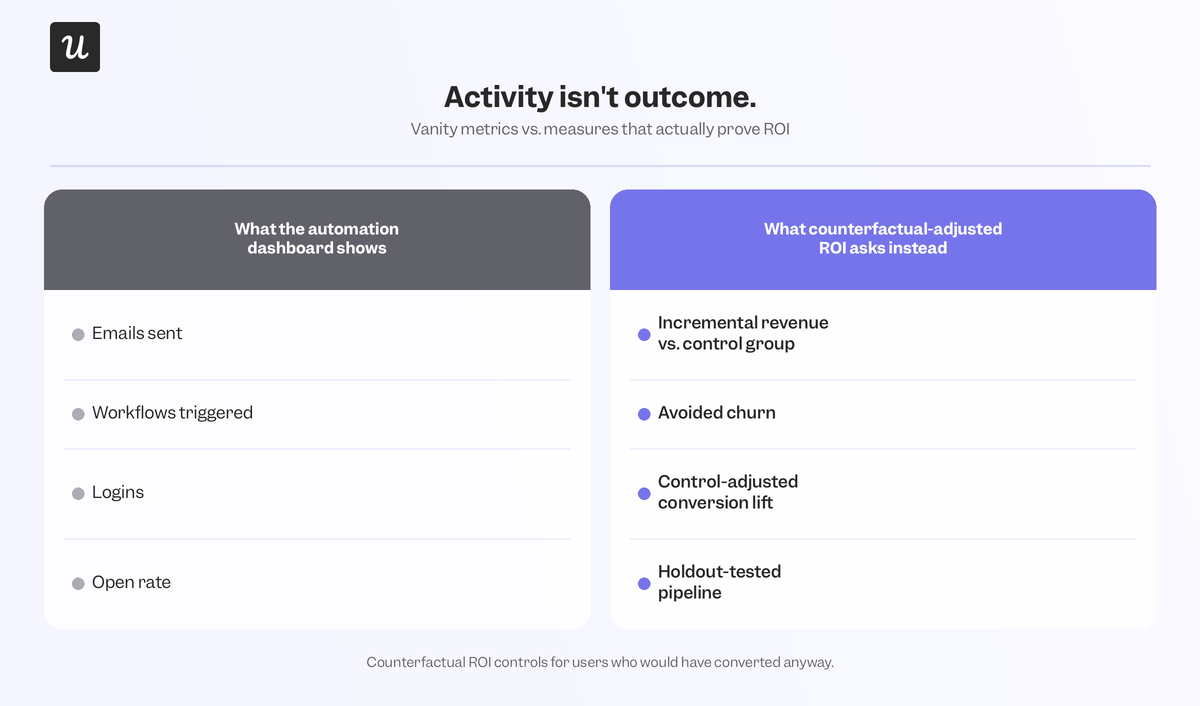
That type of vanity activity, where a lot is happening but nothing gets done, is deviously effective at masking silent churn until it’s too late. The same phenomenon could occur during marketing automation campaigns. The last thing you want is to end up with a SaaS email marketing sequence with a 40% open rate but zero pipeline generated, or a welcome flow that routes users at the start of their onboarding journey but doesn’t stop first-week churn rates from rising.
Activity and outcome aren’t the same. Treating them as interchangeable is how marketing teams convince themselves that a campaign is working even when nothing substantial is being achieved.
James also flagged a similar trap on the support side where a spike in customer tickets looks like a bad signal, but it at least means that customers are still engaged enough to complain:
“An even bigger indicator of churn risk is actually if a customer is engaged in submitting tickets, and then all of a sudden, that stops. Silent churn is really about how the pattern changes. Clusters of activity, followed by moments of silence, can be a good indication that a user’s given up.”
Marketing automation’s version of silent churn would be a lead that opens every email for three months but never converts, or a user that clicks through every in-app announcement but never upgrades their subscription. Behavioral analytics tools make silent churn louder, allowing you to intervene before users cancel their subscriptions and increase retention more proactively before it’s too late.
Where marketing automation still earns real ROI
Don’t get me wrong, the argument isn’t that marketing automation has stopped working altogether. There are still a handful of use cases where it can be worthwhile, so long as you pair your SaaS automation tools with counterfactual measurement. Lead scoring is one of the cleanest wins because it’s inherently counterfactual. You score leads on product usage or behavioral signals, route the highest scorers to sales, and compare their close rate against a similarly sized cohort that wasn’t prioritized.
If scored leads convert no better than the unscored control group, the scoring model isn’t adding any value. In contrast, lead scoring that identifies power users can have a larger impact on incremental conversion rates because usage-based scoring tends to outperform firmographic scoring alone. Another example would be proving the ROI of in-app onboarding flows by measuring their time-to-value against a cohort that skipped the flow or had it hidden through user segmentation.
A user onboarding checklist that reduces the time to value by three days relative to the control group is a clear result. In contrast, looking at total activation rates alone without testing against a control group is anyone’s best guess as to whether that metric would’ve trended upwards regardless of the flow. Email is the automation category with the most documented ROI, but the sloppiest attribution criteria. Automated email sequences outperform manual sends on open and click rates, but outperforming manual campaigns and generating incremental revenue aren’t the same.
The only way to see whether higher open or click-through rates are converting into additional revenue is to A/B test your subject lines and send times against a control group, instead of crediting the sequence with pipeline that may have been generated anyway. In-app messaging, feedback surveys, and self-service support round out the list because all three make tracking activity trivial but measuring impact a lot harder. Are survey responses translating to higher customer lifetime value and has your resource center successfully reduced support ticket volume?
Counterfactual-adjusted ROI calculations
52% of marketers cite collecting quality data as their top challenge in using automation to improve performance. Without a product analytics framework behind the right sources and formulas, you’ll end up with skewed insights that lead teams astray under the guise of data-driven decision-making. The formula below will show you how to use counterfactual-adjusted ROI as the measuring stick for your automation program instead of relying on naive ROI that can never paint the full picture (and could even actively mislead you).
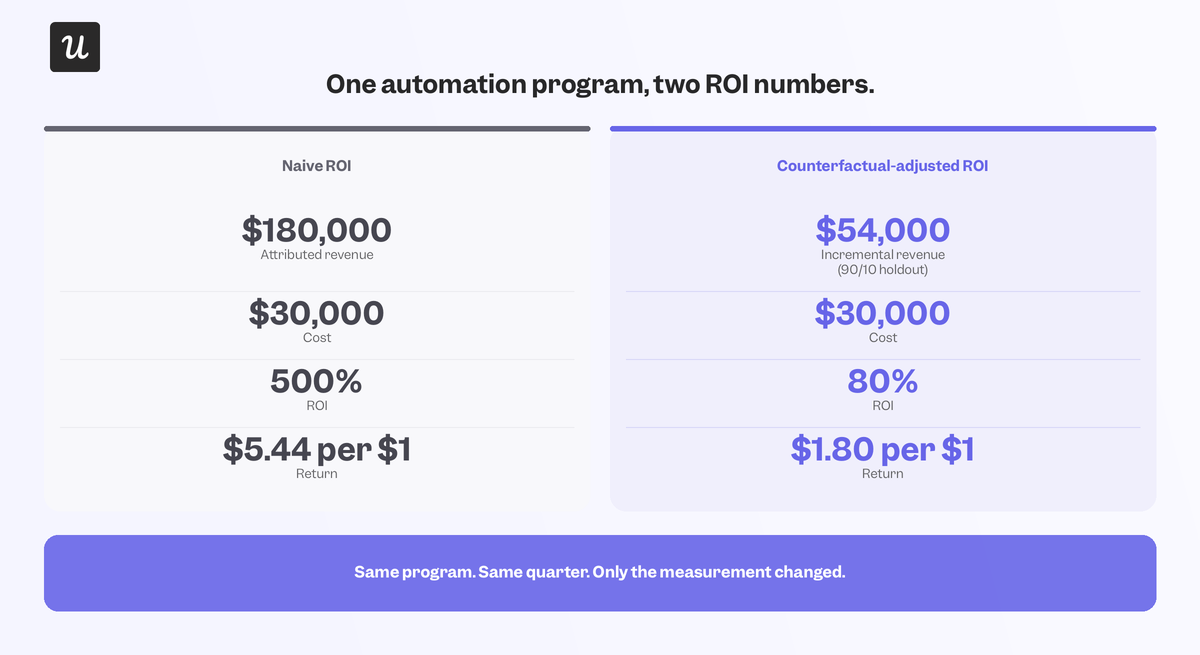
If a SaaS team spends $30,000 a year on its automation platform to run onboarding flows and customer lifecycle management campaigns, and the dashboard’s last-touch attribution credits those workflows with $180,000 in revenue, then you’d think that the ROI is 500% using the formula: naive ROI = ($180,000 revenue – $30,000 cost) / $30,000 cost x 100. That’s the kind of math that leads industry statistics to report $5.44 in ROI for every dollar spent on automation.
In contrast, try separating 10% of your user base as a control group for a full quarter. Some customers in the control group will still convert despite not being exposed to the automated workflows, albeit at a lower rate and slower timeline. If the control group converts at 70% the efficiency of the cohort who saw the automations, that means just 30% (or $54,000) of the $150,000 revenue is genuinely incremental. In this case, you’d use the formula: counterfactual-adjusted ROI = ($54,000 incremental revenue – $30,000 cost) / $30,000 cost x 100.
This provides a much more realistic ROI of 80% or $1.80 per dollar spent. It’s the same program and timeframe, with the only difference being controlling for conversions that would’ve happened regardless of the automated workflow being added. To be clear, an 80% return is still a good investment. It’s just not the same as a 500% ROI that might encourage you to take on debt to ramp up marketing automation spend if you believe the naive number.
Use realistic ROI calculations for data-driven marketing automation
The marketing teams that get the most out of automation aren’t the ones running the most workflows, but rather those whose product marketing strategy is built on an accurate view of how much revenue is actually being generated by these efforts. You can’t measure return on investment without using control groups to weed out the sales that would’ve occurred on their own. Trying to do so can lead you down the wrong (and very expensive) path.
Userpilot helps you manage both the marketing automations that target specific user segments within the product itself and the real-time analytics you need to measure whether your efforts are truly paying off. Book a demo to see how you can set up marketing automations and track their ROI on a single unified platform!
About the author