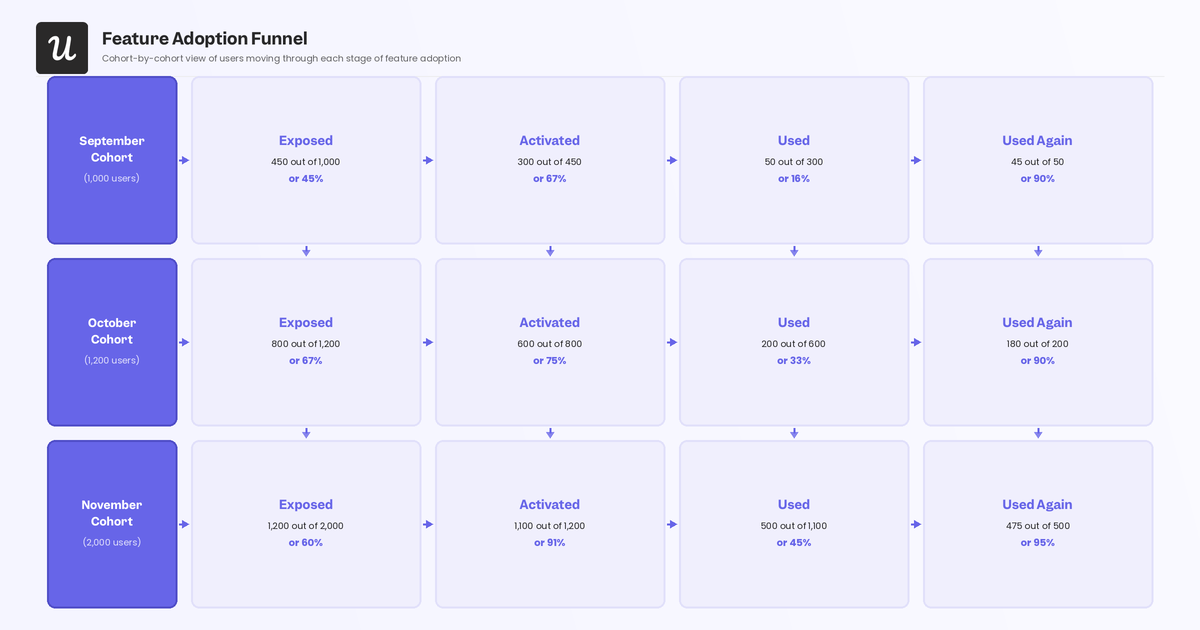
The Adoption Funnel in 2026: Stages, Metrics, and How It Works for Human Users and AI Agents


A feature adoption funnel helps new and existing users navigate through every stage of the user journey but it’s getting increasingly more difficult to interpret feature adoption funnels because the user base of most SaaS products now includes AI agents alongside human users. While both populations may show up in the same product analytics dashboards, they move through the funnel completely differently. The original four-stage model (Exposed, Activated, Used, Used again) was built for humans who move through these stages organically.
Humans discover a feature, have an aha moment, try it for the first time, and return if it was valuable enough to warrant long-term use. In contrast, AI agents skip the first two stages entirely and start their journey at “Used” because they’re already configured by a human operator to execute specific tasks at high frequency. The tactics that move humans through the funnel (such as contextual onboarding, in-app messaging, or re-engagement emails) don’t apply to agents at all. Driving agentic adoption means targeting the human operator rather than the agent itself.
My goal with this guide is to provide improvement tactics for each of the four human adoption funnel stages and introduce you to the agentic adoption funnel (the AI agent counterpart) with interventions at every stage.

What are the stages of the adoption funnel?
The feature adoption funnel consists of four distinct stages. To raise feature adoption rates, you need to optimize the experience throughout all of them (not just the stage where you’re seeing the most drop-off).
Stage 1: Exposed
Before users can adopt a feature, they first need to be exposed to it. In fact, most users will need multiple exposures before they decide to try it for themselves. Feature blindness is more common than most product owners expect with users navigating to the same screens, following the same paths, and routinely missing features sitting right in the UI. If feature blindness goes unaddressed, you end up with a product full of neglected features and a rising churn rate among users who never found the value that was there the whole time. Track how many users have visited a feature versus how many are actively using it. That gap is your exposure problem.
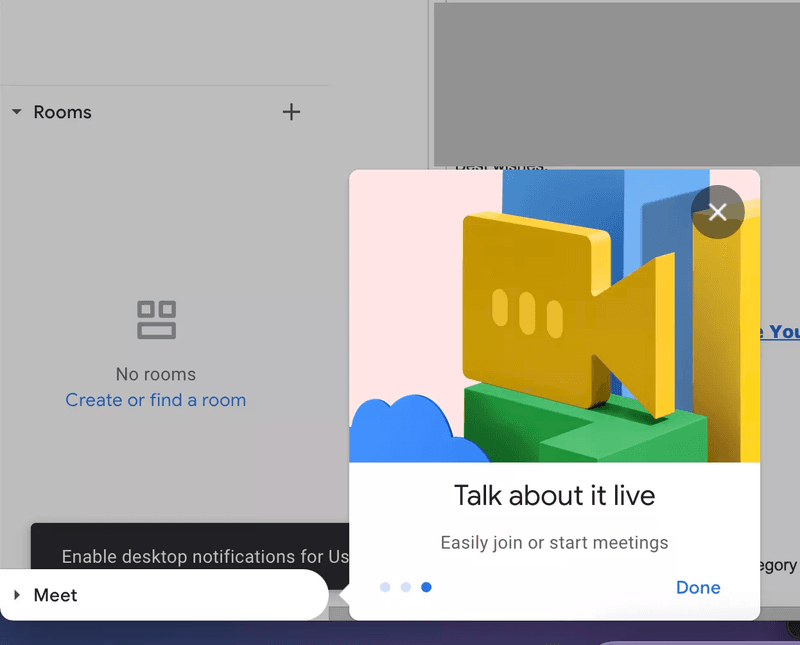
Google uses contextual callouts to expose features and lead users toward them.
How to improve adoption at the Exposed stage
The earliest in-app experiences set the tone for everything that follows. A strong onboarding process combines education and engagement so newcomers absorb key information without getting lost in a product tour they didn’t ask for. Segment users and opt for contextual onboarding instead of boilerplate walkthroughs. Product managers who signed up for your tool don’t need to see features built for engineers.
- Use onboarding checklists, progress bars, and gamification elements to push users toward active exploration rather than passive browsing.
- Follow onboarding UX best practices by using hotspots to draw attention to underused features without interrupting the user’s current task.
- Create a landing page or in-app destination for new features to make traffic tracking easier and allow split-testing of copy and positioning.
- Track the ratio of users who visit a feature page to users who actually use it to reveal whether your problem is discoverability or something deeper.
Stage 2: Activated
The Activated stage measures the percentage of users who have had their ‘Aha!’ moment, the point where they recognize the feature’s value for themselves. Track the time between exposure and activation to see how long it takes before users understand what they’ve discovered. If the gap is too long then the value proposition probably needs to be made clearer (not just louder).
Pay attention to how many times a user was exposed to a feature before they reached activation. Some features can deliver value with a single use while others require multiple interactions to become genuinely useful to your customers, so prioritize which ones are in most need of activation and repeated usage.
How to improve adoption at the Activated stage
The first interaction a user has with a feature determines whether they want to continue using it. Quick wins are the mechanism that converts an exposed user into an activated one. When users reach a meaningful result fast, they understand the value without having to be told it. Think back to why the user signed up in the first place, and design the activation moment around that specific outcome.
When we shipped Userpilot’s email feature, our own funnel showed a sharp drop-off at domain verification. Rather than queue an engineering ticket, I built a targeting tooltip and checklist directly inside Userpilot in a few hours to highlight the correct steps clearly. The drop-off closed within days, with no dev involvement required.
- Reduce time to value by stripping everything non-essential from the path to the first meaningful outcome.
- Check whether drop-off between exposure and activation is caused by unclear value, unexpected friction, or mismatched user expectations.
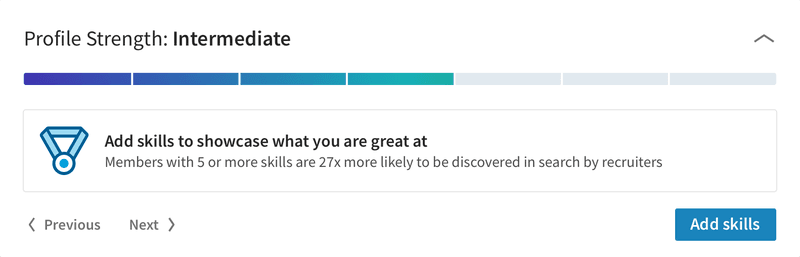
- Use progress indicators (like LinkedIn’s profile completion bar below) to give users an immediate sense of accomplishment and pull them toward the next step.
Stage 3: Used
The Used stage measures the percentage of users who have used a feature for the first time. Comparing the usage rate to the activation rate can help you spot value gaps, where the feature didn’t meet expectations the user formed during activation. Alternatively, the problem may not be a lack of value but a lack of usability: features that are too difficult to use should either be simplified or better explained through customer enablement.
The best way to track activity in the Used stage is to segment users and set up event tracking on your analytics software. Run quarterly or annual feature audits to gauge feature discoverability across the board.
How to improve adoption at the Used stage
Even products with a high activation rate won’t convert if users don’t make it from activation into actual use. Activated users already understand what’s on offer, and the only thing standing between that understanding and a higher usage rate is how much encouragement they get to start. In-app messaging (like modals, tooltips, welcome screens, and microvideos) is the most contextual way to prompt first use.
- Focus reminders on new features (to collect feedback early) and on high-value core features that drive retention instead of spamming users about every single feature.
- Keep in-app reminders subtle and contextually triggered, as contextual modals can be helpful whereas a modal that appears after every login is annoying.
- Use personalized messaging based on user role and behavior rather than sending the same prompts to your entire user base en masse.
Stage 4: Used again
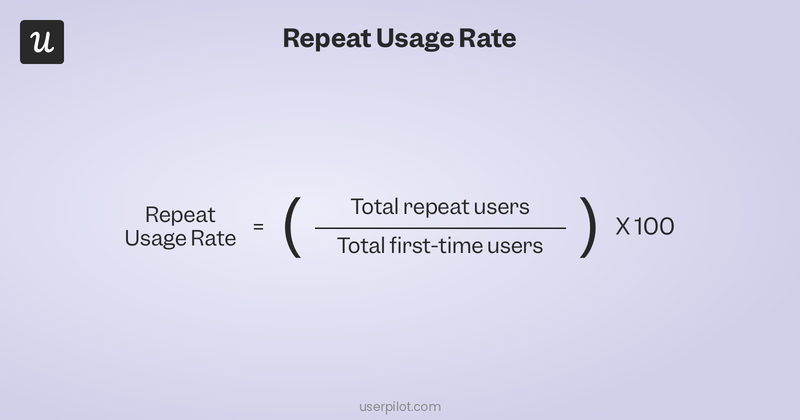
The Used stage only tracks the total number of users who have used a feature once but it doesn’t tell you how many of those users come back and actually adopt it into their workflow. That’s where “Used again” comes in to measure repeat usage and provides the clearest signal of whether a feature has enduring value for users.
A sharp drop-off between Used and Used again often means users expected more value than the feature delivered. When you see that pattern, update the feature and use a feature announcement to broadcast the changes. Be sure to frame the update as a direct response to user feedback. Again, not all features need to be used repeatedly as some can provide their full value in a single use (meaning it’s fine for those to stay at the Used stage).
How to improve adoption at the Used again stage
If users fade out after their first use, the first priority is figuring out why. Behavioral analytics usually point to the answer before you need to ask anyone. Look for patterns in the data: what did users do immediately before they went inactive? Where exactly in the feature flow did engagement stop?
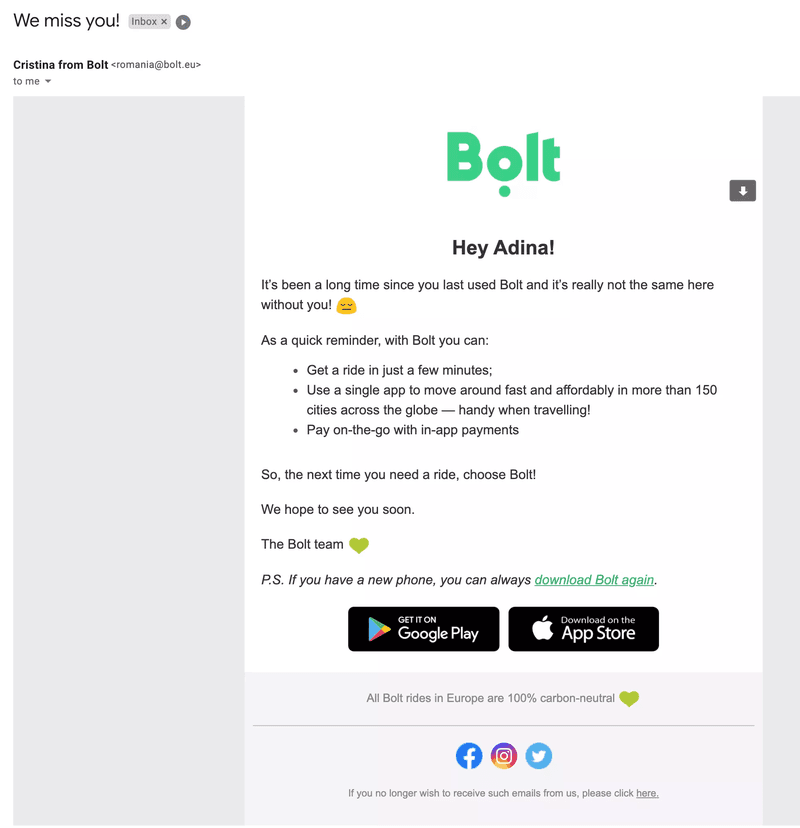
- Identify behavioral drop-off patterns with product analytics and then craft a personalized message addressing the reason they abandoned the feature (instead of a generic “we miss you” message).
- Announce updates made in response to drop-off feedback and frame it as a change driven by user feedback (encouraging users to return when they see the product team is actively listening).
- Ask for customer feedback from users who return to find out what made them come back (to tell you what’s working and help you double down).
- Use re-engagement emails to reach dormant users (as they likely won’t see in-app notifications if they’ve already stopped opening the product).
A note on agentic users in the adoption funnel
AI agents skip Exposed and Activated entirely. They’re configured by a human operator to use specific features directly, so feature discovery and the aha moment are the operator’s experience, not the agent’s. Agent activity appears almost exclusively at the Used and Used again stages, at high frequency and consistent volume. Teams that don’t separate agent events from human events will see inflated numbers at the bottom two funnel stages that don’t reflect genuine human adoption health. For how to measure adoption separately for both populations, see How to Measure Product Adoption in 2026 and Feature Adoption in 2026.
What are the stages of the agentic adoption funnel?
The tactics that drive human adoption (contextual onboarding, gamification, in-app messaging, re-engagement emails) have no effect on AI agents, which don’t respond to tooltips and can’t be reached by a re-engagement campaign. Driving adoption through the agentic funnel means targeting the human operator who configures the agent, not the agent itself. The structural difference is straightforward: humans enter the funnel at Exposed because discovery is organic. Agents are configured by operators who already know which features they want the agent to use, so the agentic funnel starts at configuration.
The four agentic stages (Configured, Executed, Completed, Repeated consistently) mirror the human stages but describe a completely different path.
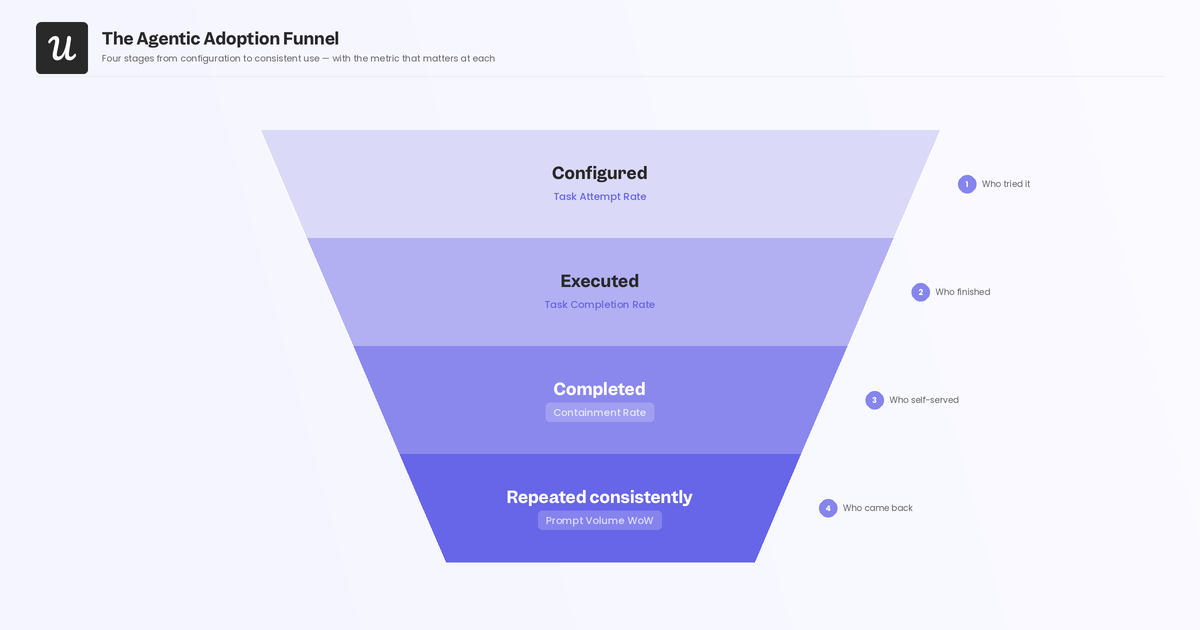
Stage 1: Configured
The agentic equivalent of Exposed is Configured, the point at which a human operator sets up an agent to use a specific feature. Agents are configured by operators reading documentation, not by browsing your UI. The only path to agentic exposure is through developer docs, integration guides, and API references that accurately describe what tasks the feature can complete and how to configure the agent to use it. Gaps or inaccuracies in documentation are the agentic equivalent of feature blindness. If the operator can’t find clear, reliable guidance for configuring a feature, the feature effectively doesn’t exist for their agent.
The primary metric at this stage is task attempt rate. If agents aren’t attempting a feature at all, the operator never configured them to use it, which almost always points to a documentation problem.
How to drive adoption at the Configured stage
Unlike human onboarding, you can’t nudge an operator through configuration with a tooltip or a modal.
Your leverage at this stage lies entirely in the quality, completeness, accuracy, and discoverability of your documentation:
- Audit your developer docs for gaps. Are all feature capabilities listed? Are the configuration steps accurate and in the right order? Do they include real examples of agent task definitions, not just abstract descriptions?
- Treat integration guides as core products, not afterthoughts. If an operator has to read three pages of unrelated docs to find the configuration snippet they need, the task attempt rate for that feature will reflect it.
- Track task attempt rate by feature and use zero-attempt features as a signal that documentation is either missing or buried rather than assuming that operators simply lack interest.
- For features with complex configuration, consider building an operator-facing onboarding flow that’s targeted at the human behind the scenes rather than the agent itself.
Stage 2: Executed
The agentic equivalent of Activated is Executed, the point at which the agent successfully completes its configured task for the first time. An agent that attempts a task but fails to complete it hasn’t activated. Low execution rates signal API friction, unpredictable response formats, or insufficient error handling: technical accessibility problems that no amount of in-app guidance will fix. The primary metric at this stage is task completion rate: specifically, the ratio of task attempts to successful completions.
A high attempt rate paired with a low completion rate is a clear signal that the feature works for humans but breaks for agents, usually because the API responses aren’t structured predictably enough for an agent to parse.
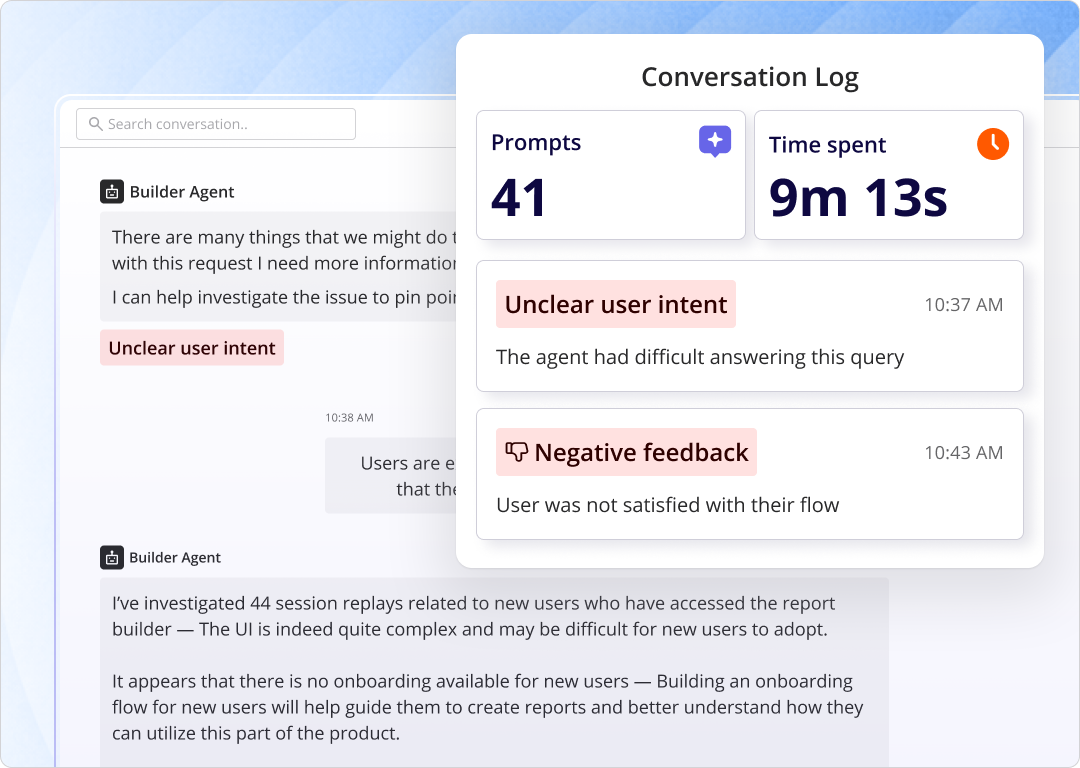
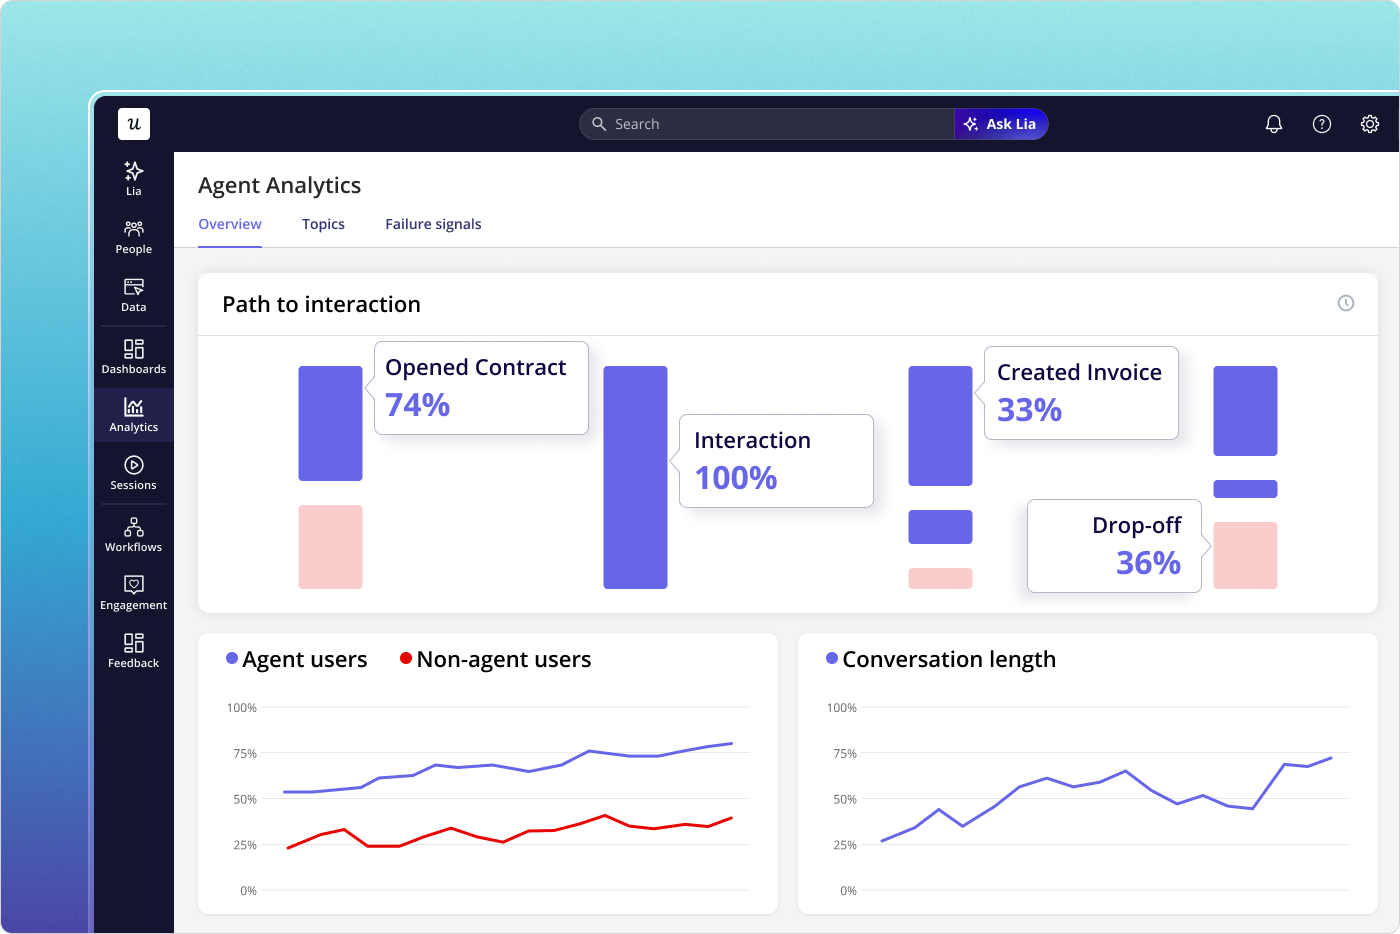
Userpilot’s Agent Analytics surfaces failure signals at the feature level, the fastest way to identify where agentic execution is breaking down.
How to drive adoption at the Executed stage
Improving agentic execution rate is a product engineering problem rather than a communication problem (and the interventions live at the API layer, not in onboarding flows):
- Audit features with low task completion ratios for consistent, predictable response schemas. Agents fail when responses vary unpredictably in structure or contain unexpected fields.
- Review authentication flows. Brittle authentication is one of the most common causes of agentic execution failure and is hard to spot because humans use OAuth screens that agents can’t navigate.
- Improve error handling to return actionable error messages when agent tasks fail rather than generic HTTP errors. An agent that receives a specific error message can retry intelligently instead of giving up.
- Test features explicitly with agent call patterns (not just human interaction patterns) since agents call APIs in high-frequency bursts that reveal the rate limit and timeout issues that human testers typically miss.
Stage 3: Completed
Once an agent is executing tasks reliably, the operator needs visibility into whether those tasks are completing successfully end-to-end. Task completion rate is the primary signal, and making it visible to the human operator creates the vicarious aha moment that justifies continued agentic investment in the feature. Without that visibility, operators are flying blind, and features that are working well get deprioritized or replaced because no one can see the results they’re producing. The primary metric at this stage is containment rate, which is the percentage of agent-executed tasks that complete without requiring human escalation or manual intervention.
A low containment rate means the feature is producing outputs that humans have to fix, eroding operator confidence and signaling that the feature isn’t yet reliable enough for full agentic delegation.
Userpilot Agent Analytics gives operators visibility into the usage of both agent and non-agent users.
How to drive adoption at the Completed stage
Operators can’t develop confidence in a feature they can’t see results from. The interventions at this stage are about making agentic task performance visible to the humans who control the configuration.
- Surface task completion dashboards to operators proactively; don’t require them to go looking for success metrics. If the dashboard isn’t in the operator’s default view, it might as well not exist.
- Distinguish between task completion rate (did the task finish?) and containment rate (did it finish without human escalation?). The containment rate is the leading indicator of whether operators expand agentic scope.
- When the containment rate is low, treat it as a product reliability issue. Communicate the fix to operators directly, following the same principle as broadcasting a feature update to human users after fixing a pain point.
Stage 4: Repeated consistently
Whether an agent repeats a task next week depends entirely on whether its operator maintains or expands the configured scope, not on any re-engagement campaign. Declining prompt volume week-over-week is the primary signal that an operator is pulling back, and it almost always reflects a reliability or performance issue at the feature level, not a communication gap. An operator who reduces an agent’s scope isn’t waiting to be re-engaged with a win-back email; they’ve lost confidence in the feature’s output quality. The second metric to watch here is containment rate, which appears again at this stage as a leading indicator of volume decline.
High escalation rates erode operator confidence over time, and that erosion precedes volume decline. The pattern is consistent: containment rate drops, then prompt volume follows a few weeks later.
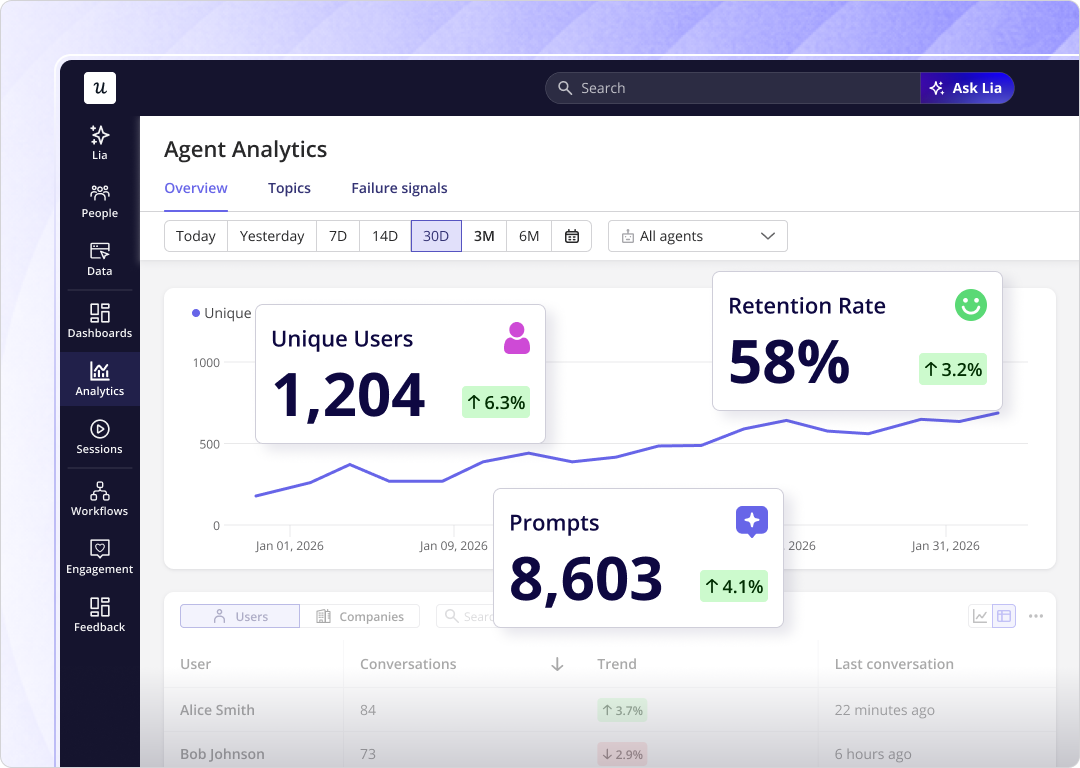
Userpilot’s Agent Analytics help here too by telling you whether operators are expanding or pulling back agentic scope (the clearest signal of agentic retention health).
How to drive adoption at the Repeated consistently stage
Maintaining repeat agentic use means maintaining feature reliability and keeping operators informed about the results their agents are producing. Neither goal is achieved through messaging or marketing; both require product-layer action.
- Monitor prompt volume trends by feature on a weekly basis. A week-over-week decline of more than 15-20% is a lagging signal, so look back at containment rate data from the same period to find the root cause.
- When you fix a performance or reliability issue, communicate it to operators as a changelog update, not a generic “we’ve made improvements” announcement.
- Surface feature adoption data for agentic tasks in operator-facing dashboards so operators can see which of their agents’ tasks are most valuable and make informed decisions about where to expand scope.
- Build escalation rate trends into the operator’s default reporting view. Operators who can see that the containment rate is improving are far more likely to expand agentic scope.
Conclusion
The four stages of the feature adoption funnel (Exposed, Activated, Used, Used again), the five metrics for tracking human adoption health, and the four stage-specific improvement tactics form the human-side playbook. It works, and in 2026 it remains the right model for the human users in your product. The agentic funnel (Configured, Executed, Completed, Repeated consistently) and its operator-focused interventions cover the other half of the picture. Both populations now require deliberate measurement and deliberate strategy, and treating agent events as equivalent to human events produces adoption metrics that don’t reflect the reality of either group.
If you want to see how Userpilot can help you track and optimize adoption across both human users and AI agents, get a free demo.
About the author