7 Ways Real Customers Leverage Userpilot Analytics for Success


Do you juggle endless data but still miss the precise insights to fuel better decisions?
That’s where Userpilot analytics comes in: turning raw user behavior into actionable takeaways you can implement immediately.
In this article, we’ll look at seven real-world examples of product teams using Userpilot’s dashboards, trend analysis, and other analytics features to pinpoint user drop-offs, reveal high-performing features, and refine the customer journey.
Let’s explore these stories and see what you can apply right away.
7 Real-world ways customers are using Userpilot analytics
From tracking user paths to measuring the success of a product redesign, here are several ways actionable data can transform your product strategy.
1. Monitor the paths taken by users within the app
Userpilot’s path analysis reveals precisely how users navigate your product. Using this data, you can compare successful and unsuccessful journeys and leverage these insights to push more users down the journey.
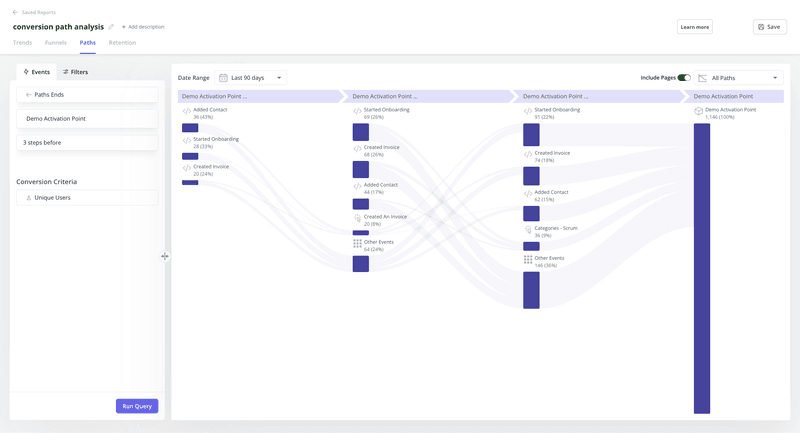
When she was conducting a path analysis, Leyre Iniguez, the Customer Experience Lead at Cuvama (an ex-Pendo customer), uncovered a critical error that some customers faced.
She saw the segment of affected users in the paths report, accessed their profiles, and reached out to them directly to resolve the issues.
This approach gave her team real-time insights into user behavior, allowing them to act swiftly without developer assistance. As a result, Cuvama boosted product usage and got more value from analytics than they did with Pendo.
2. Gauge the performance of a product redesign
Userpilot’s analytics dashboards highlight key metrics crucial to companies’ success. From the product usage dashboard to the retention dashboard, each provides a bird’ s-eye view of performance.
Taiwan-based e-commerce platform CYBERBIZ used the insights from the product usage dashboard while revamping its admin panel, focusing on reducing session length in key areas.
I will select different pages to see the average session duration because for some features, like the order manager, we want to reduce the session duration. We want to know if the redesign will help the users achieve their jobs more quickly.
– Wei-Di Huang, Senior Product Manager at CYBERBIZ
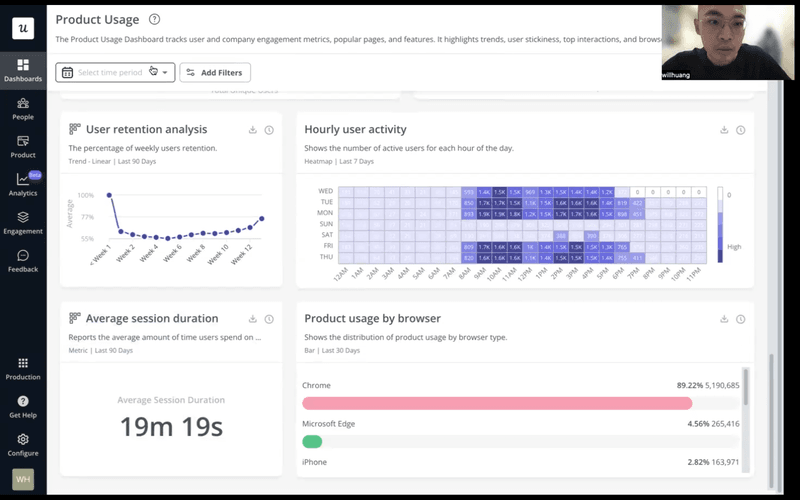
By making decisions based on real-time data, CYBERBIZ prioritized areas with the greatest impact. This approach led to higher feature usage, fewer support tickets, and greater confidence in the redesign.
3. Prioritize product development based on page engagement
Userpilot’s Pages feature lets you view the performance of all your app’s pages by tracking key metrics like total page views and average views per user. These insights help you:
- Spot when page engagement increases or decreases.
- Understand users interactions with pages in your product.
- Trigger content to show users based on how much time they spend on your pages.
Zoezi—an all-in-one platform for gyms, yoga studios, and wellness centers—tried to understand broader user behavior. After adopting Userpilot’s Pages feature, the Zoezi team could see which pages users engaged with most.
We were in a pretty bad state before Userpilot because we didn’t even know what pages people visited. Now we can just look at the Pages tab and understand that people don’t use this stuff, so let’s not focus on that.
– Isa Olsson, UX Researcher and Designer at Zoezi
Zoezi used these insights to optimize its product development roadmap and allocate resources to features customers used. This data-driven approach helped them deliver greater value and avoid guesswork about which areas needed attention.
![]()
Supercharge Your User Engagement Advanced Analytics Today!

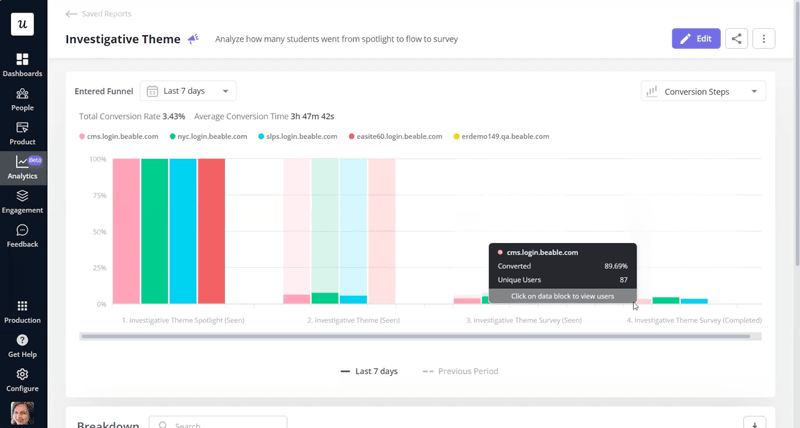
4. Track conversions across key customer funnels
Userpilot’s funnel analysis helps you to track users’ conversation rates throughout different funnel stages.
Beable Education, an e-learning platform for K-12 students, used this feature to overcome its challenge of better visibility into how users interact with its content.
How?
They used funnel analysis to track crucial steps—from when a student clicked on a spotlight to when they completed a survey—and saw precisely where drop-offs occurred. This helped them take timely action to ensure student engagement remained high.
5. Measure the success (and failure) of different features
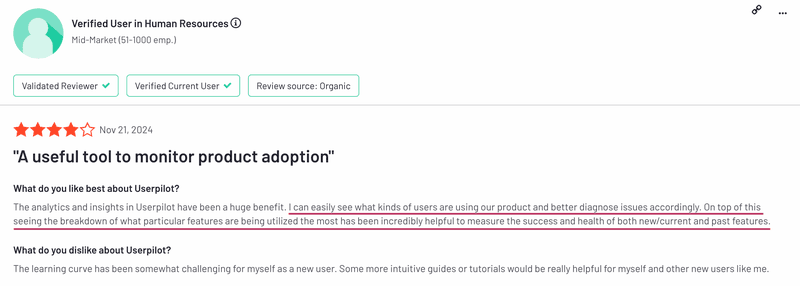
Customers use Userpilot analytics to monitor which of their product’s features attract the most attention.
The analytics and insights in Userpilot have been a huge benefit. I can easily see what kinds of users are using our product and better diagnose issues accordingly. On top of this, seeing the breakdown of what particular features are being utilized the most has been incredibely helpful to measure the success and health of both new/current and past features.
– G2 Reviewer
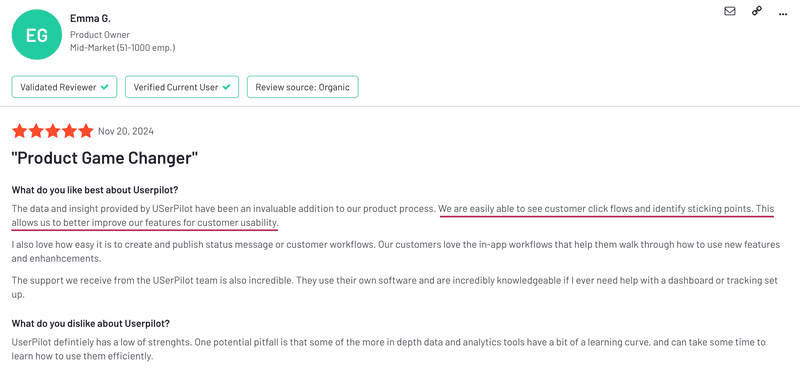
Another customer said:
We are easily able to see customer click flows and identify sticking points. This allows us to better improve our features for customer usability.
– G2 Reviewer
So how are these customers tracking the success and failure of their features? Here’s how:
- Userpilot’s cohort retention analysis shows which features keep users coming back. Blending insights from cohort analysis gives you a clear view of what resonates or falls flat so you can invest resources wisely.
- Trend analysis shows the engagement trend of features over a period of time. Those continuously on a declining trend might need to be studied for bottlenecks or even sunsetted.
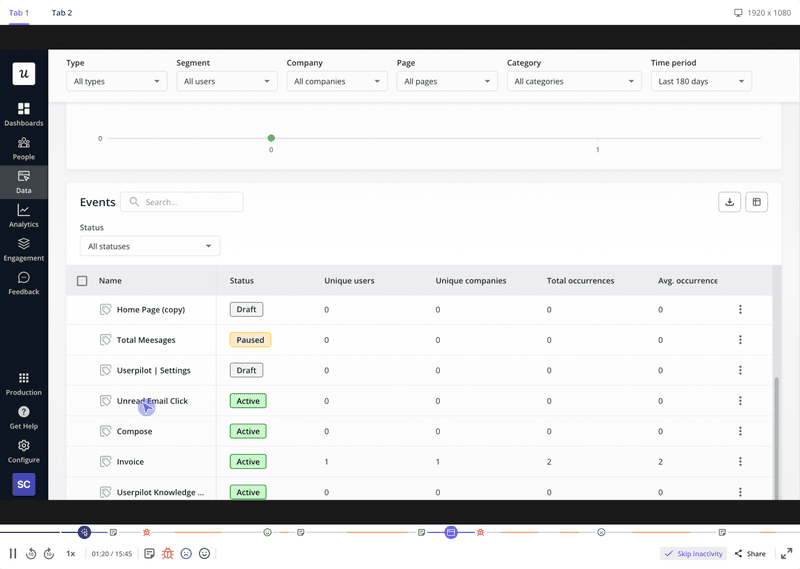
- The events dashboard highlights the top 20 events within a selected time frame, helping you identify the most frequently used features. You can monitor interaction volume for specific features or define custom events to track multiple elements collectively.
- Userpilot’s core feature engagement dashboard shows at a glance key metrics of your main feature, like adoption rate, average usage per user, weekly retention, and more.
6. Optimize the performance of resource centers
Userpilot’s resource center lets you track how often and effectively users access help content, so you can optimize your self-service support.
Beable leveraged this feature to see which modules teachers, administrators, and students engaged with most. By reviewing real-time data, the team could pinpoint resources that weren’t being used and rework them for clarity.
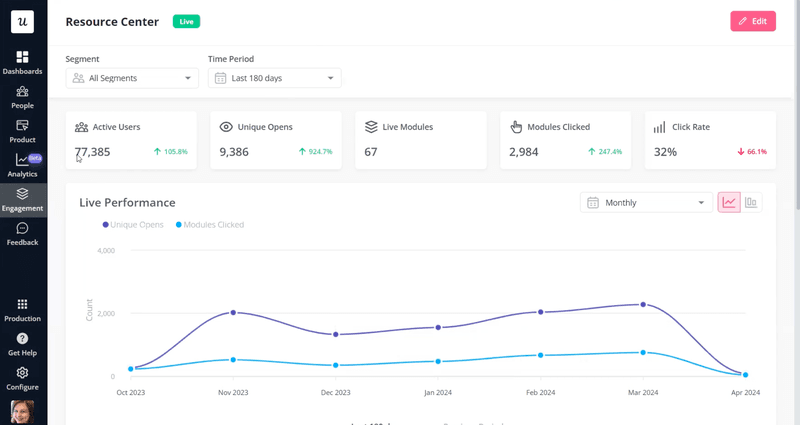
This analytics-driven approach helped reduce support tickets and boosted user satisfaction across Beable’s different personas. Instead of speculating which tutorials were helpful, they used hard metrics to guide iterative improvements.
7. Track customer preferences and sentiment
Beable used Userpilot’s survey analytics to gather precise insights into user preferences. They created a preference testing survey for teachers to pick their preferred design for their redesign project.
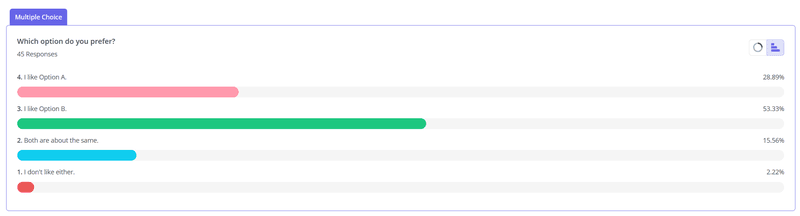
We are using surveys to ask users about possible redesigns of pages. We started a survey on March 26 and to date (April 4, 2024), it’s been shown to 852 users and 41 users have completed it. This is informing our product development roadmap and process.
– Ann Marie McNamara, Senior Product Manager at Beable
Monitoring real-time survey performance helped Beable to quickly identify which design resonated the most with teachers. This validation saved them from a possible redesign failure in the future.
Additional ways to leverage Userpilot’s analytics features
Here are more ways to take advantage of Userpilot analytics. These additional features will help you dig deeper into user data and drive product growth.
Get detailed insights into user behavior with session replay
Userpilot offers a session recording feature that lets you watch real user interactions in your product to identify friction points, spot bugs, and see how users navigate each page.
For instance, if you notice a particular page has a high drop-off rate, you can filter recordings to watch only sessions from users who visited that page.
You can use session replays to understand your users better and faster by:
- Selecting advanced filters to segment recordings.
- Creating playlists to save your filters for quick access.
- Skipping inactivity to dive into the moments that matter most.
- Collaborating to tag teammates, add notes, or flag bugs with one click.
To safeguard user privacy, all sensitive data, including passwords, is masked. With Userpilot’s compliance with HIPAA, GDPR, and SOC 2 Type II, you can trust that robust security measures are in place.
Identify common behavior patterns in user segments
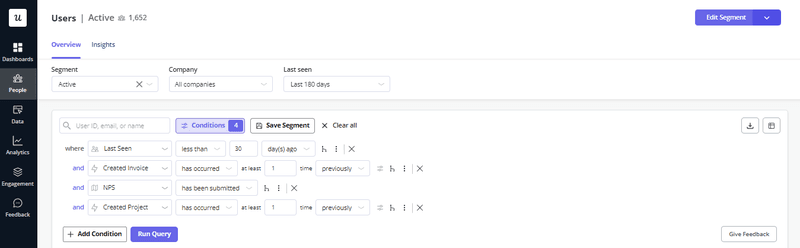
Segmenting your users makes it easier to spot patterns, tackle the most frequent issues a certain group faces, and create personalized experiences.
Userpilot analytics supports several kinds of user segmentation, these are:
- Segmentation based on user actions, usage patterns, or purchasing behavior.
- Segmentation based on country, language, etc.
- Segmentation based on company attributes like stage, location, employee count, etc.
- Segmentation based on device type and operating system.
- Segmentation based on customer feedback and content engagement.
Combine these segments with other analytics features, like session replay, funnel analysis, etc., to see how different user groups behave.
Monitor the performance of in-app messages
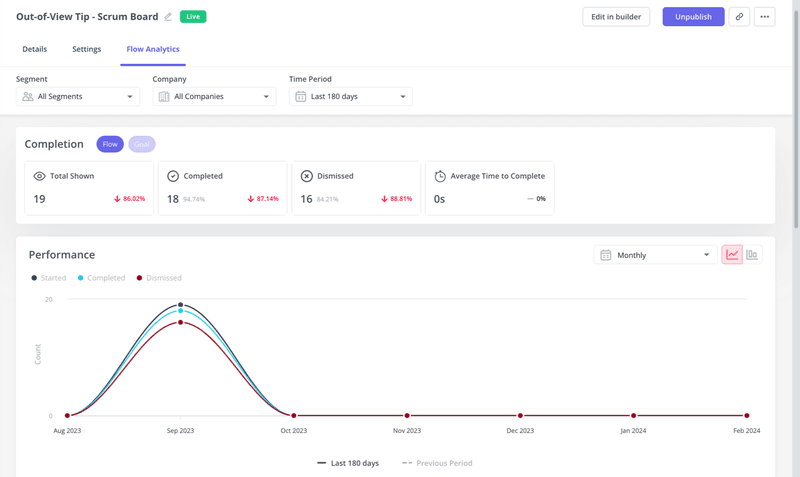
Userpilot’s flow analytics help you pinpoint which in-app messages (like pop-up modals, tooltips, checklists, etc.) perform well and poorly. You’re able to track key metrics like completion percentage, dismissal percentage, and average time to complete.
Tracking the performance of all in-app messages reveals valuable insights into the kind of content users prefer and those they can’t be bothered with.
Supercharge your product growth with Userpilot
Userpilot is an all-in-one product growth tool that is as powerful, if not more, than standalone analytics tools. The advanced analytics functionality gives you deep insights into user behavior, and the engagement features let you act on these insights.
Book a demo today to see our product in action.
![]()
Supercharge Your Product Growth with Advanced Analytics Today!
About the author