Cancellation Flow Examples in 2026: What They Recover and What They Miss


As the Head of Customer Success at Userpilot, I find that an effective cancellation flow recovers 10–34% of users who explicitly try to cancel. Churnkey puts its platform average at 34%. At $500K monthly recurring revenue with 3.5% monthly churn, that saves rate recovers about $6K a month from users who’d otherwise be gone.
Yet… 96% of unhappy customers leave without ever saying so. They stop logging in, stop completing tasks, stop getting value, and one day they notice the charge and quietly cancel, or they keep paying for something they stopped using months ago.
The cancellation flow never sees those people.
When I tell my team that if a customer is coming to you and saying they want to stop, it’s already too late, I’m not being pessimistic. The customers who reach the cancel page are the ones who cared enough to say something. The majority left weeks earlier, and no exit survey will reach them.
This post covers both problems. How to build a cancellation flow that wins at the last moment, and how to catch the churn that never announces itself. We’ll look at:
- What you’re actually losing, and where the flow fits in it.
- What the 96% look like: Silent abandonment, zombie accounts, and the signals they leave behind.
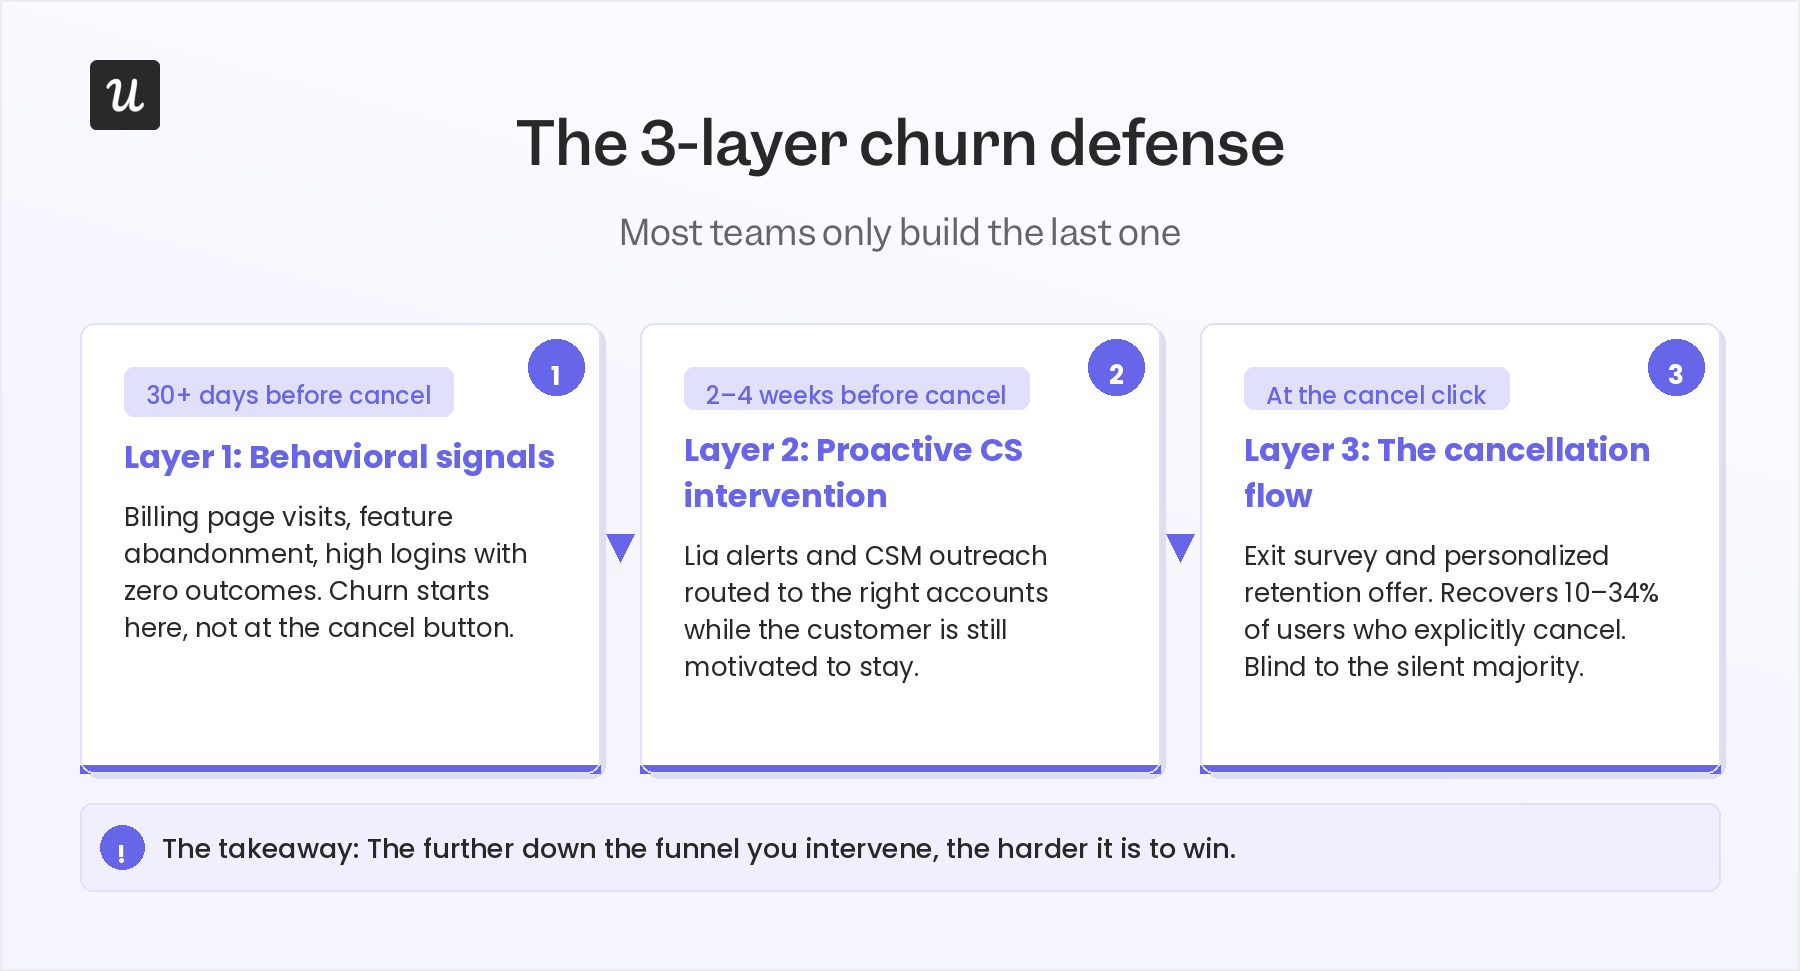
- The 3-layer churn defense: Behavioral signals, proactive CS, and the cancellation flow itself.
- Seven real cancellation flow examples and what each one can and can’t see.
- How to build one in Userpilot, step by step.
- The 2026 wrinkle: AI agents and what happens when your flow misreads an account that’s actively using the product.
Cancellation flow examples in 2026: Summary
Here are the key takeaways:
What a cancellation flow recovers
- An exit survey asking why the user is leaving, followed by a personalized retention offer responding to that reason, triggered the moment someone clicks cancel.
- Save rates of 10–34% for well-optimized flows; Churnkey’s platform average is 34%.
- Subscription businesses that enable pausing see 25% of would-be churners pause instead of cancel, generating over $200 million in re-subscription revenue industry-wide.
- The best flows personalize the offer to the survey response: A downgrade for oversized plans, a pause for “not the right time,” a discount for price sensitivity.
What it can’t see: The 3-layer problem
- Layer 1 (30+ days out): Behavioral signals. This includes billing page visits, feature abandonment, and high logins with zero outcomes. Churn starts here, not at the cancel button.
- Layer 2 (2–4 weeks out): Proactive CS. This is where to catch at-risk accounts while the customer is still motivated to fix the problem.
- Layer 3 (at the cancel click): The cancellation flow. It is only effective on whoever makes it here; blind to the ones who left.
The 2026 wrinkle
- AI agents completing work through MCP or API don’t generate session data, so “low usage” flags on agent-heavy accounts are often false positives.
- Check API and MCP activity before treating a cancellation as a low-engagement problem.

A cancellation flow is the last conversation with a user who cared enough to have one.
A subscription cancellation flow is the sequence a user goes through when they decide to leave: an exit survey asking why, followed by a retention offer responding to that reason.
The difference between a basic flow and an effective one is whether the offer actually connects to the answer. For example:
- A user leaving because of price should see a discount or a plan downgrade.
- A user leaving because they’re not using the product enough should see a pause option.
- A user leaving because a feature is missing should get routed to a CS call.
The survey triages the customer’s pain points, while the offer responds to the triage, and the pause option in particular is underused.
Subscription businesses that enable pausing see 25% of would-be churners pause instead of cancel, generating over $200 million in re-subscription revenue industry-wide. If your product supports pausing, it belongs prominently in the cancellation experience, not buried after two other choices.
On discounts: 34% of churned customers said a simple discount would have kept them, and another 34% said a lower price would have changed the outcome. Two-thirds of voluntary churn is price-related. A discount or downgrade option belongs in every flow, even when it’s not the first thing shown. The survey step tells you who needs it.
One thing worth saying plainly: a cancellation flow in 2026 is not a dark pattern, and legally it can’t be. California’s amended Automatic Renewal Law (effective July 2025) limits companies to a single retention offer during cancellation and requires a click-to-cancel option shown simultaneously. The FTC’s federal rule was vacated by an appeals court in July 2025, but state laws in California, New York, Colorado, and DC still require online cancellation when signup was online. Build to comply, not to trap.
What you’re actually losing, and where the cancellation flow fits in
At $100K MRR with 3% monthly churn, you lose roughly $30,600 in annual revenue before any new acquisition. At $500K MRR with 3.5% churn, that’s $17,500 gone every month, $210K a year.
A 34% save rate on explicit cancellations recovers a meaningful slice of that. But voluntary cancellations account for only 2.6% of the median 3.5% monthly churn rate. The remaining 0.9% is involuntary (failed payments, expired cards). And neither number captures the silent abandonment that precedes both: users who stop engaging months before they ever formally cancel.
Customer acquisition costs run 5–25x the cost of retaining an existing customer. A 1% improvement in monthly churn compounds into more long-term revenue than a 1% improvement in new customer conversion, because the retention benefit runs every month. Fixing the cancellation flow is worth doing. Fixing what happens before it is worth more.
96% Of churned users will never click your cancel button
Most churn doesn’t start with a decision to leave. It starts with users logging in less. They stop running the reports they ran weekly. They don’t submit support tickets, not because everything is fine, but because they’ve given up expecting anything to change. I watch for a specific pattern in our own accounts: intense activity on the platform, then sudden silence. When I see that, my reading is almost always the same. The customer tried, got stuck, and moved on.
These are what CS teams call zombie accounts: subscriptions active on paper, dead in practice. Research shows the average enterprise manages 371 SaaS applications, with over half of user licenses sitting unused. Those dormant seats are the highest-risk segment in any customer base. When a contract renewal arrives, there’s no relationship left to defend it.
One counterintuitive signal I flag to my team: a drop in support tickets can be more alarming than a spike. If a customer regularly submits tickets and then suddenly stops, it can look like things are fine. It often means they’ve stopped expecting anything to change.
The absence of activity is data.
The cancellation flow catches users who care enough to announce they’re leaving. It has no mechanism for those who stop without saying anything. And that’s the majority.
Most CS teams built the last layer of churn defense first
The cancellation flow is one layer of a three-layer system. Most teams only build the last one.
When I look at CS organizations across the industry, I see a maturity arc that plays out almost the same way every time. Early-stage teams operate reactively. Risk is identified by which customers are the loudest. The product equivalent of that reactive posture is the cancellation flow: waiting for the customer to announce the problem, then responding.
It works. But it only works on the customers who announce.
The 3-layer churn defense connects all three intervention moments, with each layer operating earlier than the one before it, and each one harder to recover from once it’s the only one left.
Layer 1: Behavioral signals (30+ days before the cancel click)
Silent abandonment leaves tracks before it becomes cancellation. The signals I watch for in our own accounts:
- Billing page visits: A user who logs in after a long gap and goes straight to billing is almost certainly evaluating whether to continue. Most CS leaders would know what that probably means. That’s the moment to act, not the next quarterly check-in.
- High logins, zero outcomes: Lots of activity, no progress. I caught one account this way: multiple logins, no published flows, no activated features. Seeing the gap between activity and outcomes gave us the chance to have a frank conversation with their executive sponsor before they gave up entirely.
- Feature abandonment on previously active workflows: A user who ran a specific report every week and then stopped is more diagnostic than a general session drop. When usage on a specific feature goes quiet, the customer has usually moved on from trying to use it.
- Support tickets stopping suddenly: A customer who was actively submitting tickets and then goes silent is not necessarily happy. They may have stopped expecting anything to change.
With Userpilot’s product analytics and Signals feature, you can build automated alerts for each of these patterns. A CSM gets flagged when a high-value account visits billing three times in a week, or when a previously active feature goes unused for 14 days. The signal arrives while something can still be done about it.
Layer 2: Proactive CS intervention (2-4 weeks before the cancel click)
A signal is only useful if someone acts on it before the window closes.
Churn prevention has to come from earlier intervention, working with a customer when they are still motivated to be successful with the platform. The only way to do that at scale is if you have meaningful signals telling you when a customer is likely to be engaged and when that support is going to land. Otherwise, you’re taking shots in the dark.
Something most CS playbooks leave out: positive signals matter as much as risk signals. If a customer is actively trying to engage with a specific feature, that’s the right moment to reach out, walk them through it, and make sure they’re getting everything they hoped to. Catching a customer at a good moment is a better retention conversation than catching them after they’ve already gone quiet.
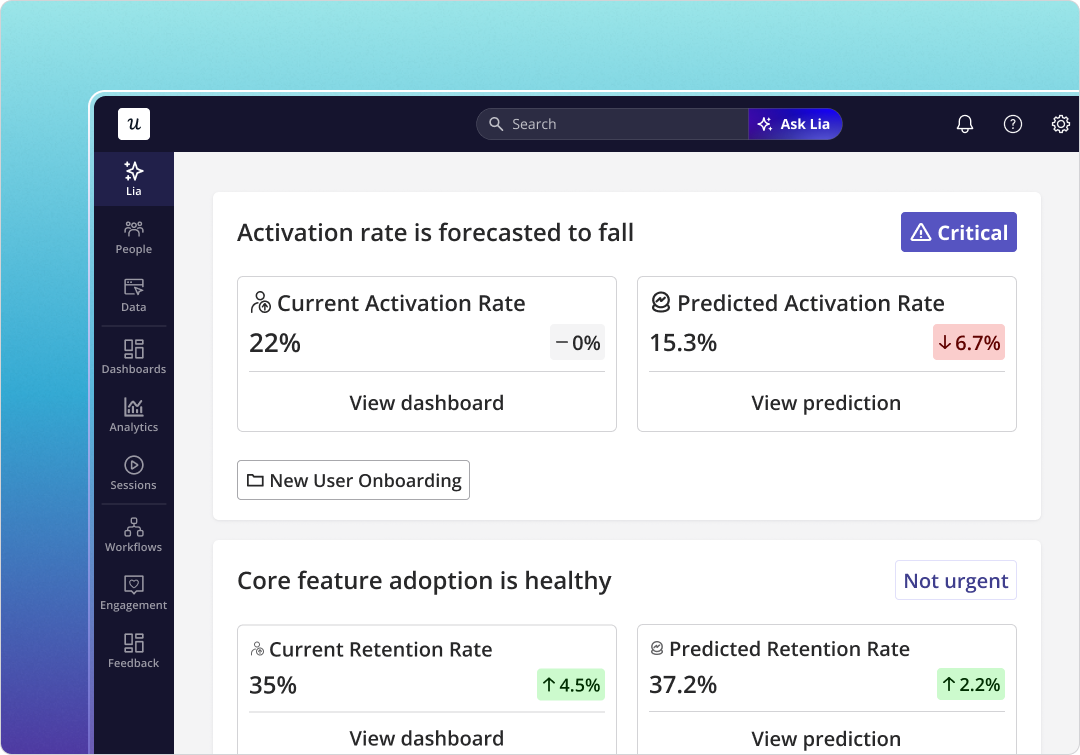
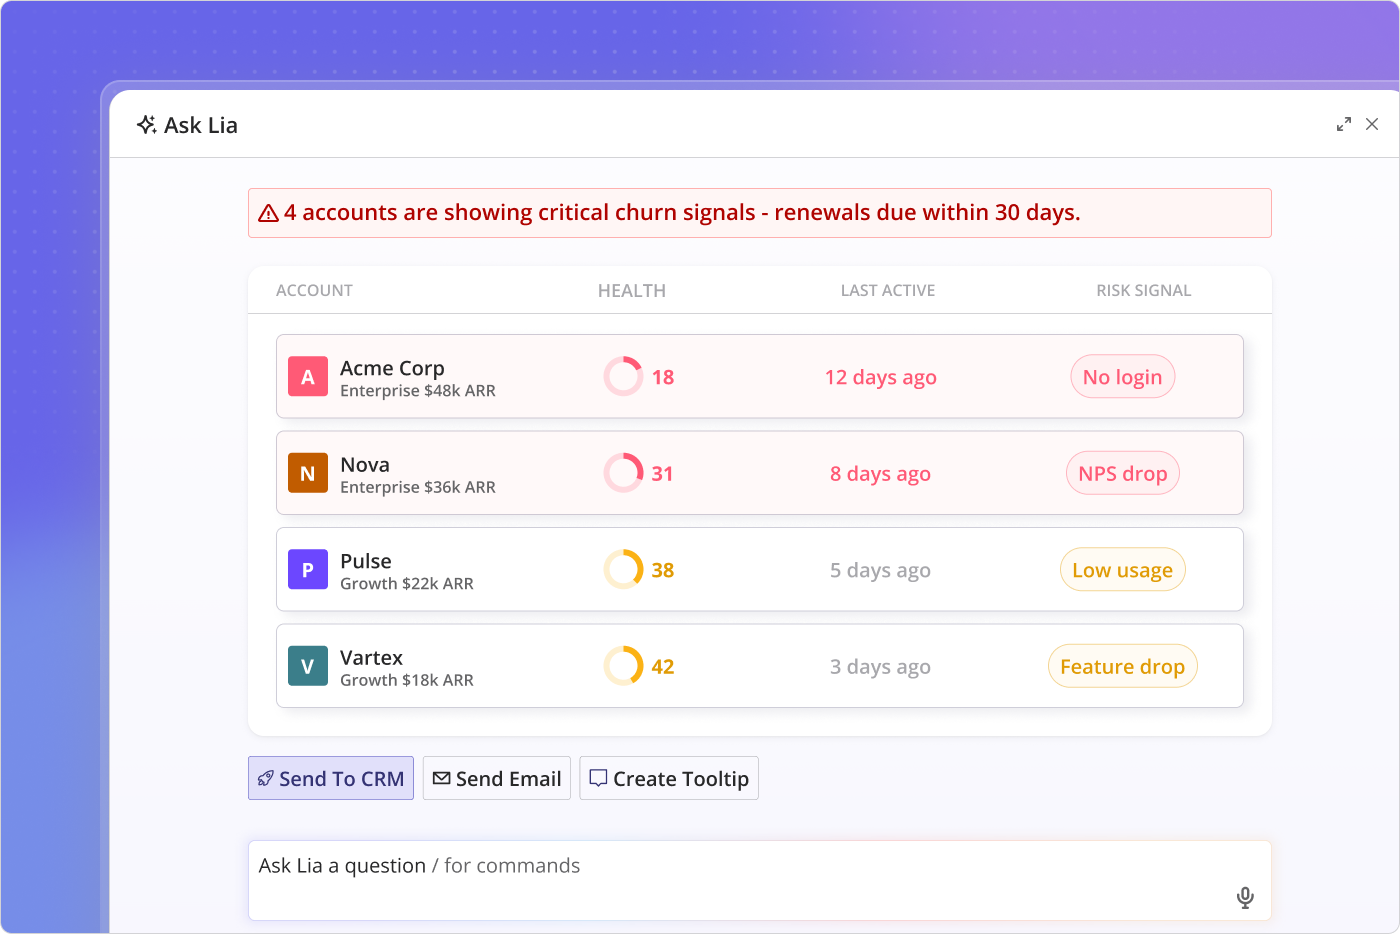
This is where Lia changes the math. Before continuous AI monitoring, a CSM responsible for 100+ accounts couldn’t systematically watch for behavioral inflection points across the whole book. They triaged by who was loudest. Lia monitors continuously and routes the accounts that need attention before they announce themselves.
Layer 3: The cancellation flow (at the cancel click)
With Layers 1 and 2 working, fewer accounts reach this point. The ones that do still deserve a flow worth their time, one that responds directly to why they’re leaving, rather than just trying to keep them at any cost.
That’s what separates the flows that work from the ones that don’t.
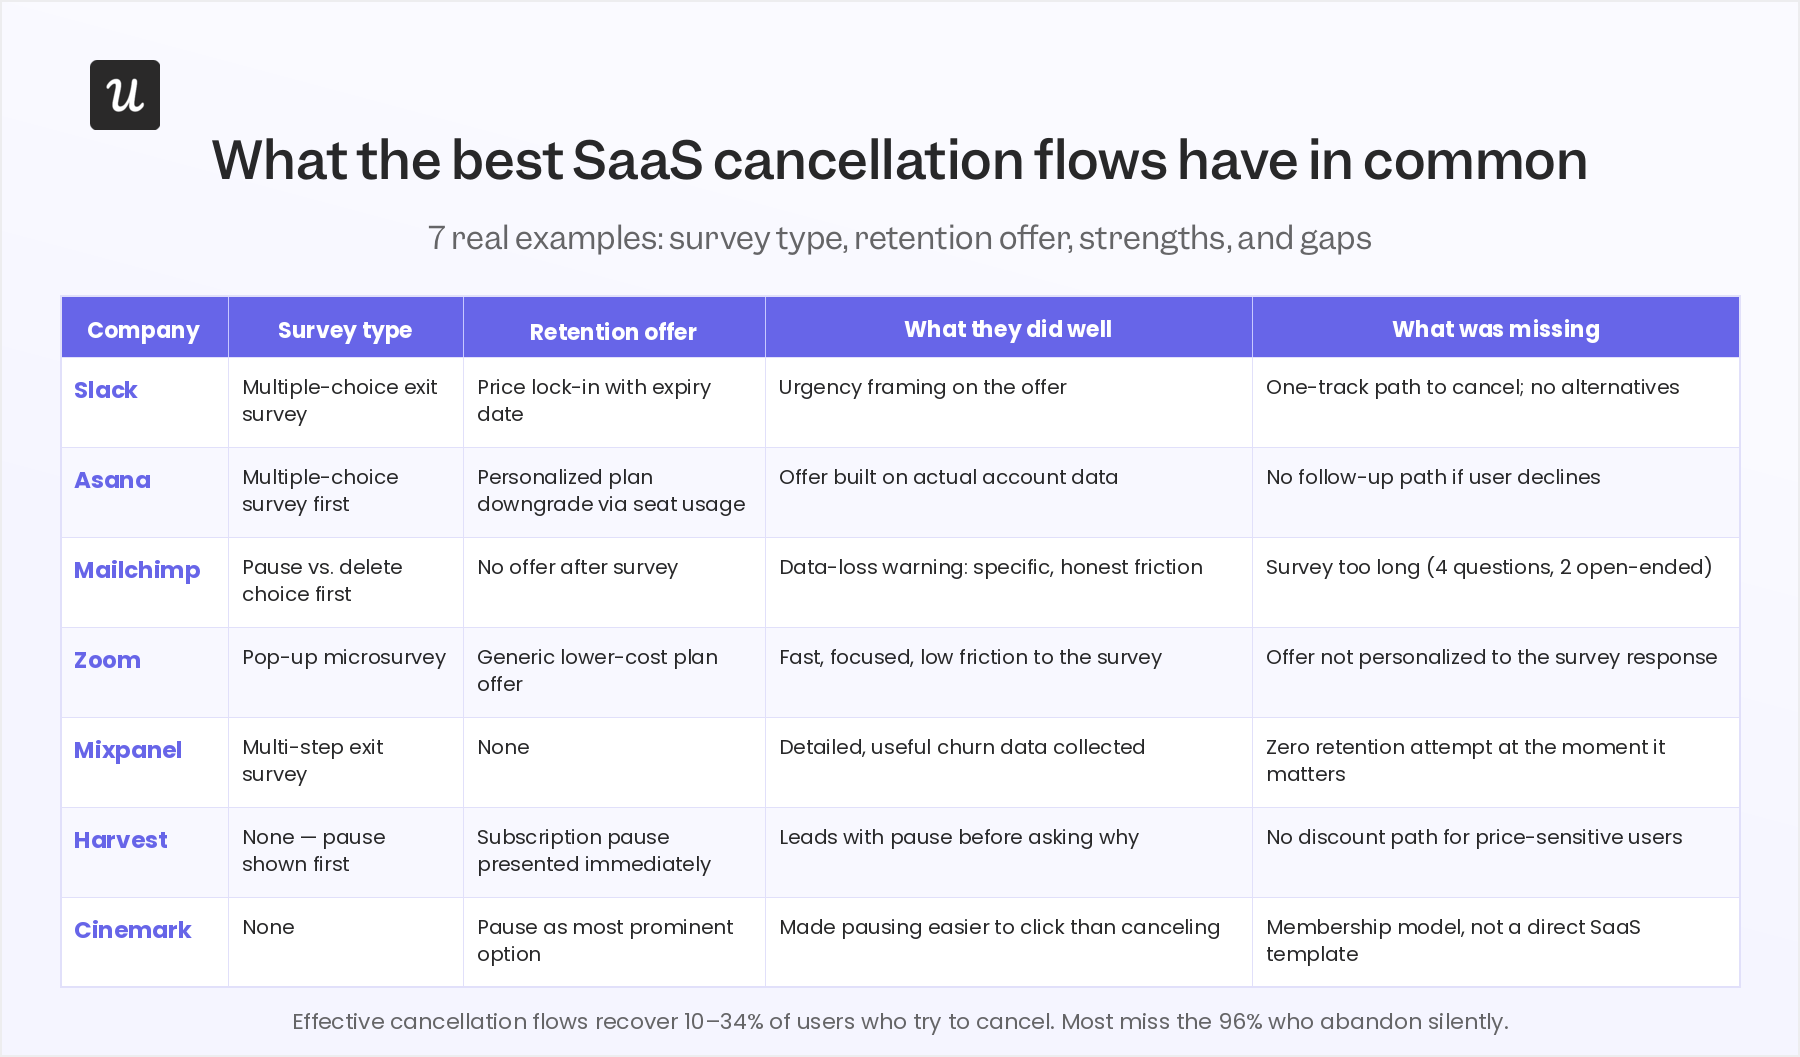
Seven flows, and what each one can see
Every cancellation flow is a window. It shows you the users who reached the cancel button. That’s the right lens for evaluating all of them: not just “what did they offer?” but “what did they know at the moment they offered it?”
A few patterns stand out across these examples to note:
- Survey before offer, always: Slack, Asana, Zoom, and Mixpanel all ask why before making a counteroffer. Mailchimp reverses this: it shows a pause-or-delete choice before asking anything. Which is why Mailchimp’s offer can’t respond to the reason. It doesn’t know the reason yet. The survey and the offer only work together if the survey comes first.
- Friction with a reason beats friction without one: Mailchimp’s warning (that annual subscribers lose their data on cancellation) is blunt, but it’s specific and true. That’s the kind of friction worth building: it gives someone a concrete reason to reconsider, not just a guilt prompt. The weakness in Mailchimp’s flow is the survey itself: four questions, including two open-ended ones. When cognitive load goes up, response rates go down. One primary question with branching follow-ups holds engagement better.
- Mixpanel collects excellent data and does nothing with it at the moment it matters: Their exit survey is detailed. The churn data they collect is real and useful. Then they let the user leave without a single retention attempt. For a product analytics company, it’s an odd gap to leave open.
- Two more examples focused specifically on the pause strategy: Harvest presents the pause option immediately when a user enters the cancellation process, before any survey question. Cinemark Movie Club went further still, making the pause the most visible choice in the entire flow, easier to select than continuing to cancel. Both reflect the same finding: when the pause is the highest-converting offer, it should not be buried. Surface it early. Users in “not the right time” situations convert on a subscription pause far more reliably when they don’t have to dig for it.
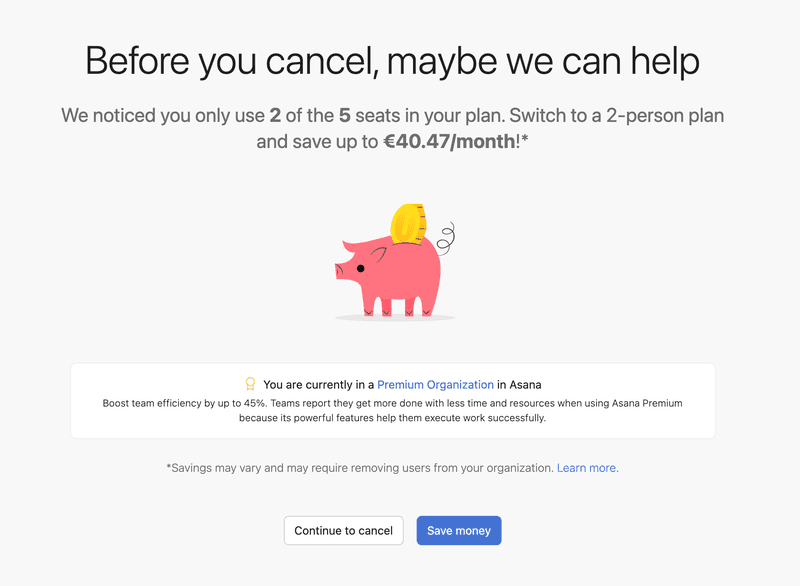
- Asana is the strongest of the five because it uses account data: Rather than a generic discount, Asana looks at how many seats the account is actually using and suggests a plan sized to match. A “you’re using 2 of your 5 seats, here’s a plan built for your actual usage” offer is structurally harder to decline than “here’s 20% off.” That’s the gap between a retention offer and a real alternative.
How to build a cancellation flow with Userpilot
Building a cancellation flow in Userpilot takes three steps. No engineering required on your end.
1. Build the exit survey
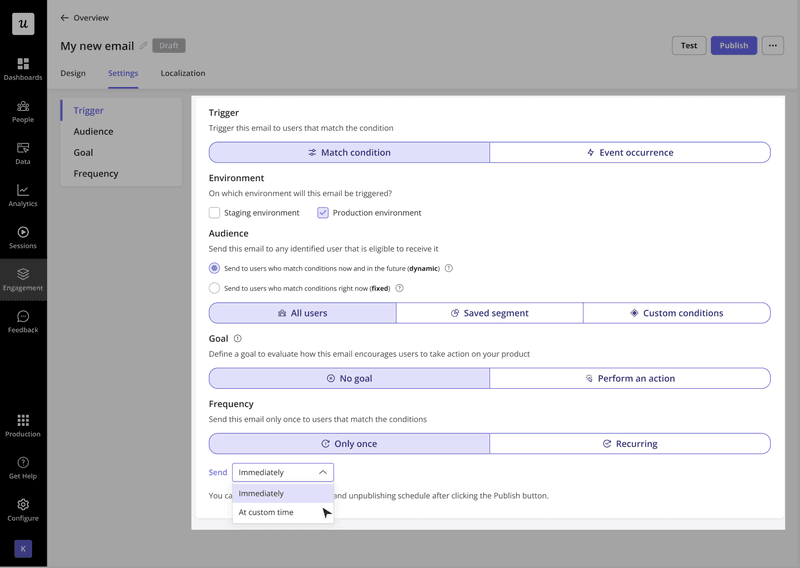
One primary question: why are you leaving? Multiple-choice options based on your most common cancellation reasons, plus an “Other” field with a text input. Add branching logic so each response routes somewhere specific: a user who selects “Too many bugs” sees a button to report the issue directly; a user who selects “Too expensive” goes to the plan comparison. The survey should feel like the beginning of a conversation, not a checkbox before the door closes.
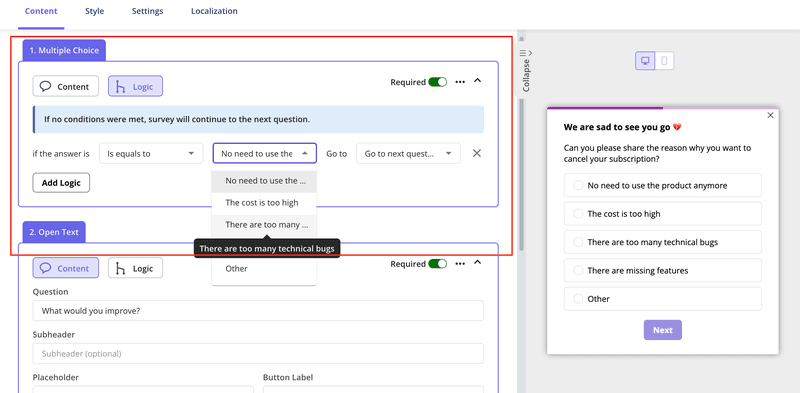
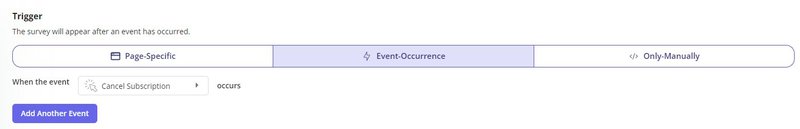
Trigger it on the click of your “cancel subscription” element using Userpilot’s event-based triggers. It appears as a focused modal, with no page load and no dead time between the user’s decision and the survey.
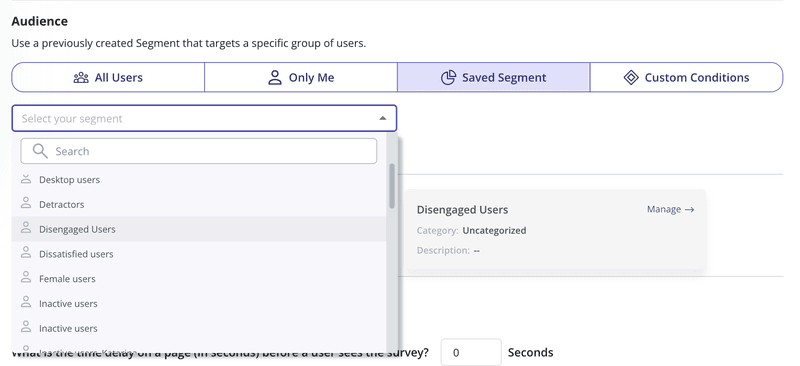
2. Create a segment for each cancellation reason
Each survey response maps to a segment. “Too expensive” goes into the price-sensitivity segment. “Missing feature” goes into the feature-gap segment. Each segment gets a different offer in the next step. This is the mechanism behind Asana’s approach: the offer is personalized because the segmentation is specific, not because they got lucky.
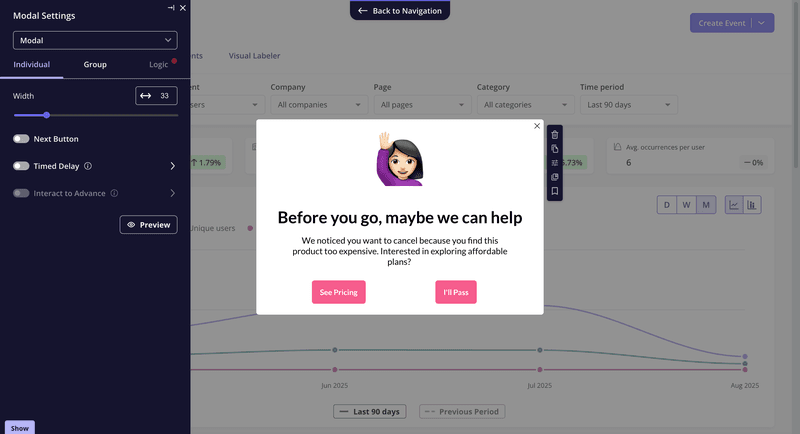
3. Set up a retention offer for each segment
Configure a modal for each segment: a discount for price-sensitive users, a pause option for “not the right time,” a plan downgrade for users on an oversized subscription, a direct CS calendar link for high-value accounts citing a feature gap. The offer follows the reason, and that’s what makes the difference between a save and a politely declined pop-up.
After a few weeks of data, pull the exit survey responses through Userpilot Analytics and look at which cancellation reasons dominate. If 30% of cancellations cite a specific bug or missing capability, that’s a product team conversation waiting to happen. The valuable feedback collected from exit surveys carries more weight when it comes with frequency data behind it, and that aggregated signal is how you use cancellation data to reduce churn on future cohorts, not just save the individual leaving today.
When AI agents make your cancellation flow diagnose the wrong problem
There’s a cancellation pattern becoming more common in 2026 that sits outside the standard playbook entirely.
AI agents (through MCP server connections, direct API calls, or headless automation tools) complete SaaS tasks without opening the product UI. An agent running a Userpilot workflow, pulling analytics via API, or triggering in-app events through an integration doesn’t generate session data. To your analytics, that account looks inactive. When it cancels citing “low usage,” the cancellation flow offers a discount and the user declines. That’s not a retention problem. It’s a measurement problem.
Jason Lemkin at SaaStr raised the related risk: prompts are portable. The instructions that configure an AI agent to use your product can be repointed at a competitor’s API in days. Switching costs that used to come from deep UI familiarity don’t apply when the user is a system prompt.
Two things to add for agent-heavy accounts:
- Check API and MCP activity before treating a cancellation as low-usage churn: If session data is low but API call volume is high, the product is being used. The conversation starts from a different place.
- Track task-completion events, not just UI interactions: If your product’s core value is a completed outcome (a flow published, a report generated, an experiment launched), that’s what should be tracked. Userpilot’s Agent Analytics is built to capture exactly this.
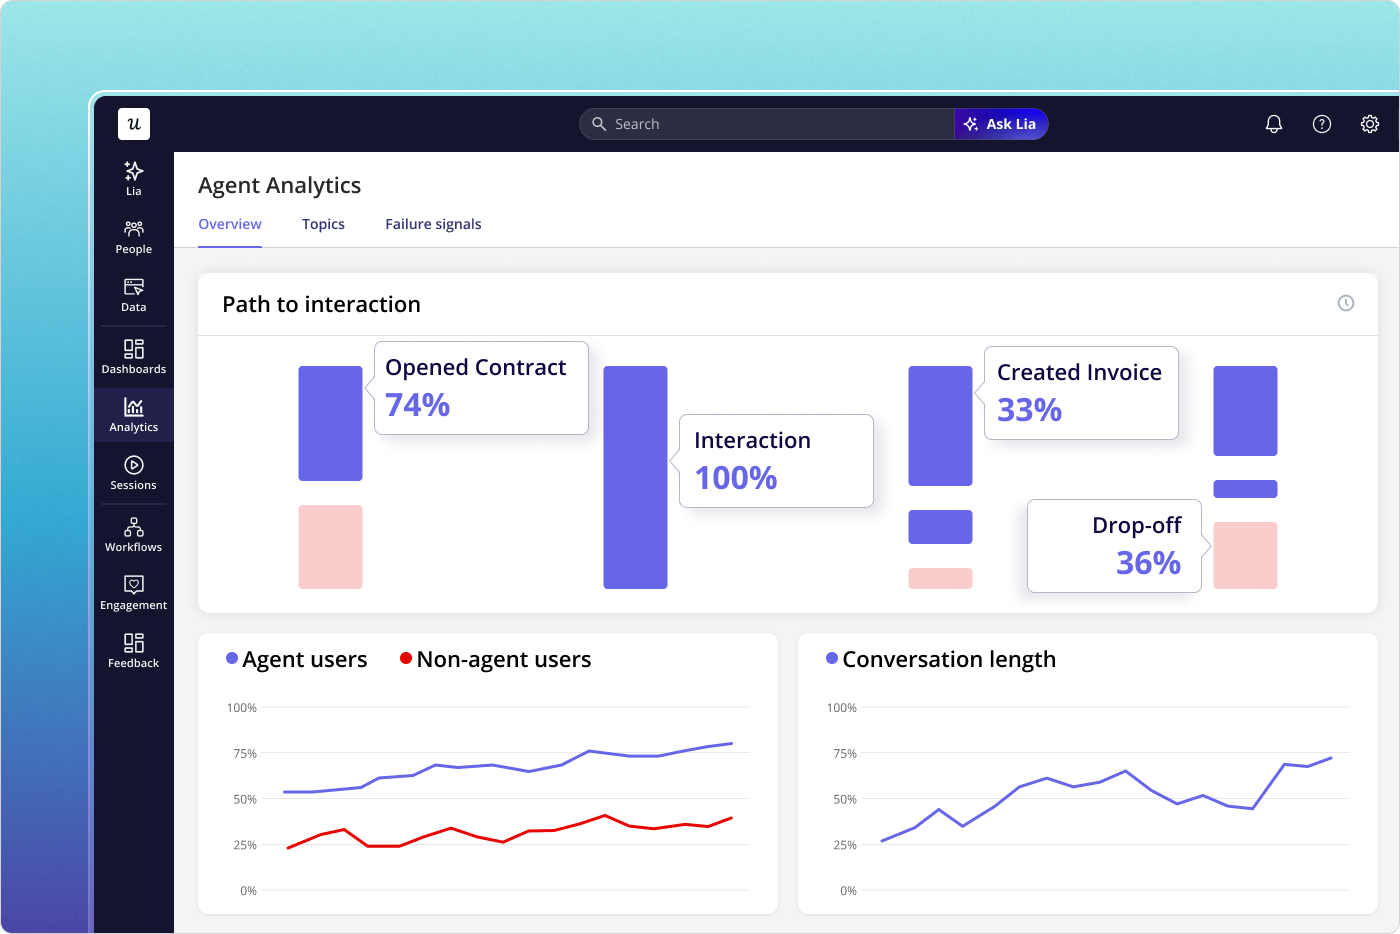
Userpilot Agent Analytics tracks what AI agents are doing in your product. Before treating a cancellation as a low-usage problem, check this first.
The work that keeps accounts off the cancel page
The cancellation flow handles the users who announce they’re leaving. The work that keeps people from reaching it is more upstream: specific behavioral triggers, automated re-engagement, and CS outreach routed to the right accounts at the right moments.
A few specific triggers worth building with Userpilot Workflows:
- If a user hasn’t logged in for 14 days, trigger a re-engagement email based on the inactivity event, not a calendar schedule.
- If a user hasn’t reached a core activation milestone, trigger a contextual tooltip or guided flow at their next login.
- If an account visits the billing or subscription page, create a Signals alert that routes to their CSM that day, not the next weekly review.
- If usage on a previously active feature drops to zero, flag it. That’s the early-stage silent abandonment pattern, while there’s still time to address it.
Your churn prevention is only as good as how well you are able to identify the customers who need help, and your timing. The goal is to make sure the accounts that need a human conversation get one before they need an exit survey.
See how Userpilot handles churn prevention end-to-end.
About the author