What Is Amplitude Analytics? A Complete Guide to Features, Pricing, and Use Cases

Amplitude Analytics helps product teams study user behavior in detail, map out key journeys, and uncover the patterns behind product adoption and retention.
But is it the best tool for SaaS teams today?
In this article, I’ll walk you through Amplitude’s key features, pricing plans, and real use cases, then break down when it might make more sense to consider an alternative and which tools stand out.
You are searching for “What is Amplitude Analytics” — but is it the right tool for you?
Let’s find the best fit for your product growth goals.
Amplitude requires significant setup. What does your data team look like?
When you spot a drop-off in your funnel, what is your immediate next step?
The Verdict: Analytics + Action = Growth
While Amplitude is powerful for pure analysis, it lacks the tools to fix the problems you find.
Userpilot lets you track behavior AND act on it with in-app experiences immediately.
Try Userpilot Now
See Why 1,000+ Teams Choose Userpilot
What is Amplitude Analytics?
Amplitude Analytics is a product analytics platform that helps businesses understand user behavior to build better digital products and experiences.
It uses real-time behavioral and event-based analytics to track interactions like clicks and page views, providing insights into user engagement, retention, and revenue.
Teams can use this information to improve products, make data-driven decisions, run experiments, and personalize marketing campaigns.
Key features of Amplitude Analytics
Amplitude Analytics comes with several built-in reporting tools that help teams better understand their users. Here are four that I find most helpful:
- Event segmentation: This feature lets you break down product usage by user attributes or behaviors. You can look at how certain segments interact with a feature, search for patterns across plan types, or study how different cohorts behave over time.
- Cohort analysis and predictive cohorts: While segmentation helps you compare groups in the moment, cohort analysis focuses on how groups of users behave over time. For example, you can create a cohort of users who complete your onboarding checklist in their first session and compare their 30-day retention rate to users who skip it. Amplitude also offers predictive cohorts powered by machine learning. Using the same example above, the platform can identify new users who behave similarly to those who skipped onboarding, which in turn equips you to proactively engage them and reduce churn.
- Funnel and path analysis: These features show you how users progress through a series of steps, such as onboarding, activation, or renewal. You can generate reports that let you examine each step closely, highlight drop-off points, and understand the different routes users take before completing or abandoning a flow.
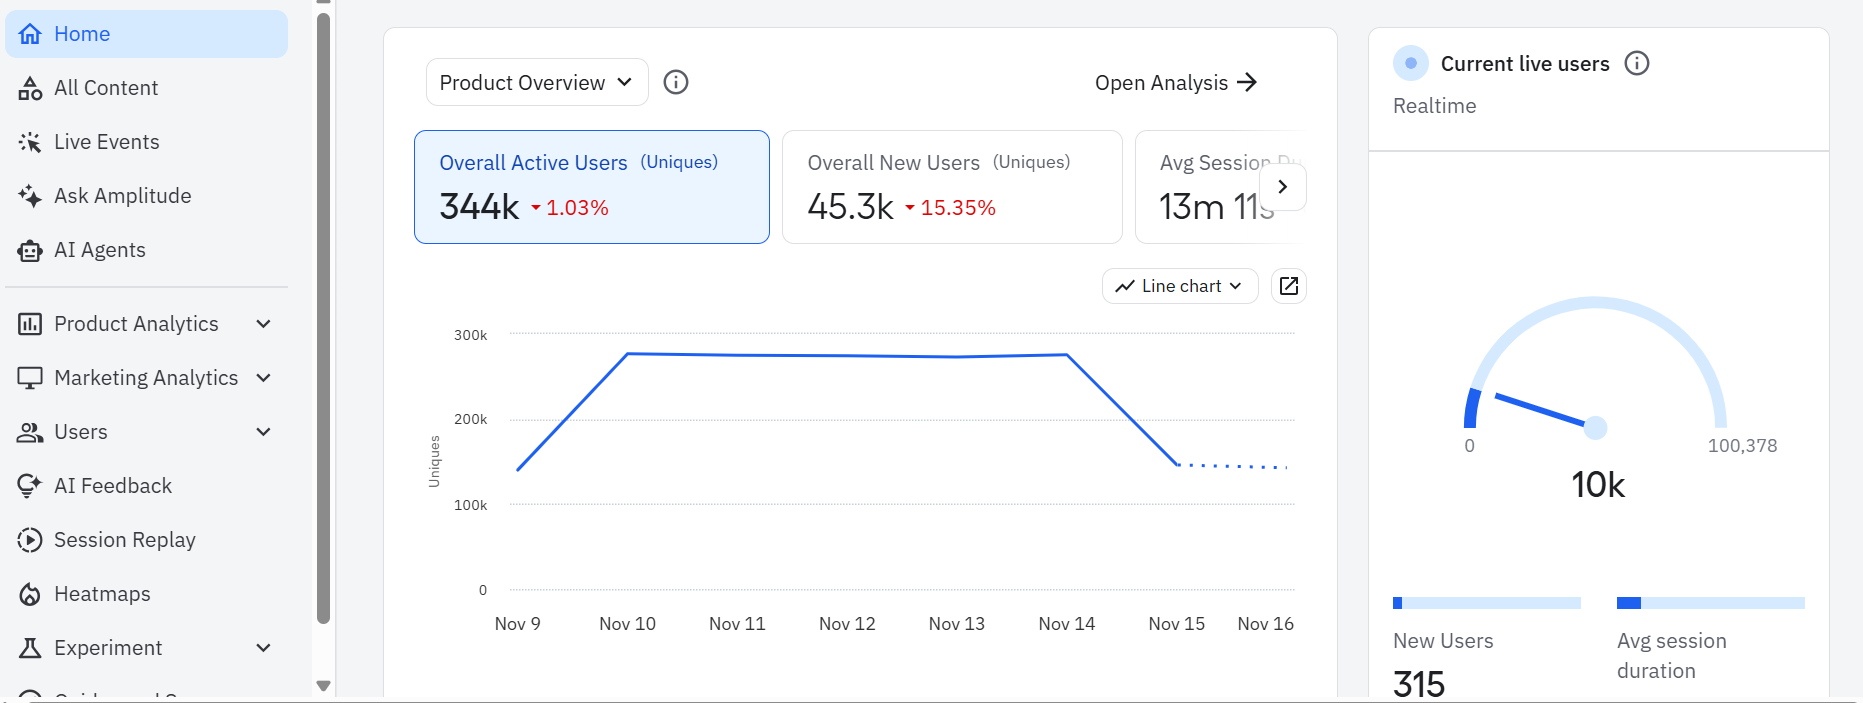
- AI-powered insights and natural language queries: Amplitude now includes AI features that let you ask questions in plain English, such as “Why did weekly active users drop?” The system will automatically search for answers and return an explanation. However, keep in mind that the accuracy of these insights depends on having well-instrumented and consistently structured data.
Pricing for Amplitude Analytics
Amplitude offers several pricing tiers designed to support different stages of product maturity:
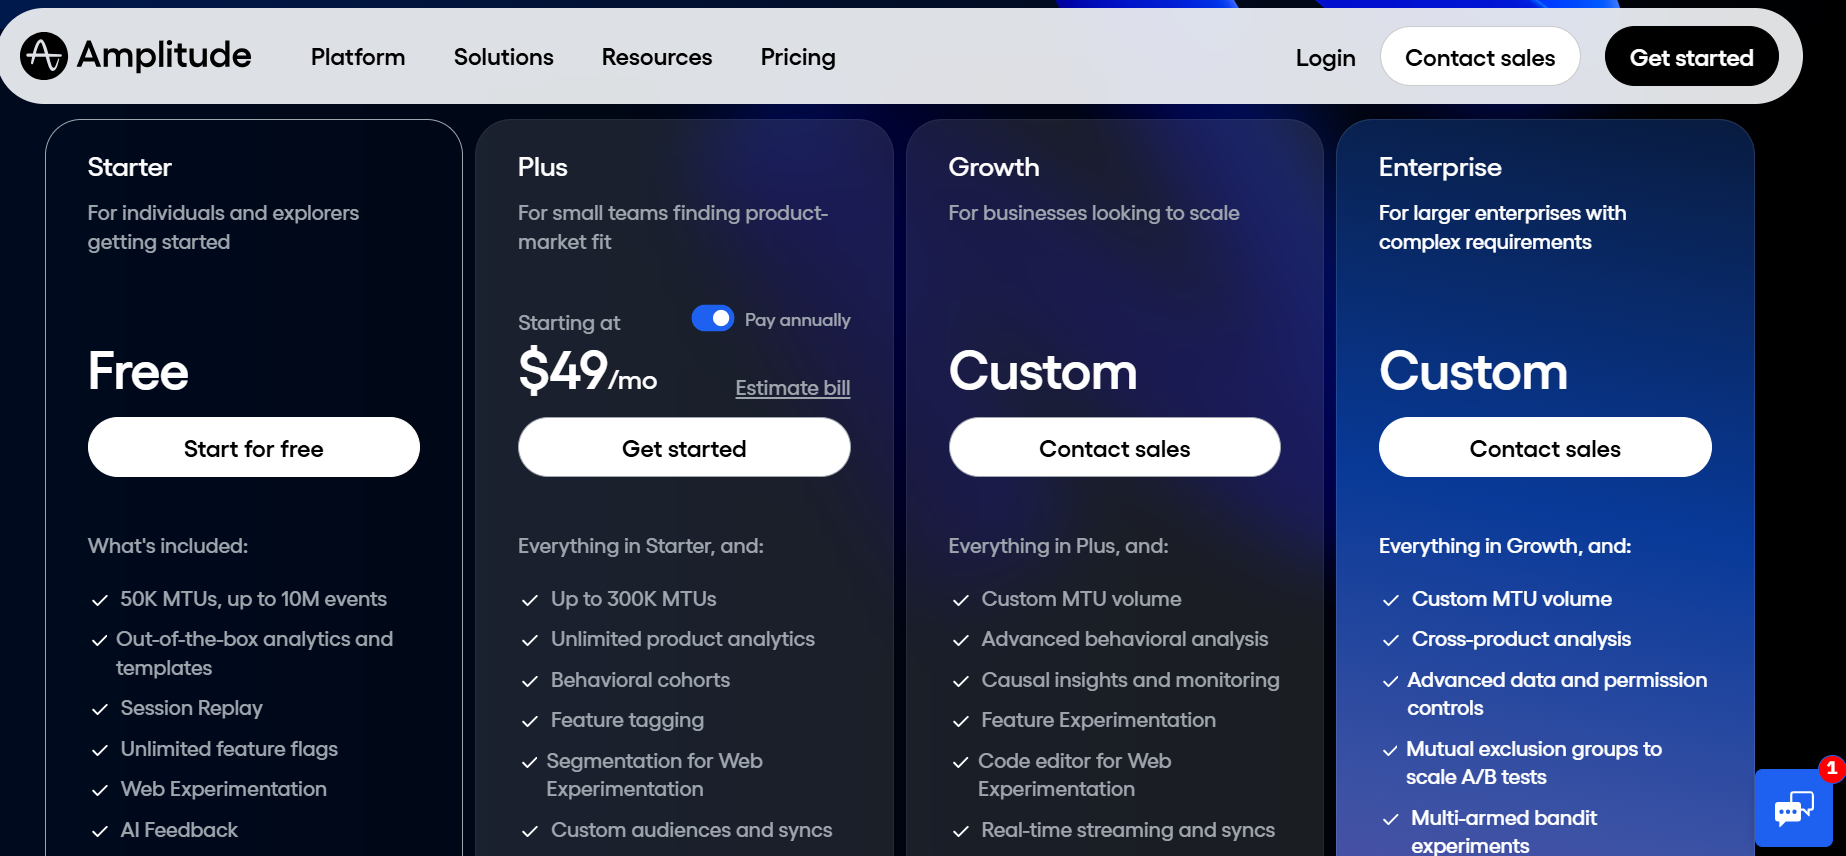
- Free plan: This tier includes 50,000 monthly tracked users and up to 10M events, along with out-of-the-box analytics, templates, session replay, unlimited sources and destinations, feature flags, web experimentation, AI feedback, and access to the Amplitude community and academy.
- Starter plan: Starting at $49 per month when billed annually, this plan supports teams that need more flexibility over a longer period. It increases the limit to 300K monthly tracked users and adds unlimited product analytics, behavioral cohorts, feature tagging, segmentation for web experimentation, custom audiences, and online customer support.
- Growth plan (Custom): The Growth tier builds on everything in Starter and includes custom MTU volume, advanced behavioral analysis, causal insights, product experimentation, predictive audiences, and additional support options.
- Enterprise plan (Custom): This tier offers additional benefits like cross-product analysis, advanced data and permission controls, mutual exclusion groups for cleaner A/B tests, and an assigned account manager. It’s designed for large organizations with complex analytics needs and strict data governance requirements.
Amplitude Analytics pros and cons: Is it worth the investment?
Amplitude is one of the most capable analytics tools available, but its strengths come with a few trade-offs. Here’s a balanced look at the pros and cons.
Pros of Amplitude Analytics
- Unmatched analytical power: For teams with a dedicated data analyst or data science function, Amplitude is often considered the gold standard. Its ability to segment users by any combination of properties, events, and behaviors gives you a level of depth most tools can’t match. You can answer highly specific questions such as: “Show me the 90-day retention of users who signed up through our Product Hunt campaign, are on the Pro plan, created more than five projects using the Kanban template in their first week, and have never used the Team Invite feature.” Few analytics platforms can support queries of this complexity with the same speed and flexibility.
- Built for enterprise scale: Amplitude is engineered to handle billions of data points without breaking. For large consumer apps or enterprise platforms with massive event volumes (think millions of events per hour), this reliability is non-negotiable. It ensures your dashboards load quickly and your data is always available.
- Real-time insights: When you ship a new feature or launch a marketing campaign, you can see its impact on user behavior almost instantly. This allows product teams to validate decisions quickly and pivot if an initiative isn’t performing as expected, rather than waiting weeks for data to be processed.
Cons of Amplitude Analytics
- Requires a data expert: Amplitude’s depth can be overwhelming for anyone without a strong analytics background. For example, a PM who wants to check how many people clicked the new banner can easily get stuck if the event wasn’t instrumented correctly or if multiple similar events exist. In many teams, this means analysts become the gatekeepers for almost every insight.
- Limited in-app experience capabilities: Amplitude now includes features like Guides, Surveys, and Session Replay, which add helpful context. However, these tools are light versions of what most product teams need for real onboarding or product adoption work. You can create simple prompts and surveys, but you can’t build multi-step flows, run targeted in-app experiences, or design the kind of personalized onboarding that dedicated adoption platforms support.
- Punishes growth: Amplitude’s pricing model is based on Monthly Tracked Users (MTUs), which means your analytics bill rises as your user base grows. This creates a painful conflict that forces you to make compromises on data quality just to manage cost. For example, instead of tracking a high-volume event that could show real user intent, you might choose a lighter event that only tells part of the story. The end result is an analytics setup that looks neat on paper but hides important behavior simply because tracking it would be too expensive.
3 Key Amplitude Analytics use cases to drive growth
Even with its limitations, I’ve seen Amplitude deliver strong results when it’s applied to the right problems. Here are three practical use cases that show how teams use it to drive growth.
1. Amplitude Analytics for improving user onboarding
Amplitude’s funnel analysis chart gives you a clear view of how new users move through your setup flow and where they abandon it. By mapping each key step, such as signing up, connecting data, or creating a first project, you can quickly identify where conversions drop off and which parts of the experience require attention.
Once the drop-off point is visible, you can dig deeper using segmentation and cohorts to understand who is struggling the most. Perhaps new users on a certain plan skip the setup step, or users from a specific channel fail to complete the activation process. These patterns help you form clear hypotheses about what is causing friction and what changes might improve the experience.
2. Amplitude Analytics for driving feature adoption
After onboarding, the next priority for any product team is driving adoption of the features that matter most. Amplitude helps by showing who is using a feature, the frequency of their return, and whether that usage correlates with stronger long-term engagement.
I find its behavioral cohorts feature especially useful here. You can start by looking at your most loyal users and identifying which features they rely on. If long-term users consistently engage with a specific feature, that’s a strong signal that the feature delivers real value and plays a meaningful role in retention.
Conduct ongoing cohort comparisons between users who engage with the feature and active users who don’t. If you notice sharper churn among the non-users, that reinforces the feature’s importance and confirms that adoption is tied to retention. With this insight, you can send targeted prompts to encourage more users to try the feature, helping you steadily improve adoption.
3. Amplitude Analytics for proactive churn reduction
Churn usually becomes visible long before a user clicks “cancel.” The real challenge is spotting those early signals and acting before the user disconnects from the product. Amplitude helps by showing clear patterns in behavior that often appear weeks before a subscription ends.
A simple method for getting this data is to compare the behavior of users who stayed with your product and those who left. By creating one group of churned users and another group of steady users, you can study their actions in the period leading up to the split. You might find that churned users opened fewer sessions, showed a sharp drop in usage frequency, or abandoned an important workflow. You can also run quick exit surveys that let users express their reasons for leaving, which often reveal issues that behavioral data alone may not show.
Armed with all this data, you can build a proactive churn reduction engine that truly works. For example, if a consistent reason for churn is a sharp drop in the use of a key feature, you can reach out to users who show the same drop and offer small nudges, helpful resources, or direct support. Over time, this steady cycle of spotting early signals and supporting at-risk users will reduce avoidable churn.
When to look for an Amplitude alternative
Amplitude is excellent at showing what’s happening inside a product. The challenge for many SaaS teams is turning those insights into improvement fast enough. After interacting with some Amplitude users and exploring online reviews, I identified three situations where it makes sense to find alternatives:
- You need to act on insights quickly: Amplitude helps you see where users struggle, but fixing the issue often depends on development cycles. Even when a drop in the onboarding funnel is obvious, the solution usually requires engineering work, and that update can sit in a backlog for weeks. If your team needs to support users in the moment or guide them through friction without waiting for a sprint, you may require a no-code tool that enables you to take direct action within the product.
- You want more people across the team to answer their own questions: Some roles rely on data daily but don’t have the time or background to build complex charts. Marketers want to check how an announcement performed. Customer success teams want to see whether key accounts stopped using an important feature. Sales teams want quick context on account activity before a call. Iteration will slow down if these teams depend on analysts for every answer. In those cases, a tool with a simpler learning curve or more accessible reporting might fit better.
- You want automatic, no-code event tracking: Amplitude requires you to define every event in advance, which means each click, input, and interaction must be instrumented by engineering. Choose a tool that offers auto tracking out of the box if you’d rather use that engineering bandwidth for other parts of product growth.
Best Amplitude Analytics alternatives
Does Amplitude feel heavier than your team needs? This table covers some of the strongest alternatives I’ve seen that offer faster setup, simpler reporting, and a closer link between insights and in-app action.
| Tool | Best for | Standout strength | Why choose it |
|---|---|---|---|
| Userpilot 🚀 | Teams that want analytics plus in-app guidance | Connects behavior data with real-time actions | Userpilot shows where users struggle and lets you guide them instantly with checklists, tooltips, surveys, and targeted prompts. You act on insights without waiting for engineering. |
| Mixpanel 📊 | Teams that want strong analytics with easier charts | Fast event exploration | Mixpanel offers clear reports with a lighter learning curve. Good fit if you want deep insight without a heavy setup. |
| Heap ⚡ | Teams that value automatic tracking | Auto capture with no setup | Heap records clicks, inputs, taps, and page interactions as soon as users perform them, which removes the need for detailed tracking plans. |
| Pendo 🧭 | Companies with product ops and enterprise needs | In-app guides plus usage data | Pendo blends product usage insight with in-app messages and walkthroughs. Helpful for larger teams that want analytics and communication in one place. |
| PostHog 🛠️ | Teams that want a flexible, self-hosted option | Full control of data and setup | PostHog combines analytics, feature flags, session replay, and experiments. Useful for teams that want to own their stack. |
| Smartlook 👀 | Teams that want visual clues and session context | Session replay with event data | Smartlook shows what users did and how they moved through the product. Helpful when you want quick visual clues paired with simple event insight. |
Conclusion
Amplitude Analytics provides clear depth for studying complex user journeys, comparing segments, and answering the big what questions with confidence. However, as we’ve seen, it works best when your core problem involves in-depth analysis and you have a dedicated data team to manage the setup, tracking rules, and ongoing maintenance.
If you need faster iteration or want a simpler way to work with both behavioral data and in-product guidance, your best bet is to use a platform that brings analytics and action together in one place, rather than splitting them across different tools.
This is where Userpilot comes in. Our platform equips you with analytics, surveys, session replay, and the Growth Agent so you can study user activity and support users at the same time. For instance, instead of only seeing that users drop off during onboarding, you can guide them at that moment with modals, checklists, or tooltips. When a workflow becomes confusing, you can launch in-app surveys to gather feedback right when the problem appears. And when feature adoption drops, Userpilot’s session replay, event insight, surveys, and Growth Agent help you understand the cause and address it without code.
Ready to see it in action? Book a demo today.
![]()
Stop Overpaying for Amplitude Analytics and Start Driving Retention with Userpilot

About the author