What, Why, and How to Combine Behavioral and Attitudinal Data to Make Objective UX Decisions


Ask users what they think about a product, and they’ll give you opinions. Track how they use it, and you’ll see a different story.
Users often struggle to explain what’s wrong with an experience. They might mention obvious frustrations, but deeper issues might go unnoticed. So if you rely only on attitudinal data (what they say) or behavioral data (what they do), you’ll have a real hard time making smart UX design decisions.
That’s why the best approach is to combine both! In this guide, I will explain attitudinal and behavioral data, why they need to work together, and how to use them to improve the user experience.
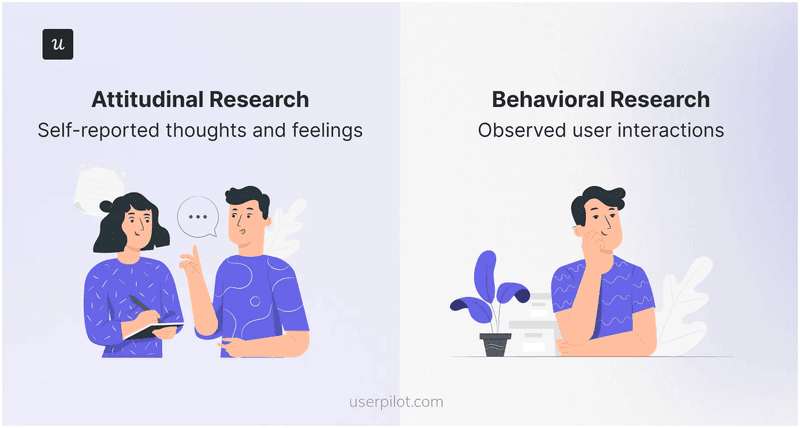
What are attitudinal and behavioral data?
Users experience products in two ways: what they think is happening and how they interact. Sometimes, these align. Other times, they don’t. That’s why it’s key to understand both perspectives when collecting data:
- Attitudinal data: Captures what users say they think or feel about their experience. It comes from surveys, interviews, and feedback forms. For example, a user might say they find a dashboard “confusing” or a feature “useful.”
- Behavioral data: Tracks what users do in a product. It includes event trackings and session recordings that capture clicks, scrolls, and drop-offs. For example, users might frequently abandon a setup process, even if they never mention it in a survey.
Now, let’s explore how they work and what they bring to UX research.
Attitudinal research methods: Understand what users say
Attitudinal research is all about getting inside your users’ heads, so you can understand their thoughts, feelings, and frustrations. It focuses on why they act the way they do, rather than just tracking what happens.
Here’s how different methods help you find those insights:
- Surveys – These are best for gathering structured feedback at scale. For example, an NPS survey asks “How likely are you to recommend us?”, and gives you a quick read on user satisfaction. The only catch is that because responses are limited to pre-set questions, you might miss unexpected insights.
- User interviews – Want to go deep? Interviews are your go-to. These one-on-one chats let you explore direct user feedback in detail. You can ask open-ended questions (“Tell me about a time you used this feature…”) and follow up on their answers to get the real story. They are more time-consuming than the survey but much more insightful.
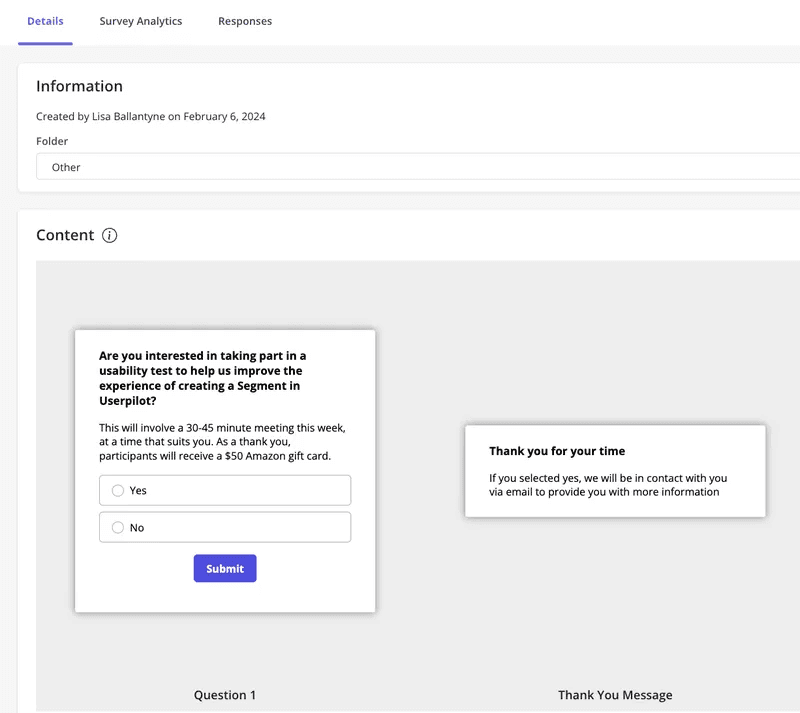
- Usability tests (with verbal feedback) – This is where you watch users actually use your product, and “think aloud” as they do. It’s one of the best ways to catch usability issues that surveys and interviews might miss. But a big challenge with this is getting people to participate. Especially in B2B, where users are busy and emails can be ignored.
Userpilot’s own UX researcher, Lisa, found this out firsthand. She needed participants for usability testing, but emails weren’t cutting it. Switching to Userpilot for sending in-app survey invitations solved the problem, boosting her response rate by 4X. This highlights how crucial the right channel is for reaching your target users.

- Customer feedback forms – Think of these as digital suggestion boxes. A simple “What’s one thing we could improve?” can uncover surprising issues and ideas you’d never considered. Because they’re open-ended, users can share whatever is on their minds. But that also means you’ll need to sift through a lot of responses to find the gems.
Behavioral research methods: Analyze user behavior data
Users might say they love a feature, but do they actually use it? Behavioral research focuses on answering that question.
From key behavioral analytics insights like usage patterns, drop-off points, etc., you can find areas for improvement that surveys alone might miss.
Here are a few ways you can collect different types of behavioral data:
- Event tracking (autocapture) – With autocapture, you automatically record every user interaction, like button clicks, form submissions, and feature usage. So instead of guessing what users engage with the most, you can quickly spot patterns and focus on what matters.
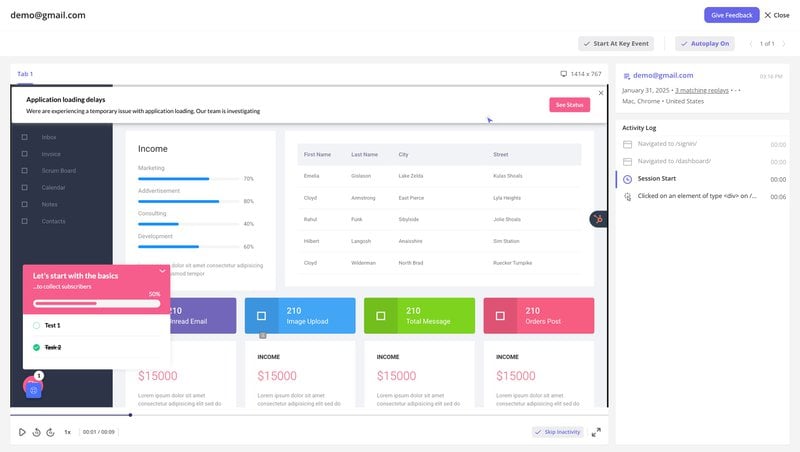
- Session replays – Playback user sessions to watch them navigate your product in real time. It’s like having a usability test running in the background, only with real users, in real situations. Watching where users hesitate, rage-click, or backtrack is a great way to understand their frustrations firsthand.
- Funnel analysis – Funnels are great for tracking how users move through key workflows and where they abandon a process. If most users abandon a process at the same step, that’s a red flag. Maybe the instructions aren’t clear; maybe there’s too much friction. Either way, funnel analysis helps you spot the problem before it starts costing you users.
Behavioral data is important because it gives you hard evidence of how people interact with your product. It makes it so much easier to know exactly which features to prioritize, what obstacles to remove, and what parts of the experience need your attention first.
Why should you combine behavioral and attitudinal customer data?
It’s simple: you need both to truly understand your users. Here are the concrete reasons why you should do so:
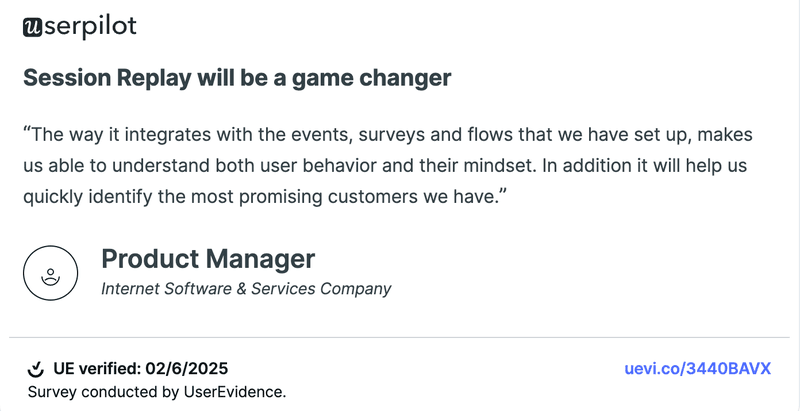
- Find the root cause: Imagine users report that a feature is confusing (attitudinal). Behavioral data, like session replays, can then pinpoint exactly where the confusion arises – a poorly placed button, unclear instructions, etc. You get the full story, not just a symptom. As our customers put it:
- Validate your assumptions: Don’t assume you know why users behave a certain way. If users say they don’t use a feature (attitudinal), check if that’s true by looking at the product usage data (behavioral). Maybe they just haven’t discovered it yet! This prevents costly misinterpretations.
- Improve decision-making for product development, UX design, etc.: Want to prioritize the right features and improvements? When user feedback and quantitative data like usage patterns align, you have solid evidence to guide your decisions. This reduces risk and increases your chances of building something users will use and love.
That’s exactly how Cyberbiz used Userpilot to redesign their admin panel. Instead of just guessing which features to improve, they focused on analyzing product usage trends to see which ones customers found most valuable.
They also paired these insights with attitudinal research: in-app surveys to collect customer feedback. By combining what they learned from both product usage data (behavioral) and surveys (attitudinal), the team knew exactly where to focus their efforts. The result: a smart redesign of their admin panel that made those key features more accessible and engaging for users.

How to combine attitudinal and behavioral research methods to make UX decisions?
Now that we know why both types of data matter, the next step is figuring out how to use them together effectively. The key is to use each type of data to inform and refine the other, creating a continuous feedback loop.
Leverage user behavioral data to guide attitudinal research
Our UX researcher, Lisa Ballantyne, and the team find that analyzing behavioral data is invaluable for framing attitudinal research questions. We start by digging into what users are doing before we try to understand why.
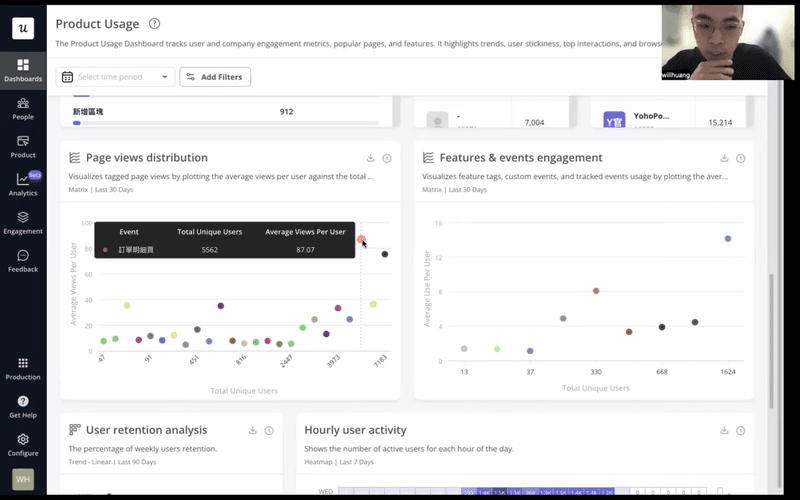
For example, we have various dashboard templates. Using features like trend analysis, we can see which templates are hits, which ones are only used by a few power users, and which ones gather dust.
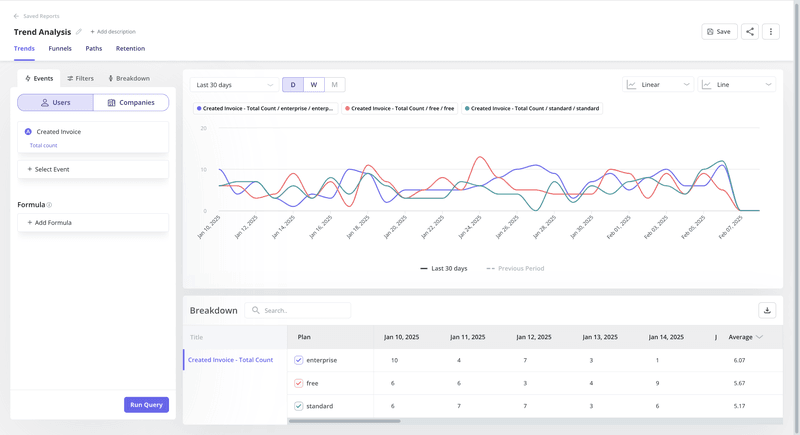
This behavioral data shapes our questions and helps us uncover user preferences. Let’s say the “Expansion Revenue & Upgrades” template is underused; we don’t just generally ask about dashboards.
We get specific:
- Use analytics to pinpoint specific user behaviors (e.g., low usage of a feature, high drop-off rates on a page).
- Craft survey and interview questions directly related to those observed behaviors: “Why haven’t you used this feature?” “What difficulties did you encounter on this page?”
Use attitudinal research to identify problem areas and guide behavioral testing
At Userpilot, we don’t just use behavioral data to guide our attitudinal research—we also use attitudinal research to guide our behavioral testing. It’s a two-way street!
Here’s how our product designer Sean Cummins put it into practice:
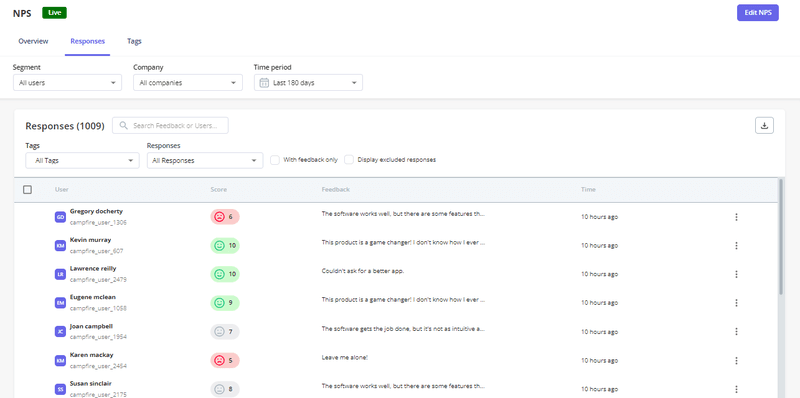
- Start with attitudinal research: I use surveys, interviews, and usability testing to gather feedback on user experience. This helps us pinpoint potential problem areas, like features that users find difficult to use or pages with high drop-off rates. For example, via NPS surveys, I can segment distractors to identify common issues among them.
- Use those insights to design behavioral tests: I use the feedback from our attitudinal research to design targeted behavioral tests. For example, if users report struggling with a specific task, I might create a usability test to observe how they interact with that task in a real-world setting.
- Combine the data to get the full picture: By combining attitudinal and behavioral data, I can get a more complete understanding of user needs and pain points. This helps us make more informed design decisions and create products that are both user-friendly and effective.
FAQ
What is the difference between behavioral and attitudinal research?
Behavioral research helps collect behavioral data. It tracks how users interact via clicks, navigation paths, and drop-off points. Attitudinal research focuses on what users say. It captures opinions, preferences, and perceptions through surveys, interviews, and feedback forms. Behavioral data is objective, and shows actual user actions, while attitudinal data is subjective, and shows perceptions that might not always match behavior.
What is the difference between behavioral and attitudinal metrics?
Behavioral data metrics measure user interactions, like time spent on a page, feature adoption rates, or conversion rates. Attitudinal metrics focus on user sentiment, such as Net Promoter Score (NPS), customer satisfaction (CSAT), or qualitative survey responses. Behavioral metrics show actual usage, while attitudinal metrics reveal how users feel about their experience.
What is the difference between behavioral and attitudinal segmentation?
Behavioral segmentation groups users based on actions, like frequent vs. inactive users or trial vs. paying customers. Attitudinal segmentation groups users based on opinions, like those who find a feature helpful vs. those who don’t. Combining both helps teams personalize experiences and target users in marketing automation systems more effectively.
What is an example of behavioral data?
Behavioral data includes any tracked user action, like clicking a button, completing an onboarding flow, or abandoning checkout. For example, if users frequently exit before finishing a setup process, different types of behavioral data can help identify where they drop off and why they struggle.
About the author