Feature Prioritization Matrix for Product Teams – Is it still valid in 2026?


The feature prioritization matrix is still the most-recommended tool in product management, but in 2026 most teams are still using it like it’s 2019.
What I hear from a lot of my PM friends: a PM stares at a RICE scorecard for 40 candidate features, ships the top 5 in a sprint, and three months later the funnel tells them 4 of those 5 features barely got used. The matrix wasn’t wrong; its inputs were.
Old prioritization frameworks assumed engineering capacity was the hard constraint and human clicks were the unit of value. Neither assumption is entirely true in 2026. Vibe coding compressed the build cycle from quarters to days, and a second class of users (AI agents) now consumes your product through APIs and MCP-style tool calls without ever opening a UI.
One benchmark study I’ve recently read found that only 6.4% of features drive 80% of click volume across the products in their dataset. 94% of everything teams ship gets ignored. The prioritization process was already misallocating effort before AI; vibe coding just made the same misallocation 10x cheaper to repeat.
My point is – the classic feature prioritization matrix still has a place, but only after a re-tooling that adds eligible reach, data readiness, evalability, ongoing run cost, and a hard governance gate.
Without that, RICE in 2026 is feature-factory running at AI speed, and the 6.4% average adoption rate is the receipt.
So I wanted to write something more useful than another generic feature prioritization framework round-up. So this guide does four things:
- Diagnoses why the old scorecards quietly mis-prioritize in 2026 (vibe coding, agent users, Pendo’s 6.4% problem).
- Ranks the five classic frameworks honestly (RICE, Value vs Effort, MoSCoW, Kano, Opportunity Scoring), with the fix each one needs.
- Hands you a layered hybrid model I’d actually run on a real roadmap today.
- Gives you a 15-criterion augmented weighted-scoring template you can drop into a spreadsheet this afternoon.
The short version
- Why old scorecards mis-prioritize in 2026: Vibe coding broke the engineering-as-bottleneck assumption, and agent users broke the human-click-as-value assumption.
- Run the two-stream classification gate first: Classify every candidate as human, agent, or both before you score anything; the metrics that prove value for each stream are different.
- The five classic frameworks, honestly ranked: RICE, Value vs Effort, MoSCoW, Kano, and Opportunity Scoring still help, but each one needs a 2026 fix (eligible reach for RICE, the 60% Must cap for MoSCoW, reliability re-categorization for Kano).
- The hybrid model that actually works: Opportunity Solution Tree for discovery, Weighted Scoring for portfolio decisions, RICE for sequencing within a chosen area, MoSCoW for delivery-time contingency.
- The 15-criterion augmented weighted-scoring template: Add eligible reach, data readiness, evalability, run cost, value-capture probability, kill condition, and a non-negotiable safety/privacy gate to whatever scorecard you use.
- The mistakes that get worse when AI ships faster: Customer-requests-as-roadmap, intuition-only calls, Must-have inflation, ignoring discoverability.
- After prioritization, monitor both streams: Track human adoption and agent task completion separately; the same dashboard misreads both at once.
Why the old feature prioritization scorecards quietly break in 2026
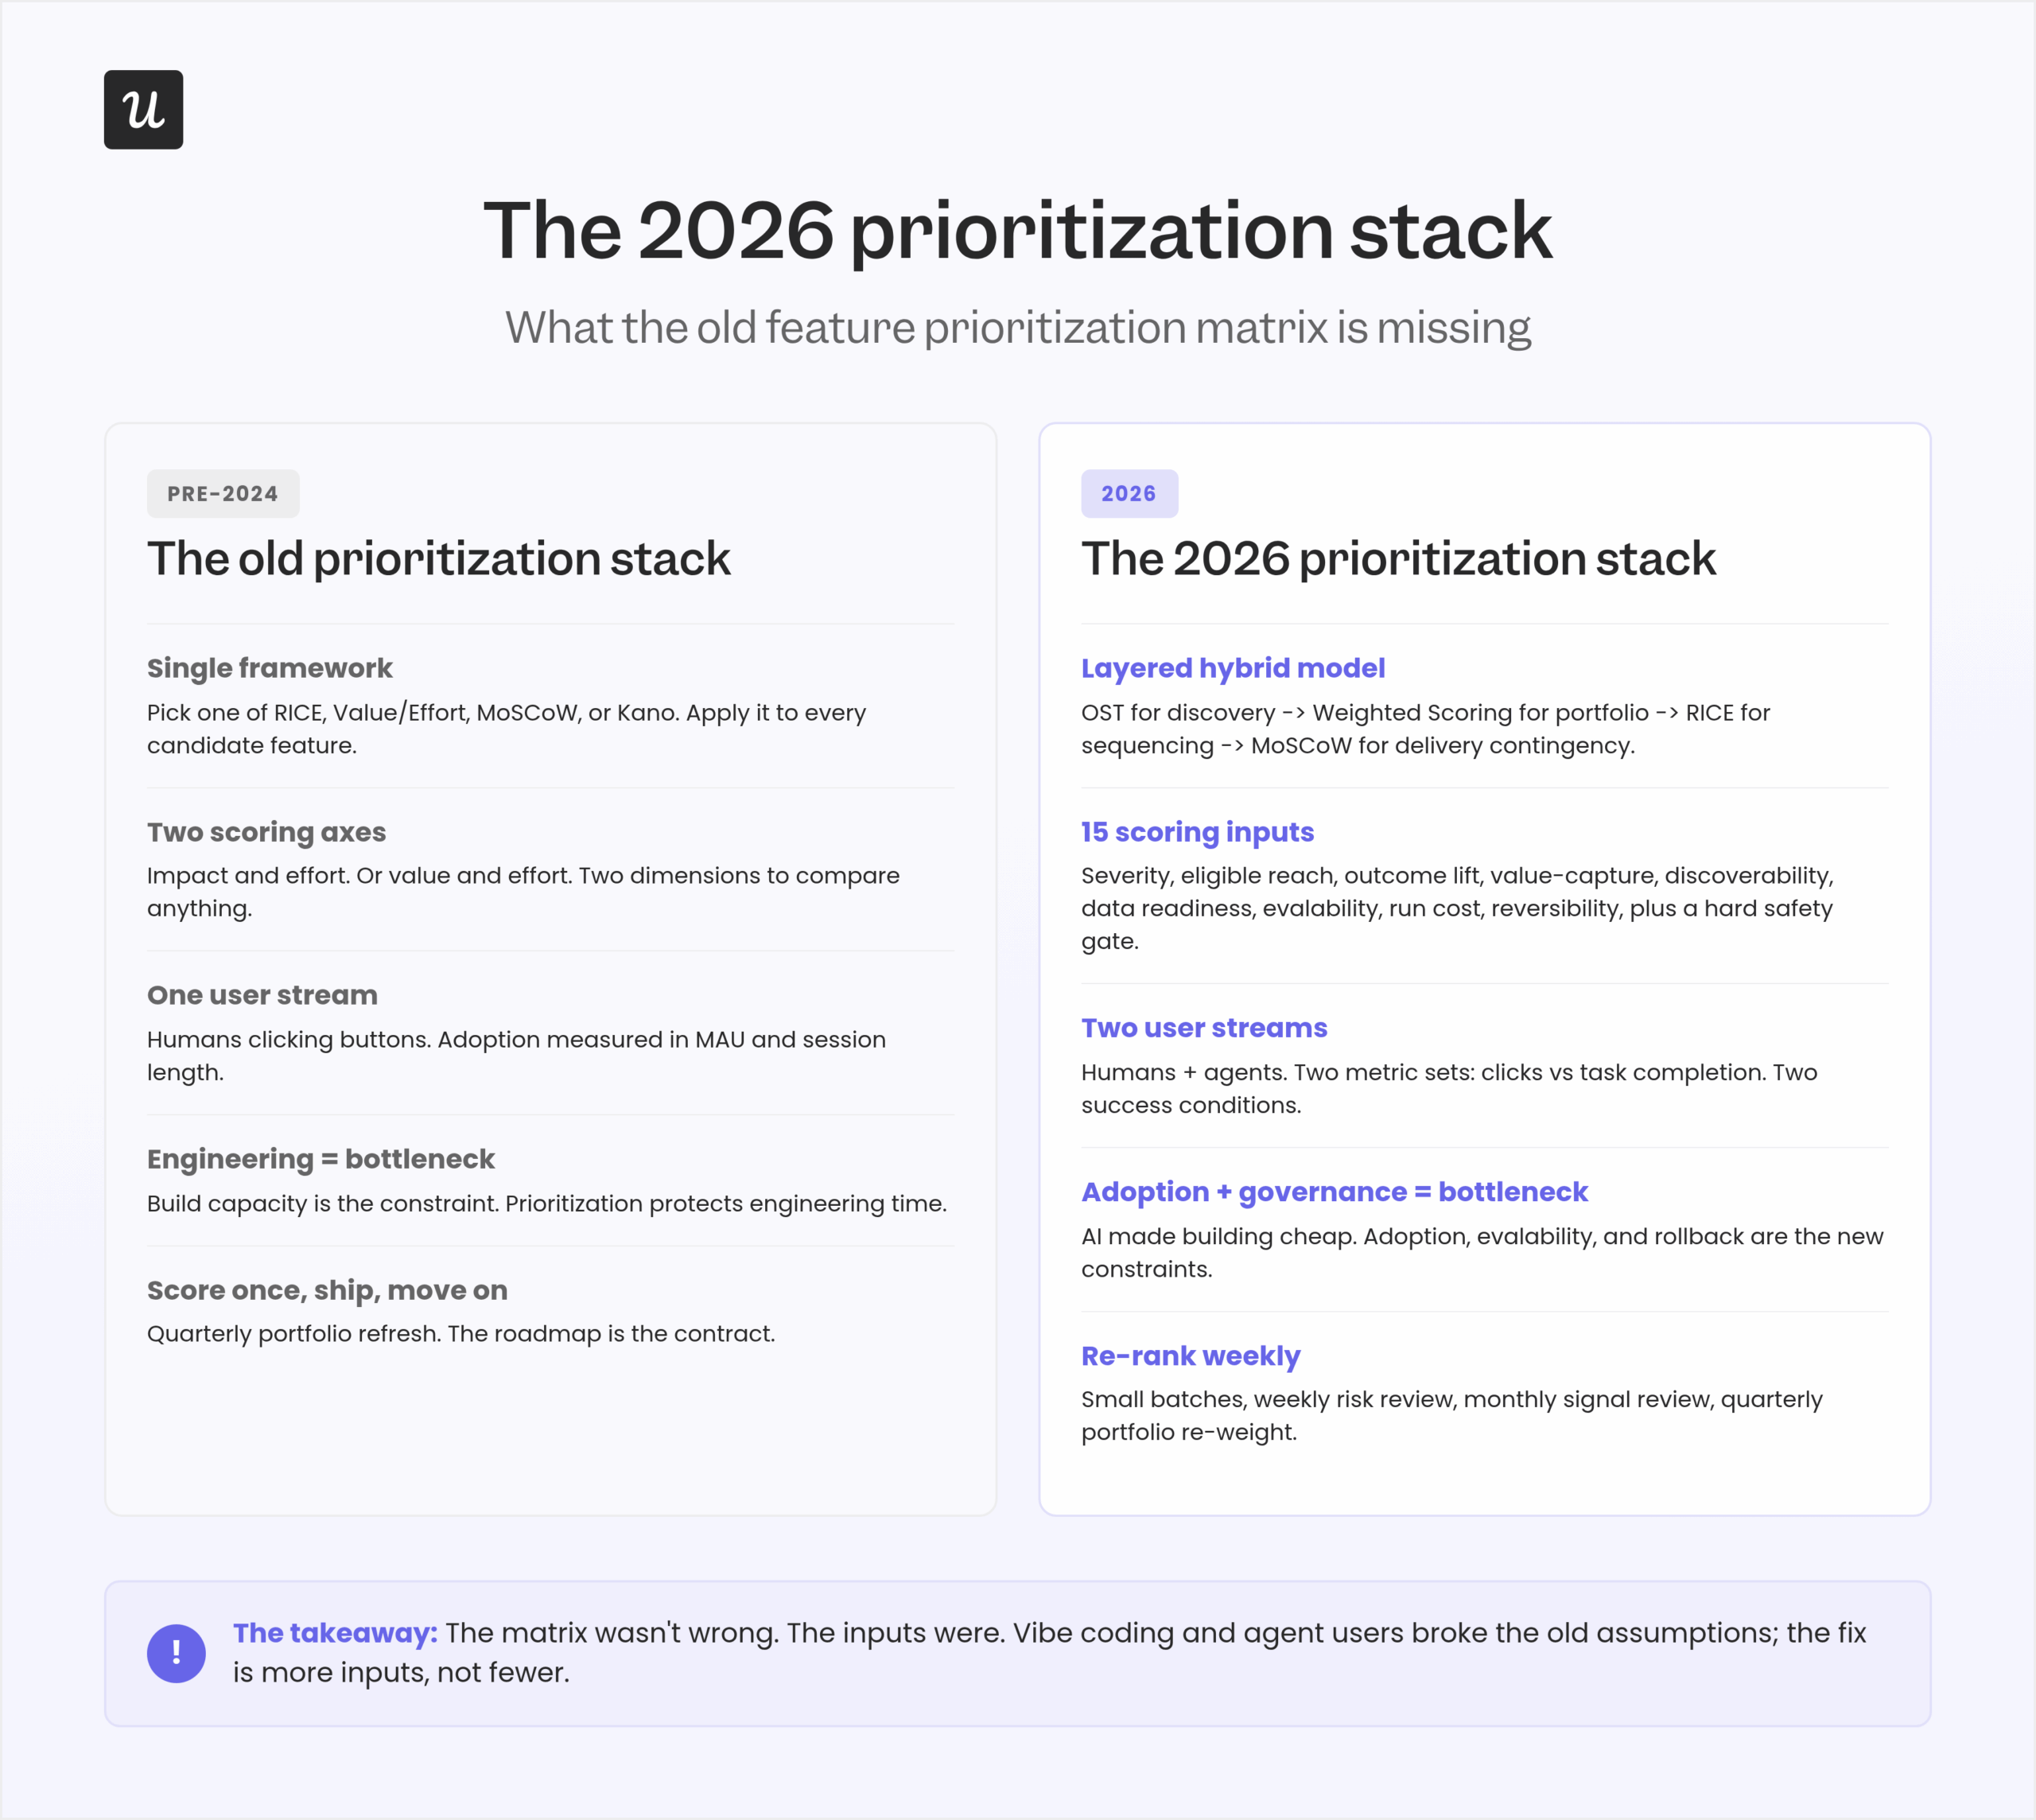
Most posts on this topic still define the feature prioritization matrix as a 2×2 grid of value vs effort, and that definition is half-broken in 2026. Two specific things broke: the cost of building features collapsed, and the user base split into two streams. Both of those facts change what should be on the matrix in the first place.
On the build side, vibe coding (natural-language-assisted software production) compressed the gap between “we should ship that” and “it’s live” from quarters to days. The 2024 DORA report confirms the productivity gain but flags the cost: when teams adopt AI without preserving small-batch discipline, delivery throughput drops by roughly 1.5% and delivery stability by roughly 7.2%. AI lets you ship more, but the stability and learning loops don’t speed up at the same rate.
On the user side, agents now do work humans used to do. They configure workflows, hit APIs, and complete tasks through MCP-style tool calls. Your product analytics stack was built around human clicks, so when an agent calls a tool 50 times in 30 seconds instead of clicking a button once, the dashboard quietly under-reports.
Underneath both shifts sits one number. Pendo’s 2024 benchmark says the median product has a 6.4% feature adoption rate, meaning only 6.4% of features drive 80% of click volume. The other 94% sit in the product, ignored.
Userpilot’s CEO Yazan Sehwail put the volume problem to me directly:
“As producing and building features become a lot cheaper, instead of every quarter, you’re releasing one or two features, now you’re releasing 7, 8, 9. It becomes even harder for product teams to manually have to track each one and understand usage for each one.”
That’s the trap in concrete terms. You have more features shipped than your team can read funnels for, more candidate features in the backlog than your scorecard can rank, and a second class of users your dashboards don’t even see. The classic feature prioritization matrix wasn’t designed for any of this.
A separate signal sharpens the case. Gartner predicts that over 40% of agentic AI projects will be canceled by the end of 2027, mostly for unclear business value, escalating run cost, and inadequate risk controls. None of those failure modes are visible in a Value vs Effort grid.
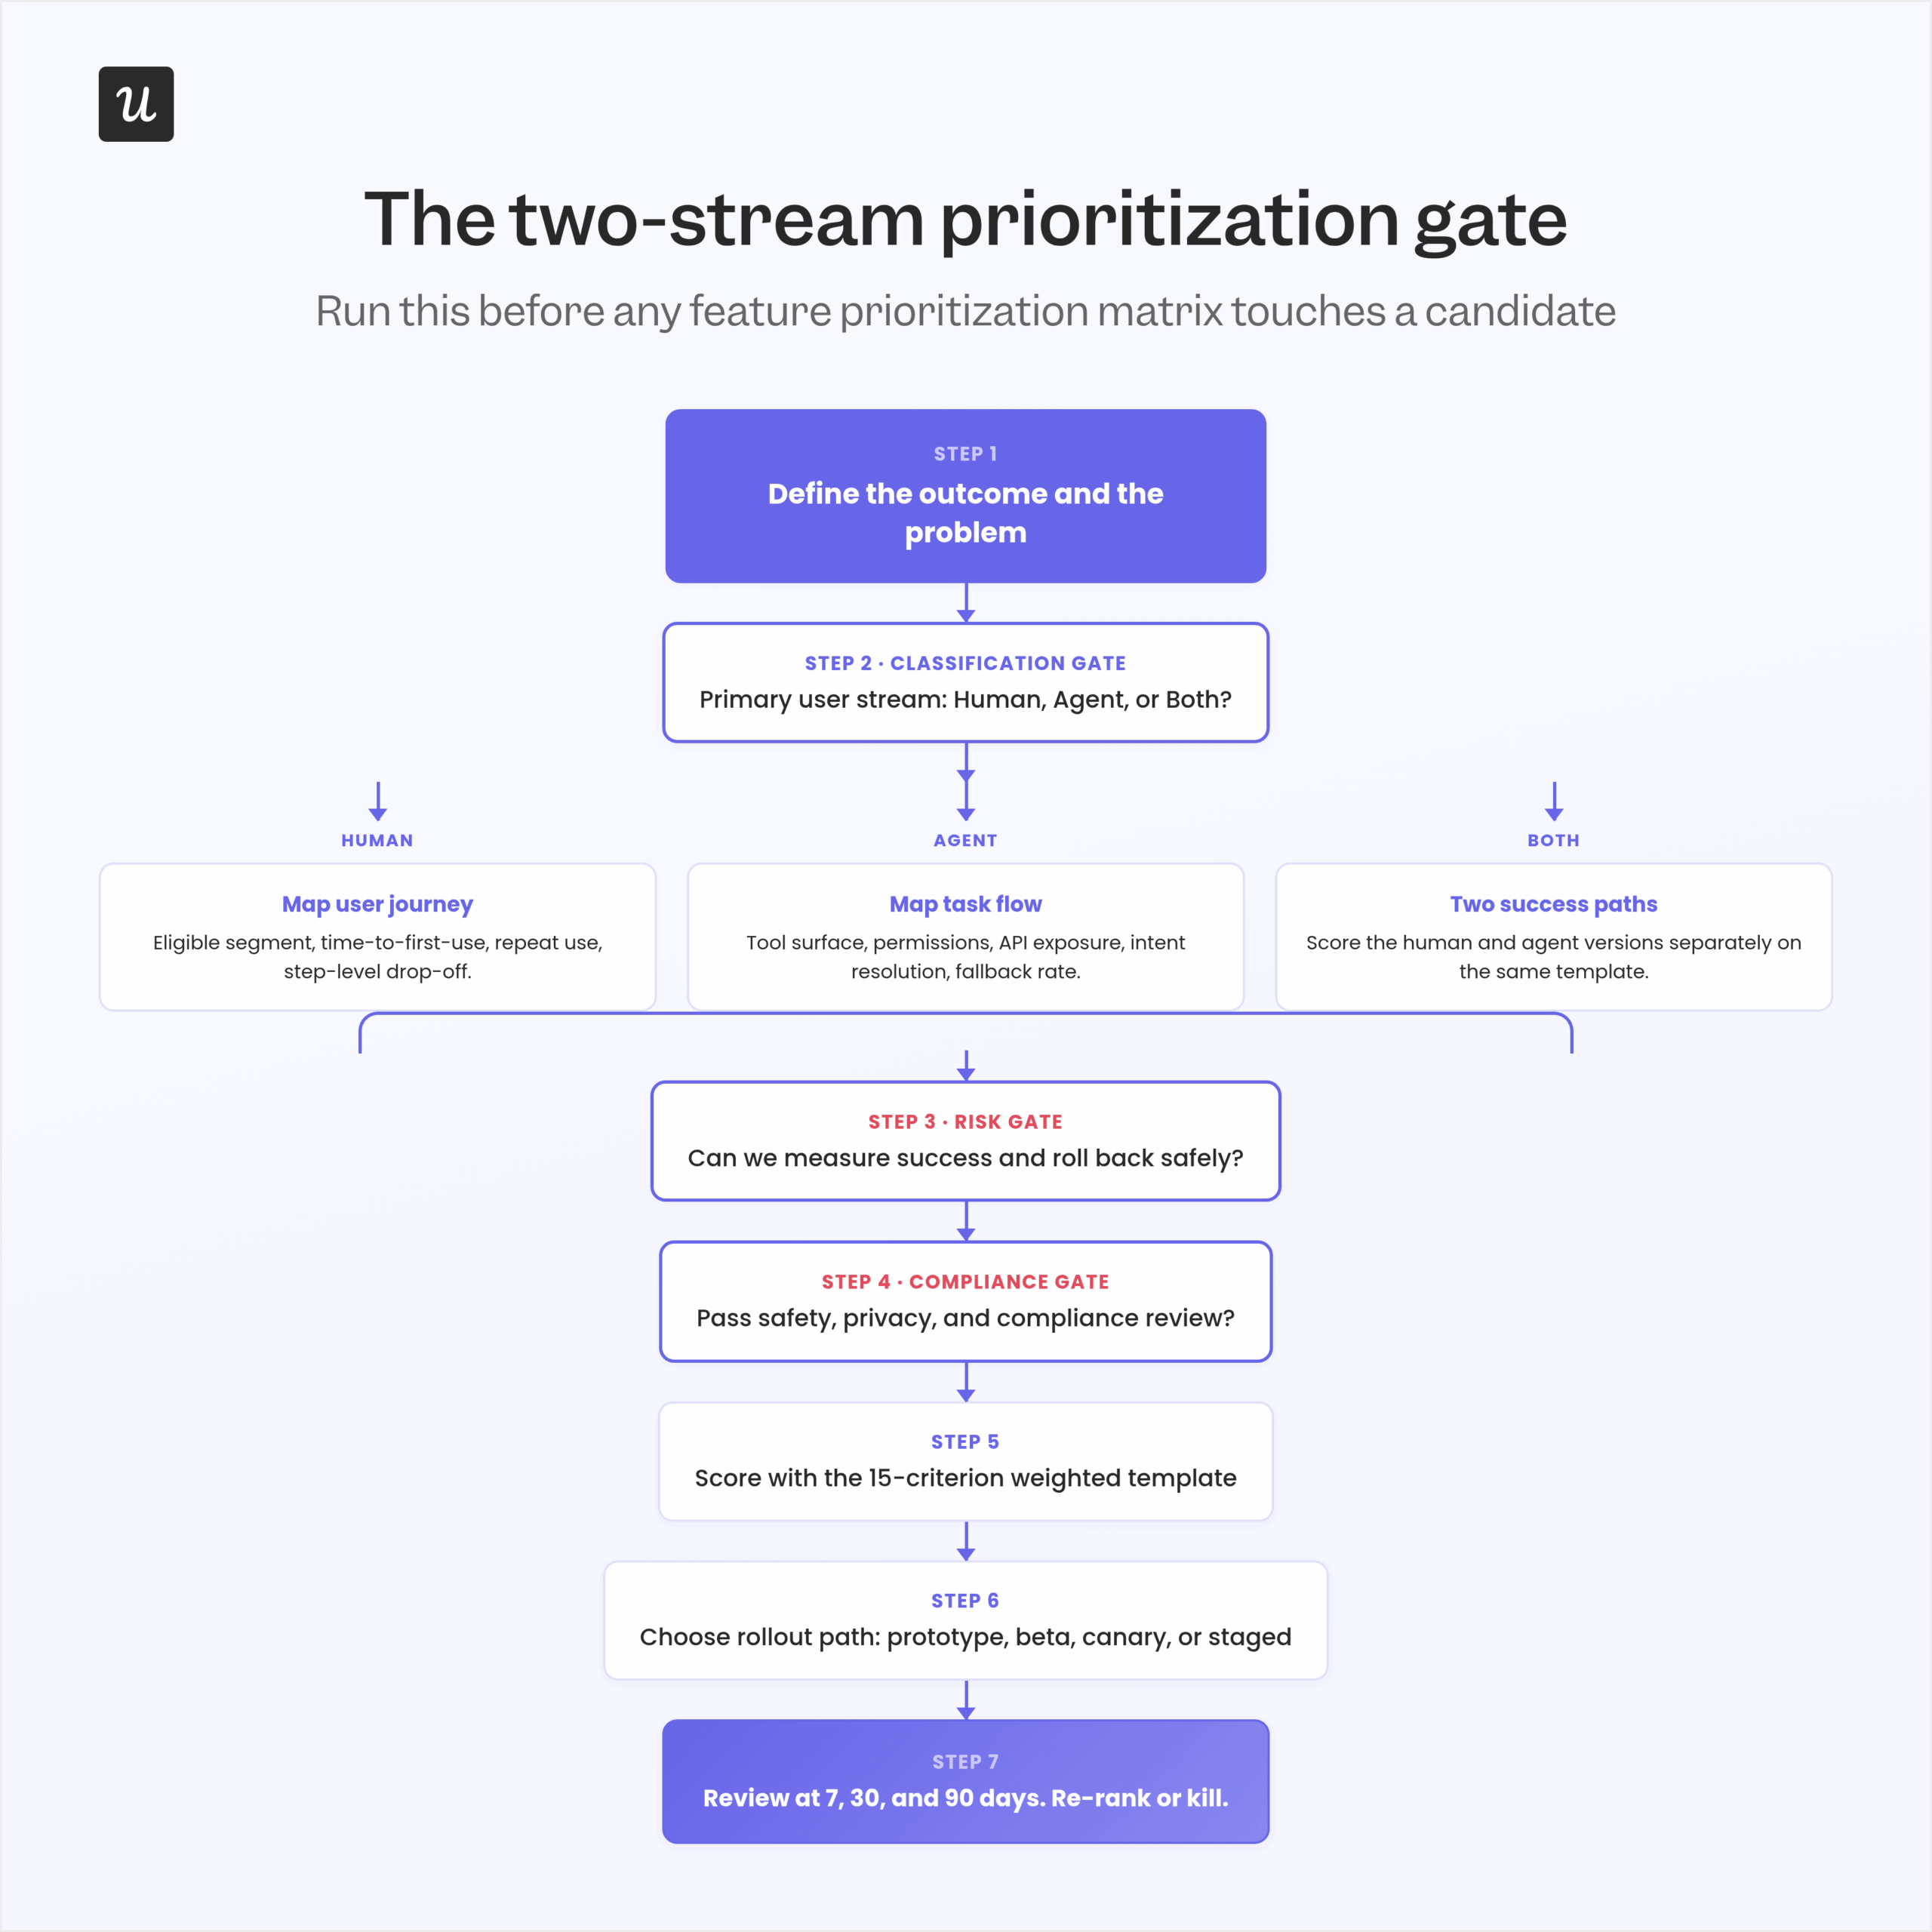
The two-stream classification gate: run this before any matrix
Before any feature prioritization framework touches a candidate feature in 2026, classify the user stream the feature serves: human, agent, or both. I keep this as a literal first column in my scoring sheet. The metrics that prove value for each stream are different, so scoring them on the same axis blends two different problems into a single misleading number.
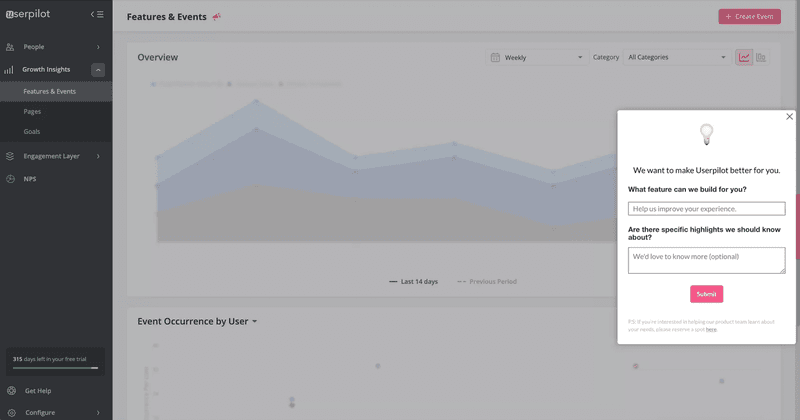
For human users, the unit of value is still observable in-product behavior: time to first use, repeat use, depth of use, step-level drop-off, retention lift. Userpilot’s product analytics was built to answer questions like these. They’re a good starting point but they break when the “user” isn’t clicking.
For agent users, the unit of value is task completion. The metric set looks more like intent resolution rate, tool-call accuracy, authentication success, latency, fallback rate, and human-intervention rate. Userpilot’s AI Agent Analytics was built for exactly this measurement gap, because click-based proxies misread agent-heavy accounts as either silent or noisy.
A practical definition I’d use: an “agent user” isn’t only someone running a chatbot inside your app. It includes anyone configuring no-code workflows, building automations through Zapier, or extending behavior through your API. Userpilot’s MCP Server makes product-usage data available to those agent users directly, which is part of why this stream is growing faster than most roadmaps account for.
Run the gate before you score. A human-only candidate uses human metrics downstream, an agent-only candidate uses agent metrics, and a both-stream candidate needs two parallel success paths designed from the start. As Yazan put it to me, the shift is from operator to monitor: you stop running the workflow yourself and start watching the agent run it.
That shift changes what “adoption” means inside your prioritization decisions. Human-stream adoption is repeated use of a feature over time, while agent-stream adoption is reliable task completion at scale with low fallback to a human. Two fundamentally different success conditions are now sitting on the same word.
The five classic feature prioritization frameworks, ranked for AI-first standards
Before I get to the hybrid I’d actually run today, here’s an honest rundown of the five prioritization frameworks most teams already know. Each one earned its place. Where they break in 2026 is more interesting than how they work.
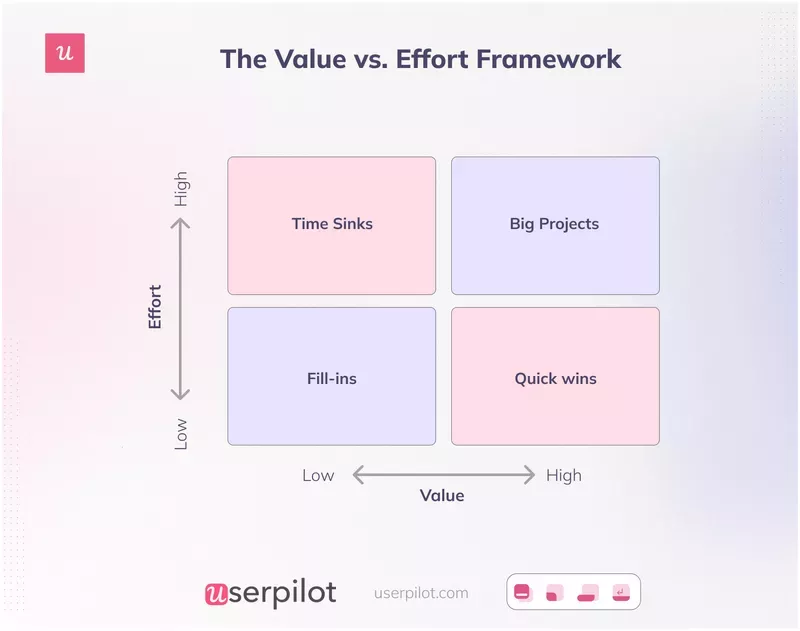
1. Value vs Effort matrix (the entry-level grid)
The Value vs Effort matrix is the most-used basic prioritization matrix in product management, and the reason it stuck around is simple: it fits on a whiteboard.
The 2×2 grid plots feature business value on one axis and development effort on the other, then splits into four quadrants:
- Quick wins are high value, low effort. Ship these first.
- Major projects are high value, high effort. Plan, sequence, fund them properly.
- Fill-ins are low value, low effort. Address only if time allows.
- Thankless tasks are low value, high effort. Drop or repackage them.
The framework is fast and intuitive, which is why teams reach for it first. Where it fails in 2026 is that both axes hide compounding risks. “Effort” in an AI feature isn’t just build cost; it includes evals, monitoring, run cost, support burden, rollback complexity, and compliance review.
The fix is small but consequential. Rename the horizontal axis to “total cost to deliver and learn” and the vertical axis to “expected outcome lift for the eligible user segment.” That single rename changes which features land in the quick wins quadrant, because a “low effort” GenAI summary feature usually becomes “medium effort” once you cost the evals and the inference run cost honestly.
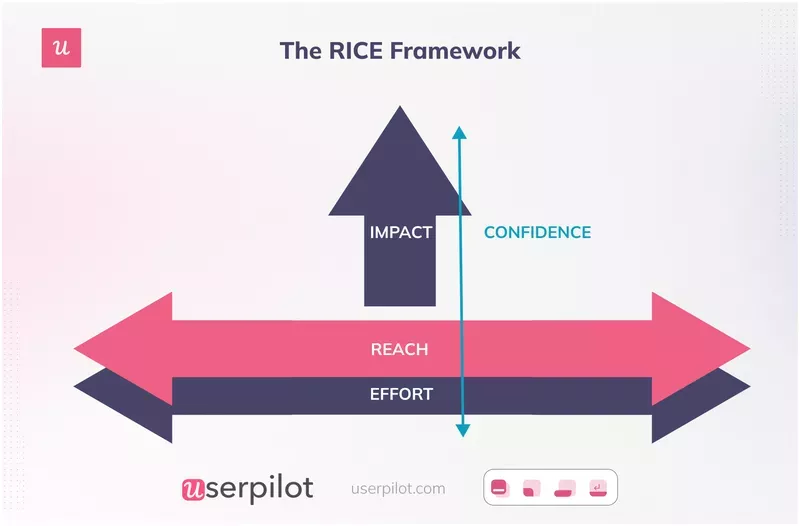
2. RICE method (with the eligible-reach fix)
The RICE method is the prioritization framework I see most often in real product teams. Intercom designed RICE to compare project ideas using explicit assumptions, scoring each on Reach, Impact, Confidence, and development effort, then dividing the product of the first three by the fourth.
Where RICE quietly breaks in 2026 is “reach.” Most teams plug in their total user base, which is usually wrong. The right input is eligible reach: the number of users who can actually use the feature given their plan, role, integration, and onboarding status.
Switching to eligible reach changes scoring meaningfully. A feature usable by 100% of users on a paid integration, inside a product where only 12% of users have that integration, has 12% eligible reach, not 100%. Plug the wrong number in and the RICE framework ranks the feature roughly 8x too high.
3. MoSCoW method (with the 60% Must cap)
The MoSCoW method, developed by DSDM Consortium, sorts features into four delivery-time buckets: Must have, Should have, Could have, and Won’t have this time. It’s strongest as a release-planning tool and weakest as a portfolio-ranking tool. Use it after you’ve already decided what to work on, not to decide what to work on.
DSDM is explicit about a guardrail that almost everyone ignores: Must have items should consume no more than roughly 60% of effort, with a healthy pool (often around 20%) reserved for Could haves as delivery contingency. Most teams I see inflate Musts to 90%+ and lose all contingency. When the inevitable surprise lands mid-sprint, the only thing left to cut is something already labeled mission-critical, which is how the prioritization process eats itself.
The 2026 fix is to keep Musts for legal, security, privacy, evalability, and truly PMF-critical enablers. Do not classify experimental AI delighters as Musts under any circumstances. The cost of a wrongly-labeled Must in an AI release is higher now, because rollbacks of GenAI features are messier than rollbacks of deterministic features.
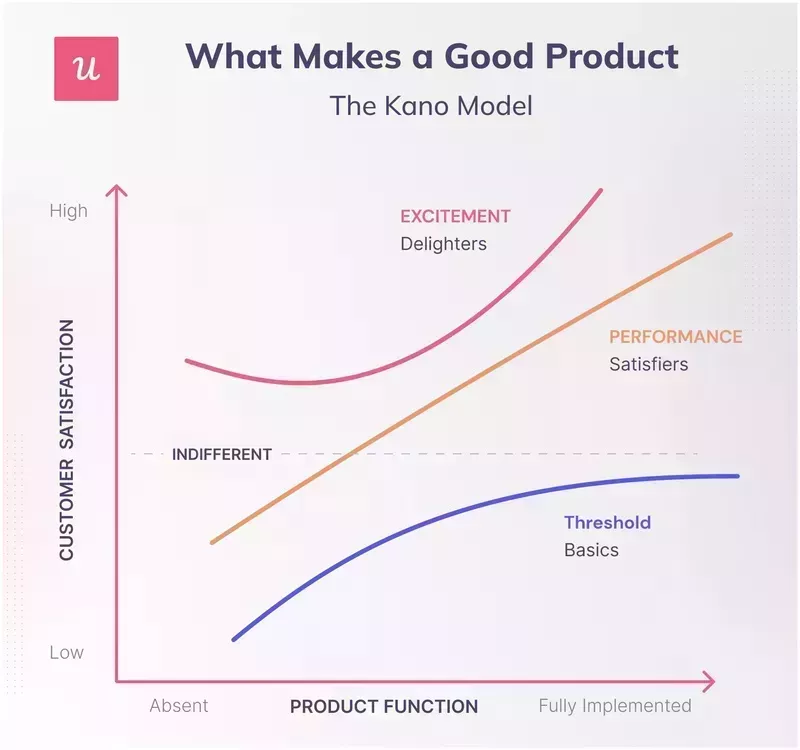
4. Kano model (with the reliability re-categorization)
The Kano model sorts product features into three categories by their effect on customer satisfaction: basic features (table stakes, get them right or the product is broken), performance features (satisfiers that scale linearly with quality), and delighters (excitement features that exceed expectation). Used well, Kano stops you over-investing in delight at the expense of reliability.
The 2026 fix matters more in AI products: reliability, controllability, privacy, and explainability are basic features now, not delighters. Treat them as table stakes. Score richer generation, autonomy, or multi-step reasoning as performance features or delight only after the basics are fully funded.
This re-categorization is what stops product teams from shipping a GenAI feature with an impressive demo and a 20% hallucination rate. A pretty demo wins the launch presentation but a hallucination loses the renewal conversation, because in an AI product the basics aren’t optional.
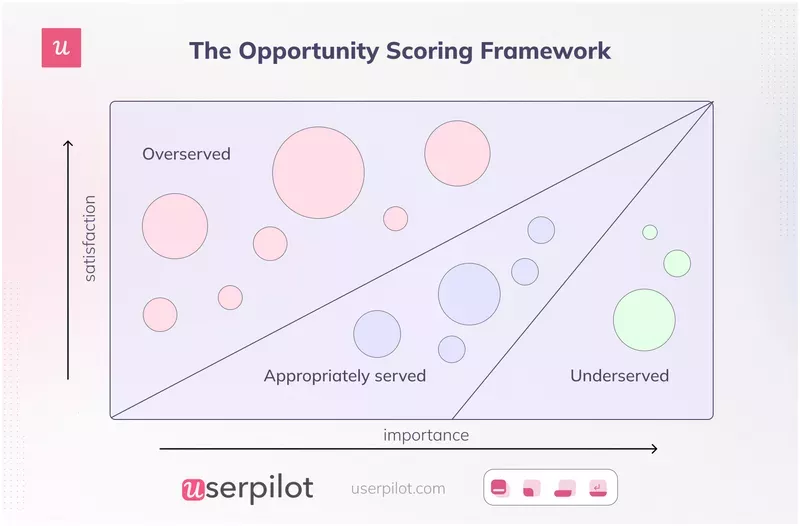
5. Opportunity scoring (Anthony Ulwick)
Opportunity scoring, developed by Anthony Ulwick, is the most customer-centric of the classic frameworks. It asks customer success teams to survey users on every feature along two dimensions: how important it is (1-10) and how satisfied they are with the current version (1-10). High importance combined with low satisfaction marks the highest-priority opportunity.
The framework’s strength is that it forces you to triangulate user feedback against revealed dissatisfaction, not just feature requests. Customer requests alone are notoriously incomplete because users ask for what they can name. Opportunity scoring surfaces what’s quietly broken but unnamed.
The 2026 caveat is that you need meaningful response volume to make the math work, which depends on having a working user feedback collection system in place. If you’re piecing answers together from sales calls and CS Slack threads, you’re not running Opportunity Scoring; you’re running anecdote-scoring with a numbered scale on top.
That’s the five-framework honest ranking. Use them if you’re triaging a small backlog and your potential features are roughly comparable along the same dimensions. The hybrid I’m about to propose is what to use when they’re not.
The hybrid feature prioritization model that actually works in 2026
No single prioritization framework survives a serious 2026 roadmap intact. The model I’d actually run on a real product layers four of these frameworks in sequence, with each one doing a different job: discovery, portfolio, sequencing, delivery.
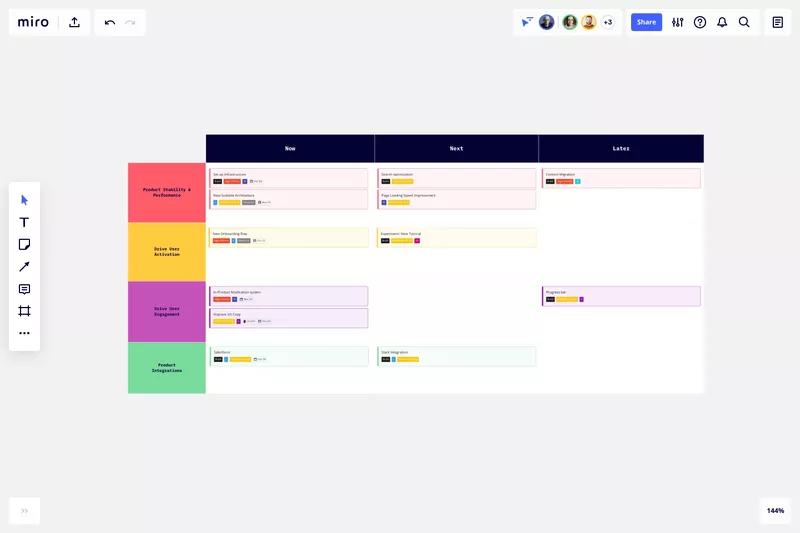
For discovery, use Opportunity Solution Trees (Teresa Torres, in Continuous Discovery Habits). Start with the business outcome you’re trying to move, map the customer opportunities (unmet needs, pains, goals) under it, generate three candidate solutions per opportunity, and define assumption tests before you build anything. OSTs keep the team outcome-led rather than feature-led, which is what kills feature-factory drift.
For portfolio decisions, use Weighted Scoring as the primary method. Most posts treat Weighted Scoring as one option among many, but in practice it’s the most flexible because the criteria are adaptable to your product stage and the right prioritization framework depends on your specific context. I’ll hand you the 15-criterion version I use in the next section.
For sequencing within a chosen area, use RICE with the eligible-reach fix, but only after Weighted Scoring has already narrowed the candidate set. RICE is good at “of these comparable items, which goes first?” and bad at “of these very different bets, which deserves capacity?” Use it inside a chosen area, not across the whole roadmap.
For delivery-time scoping, use MoSCoW with the 60% Must cap to preserve contingency. This is the layer where political fights happen, because every stakeholder wants their particular feature labeled Must have. The 60% rule turns Must-have inflation into a math problem you can point at on a whiteboard.
That sequence (OST, Weighted Scoring, RICE, MoSCoW) covers the four jobs the classic frameworks each try to do alone. Kano stays in the toolkit as a qualitative balance check at the end: are we over-investing in delight at the expense of basic features? If yes, re-fund the basics first.
If your prioritization tension is across time horizons rather than across candidates, McKinsey’s Three Horizons framework can sit alongside this stack as a portfolio-balancing layer, allocating resource optimization across immediate needs (Horizon 1), emerging opportunities (Horizon 2), and future-focused bets (Horizon 3).
💡 Read related blog posts: Key product prioritization frameworks for product teams
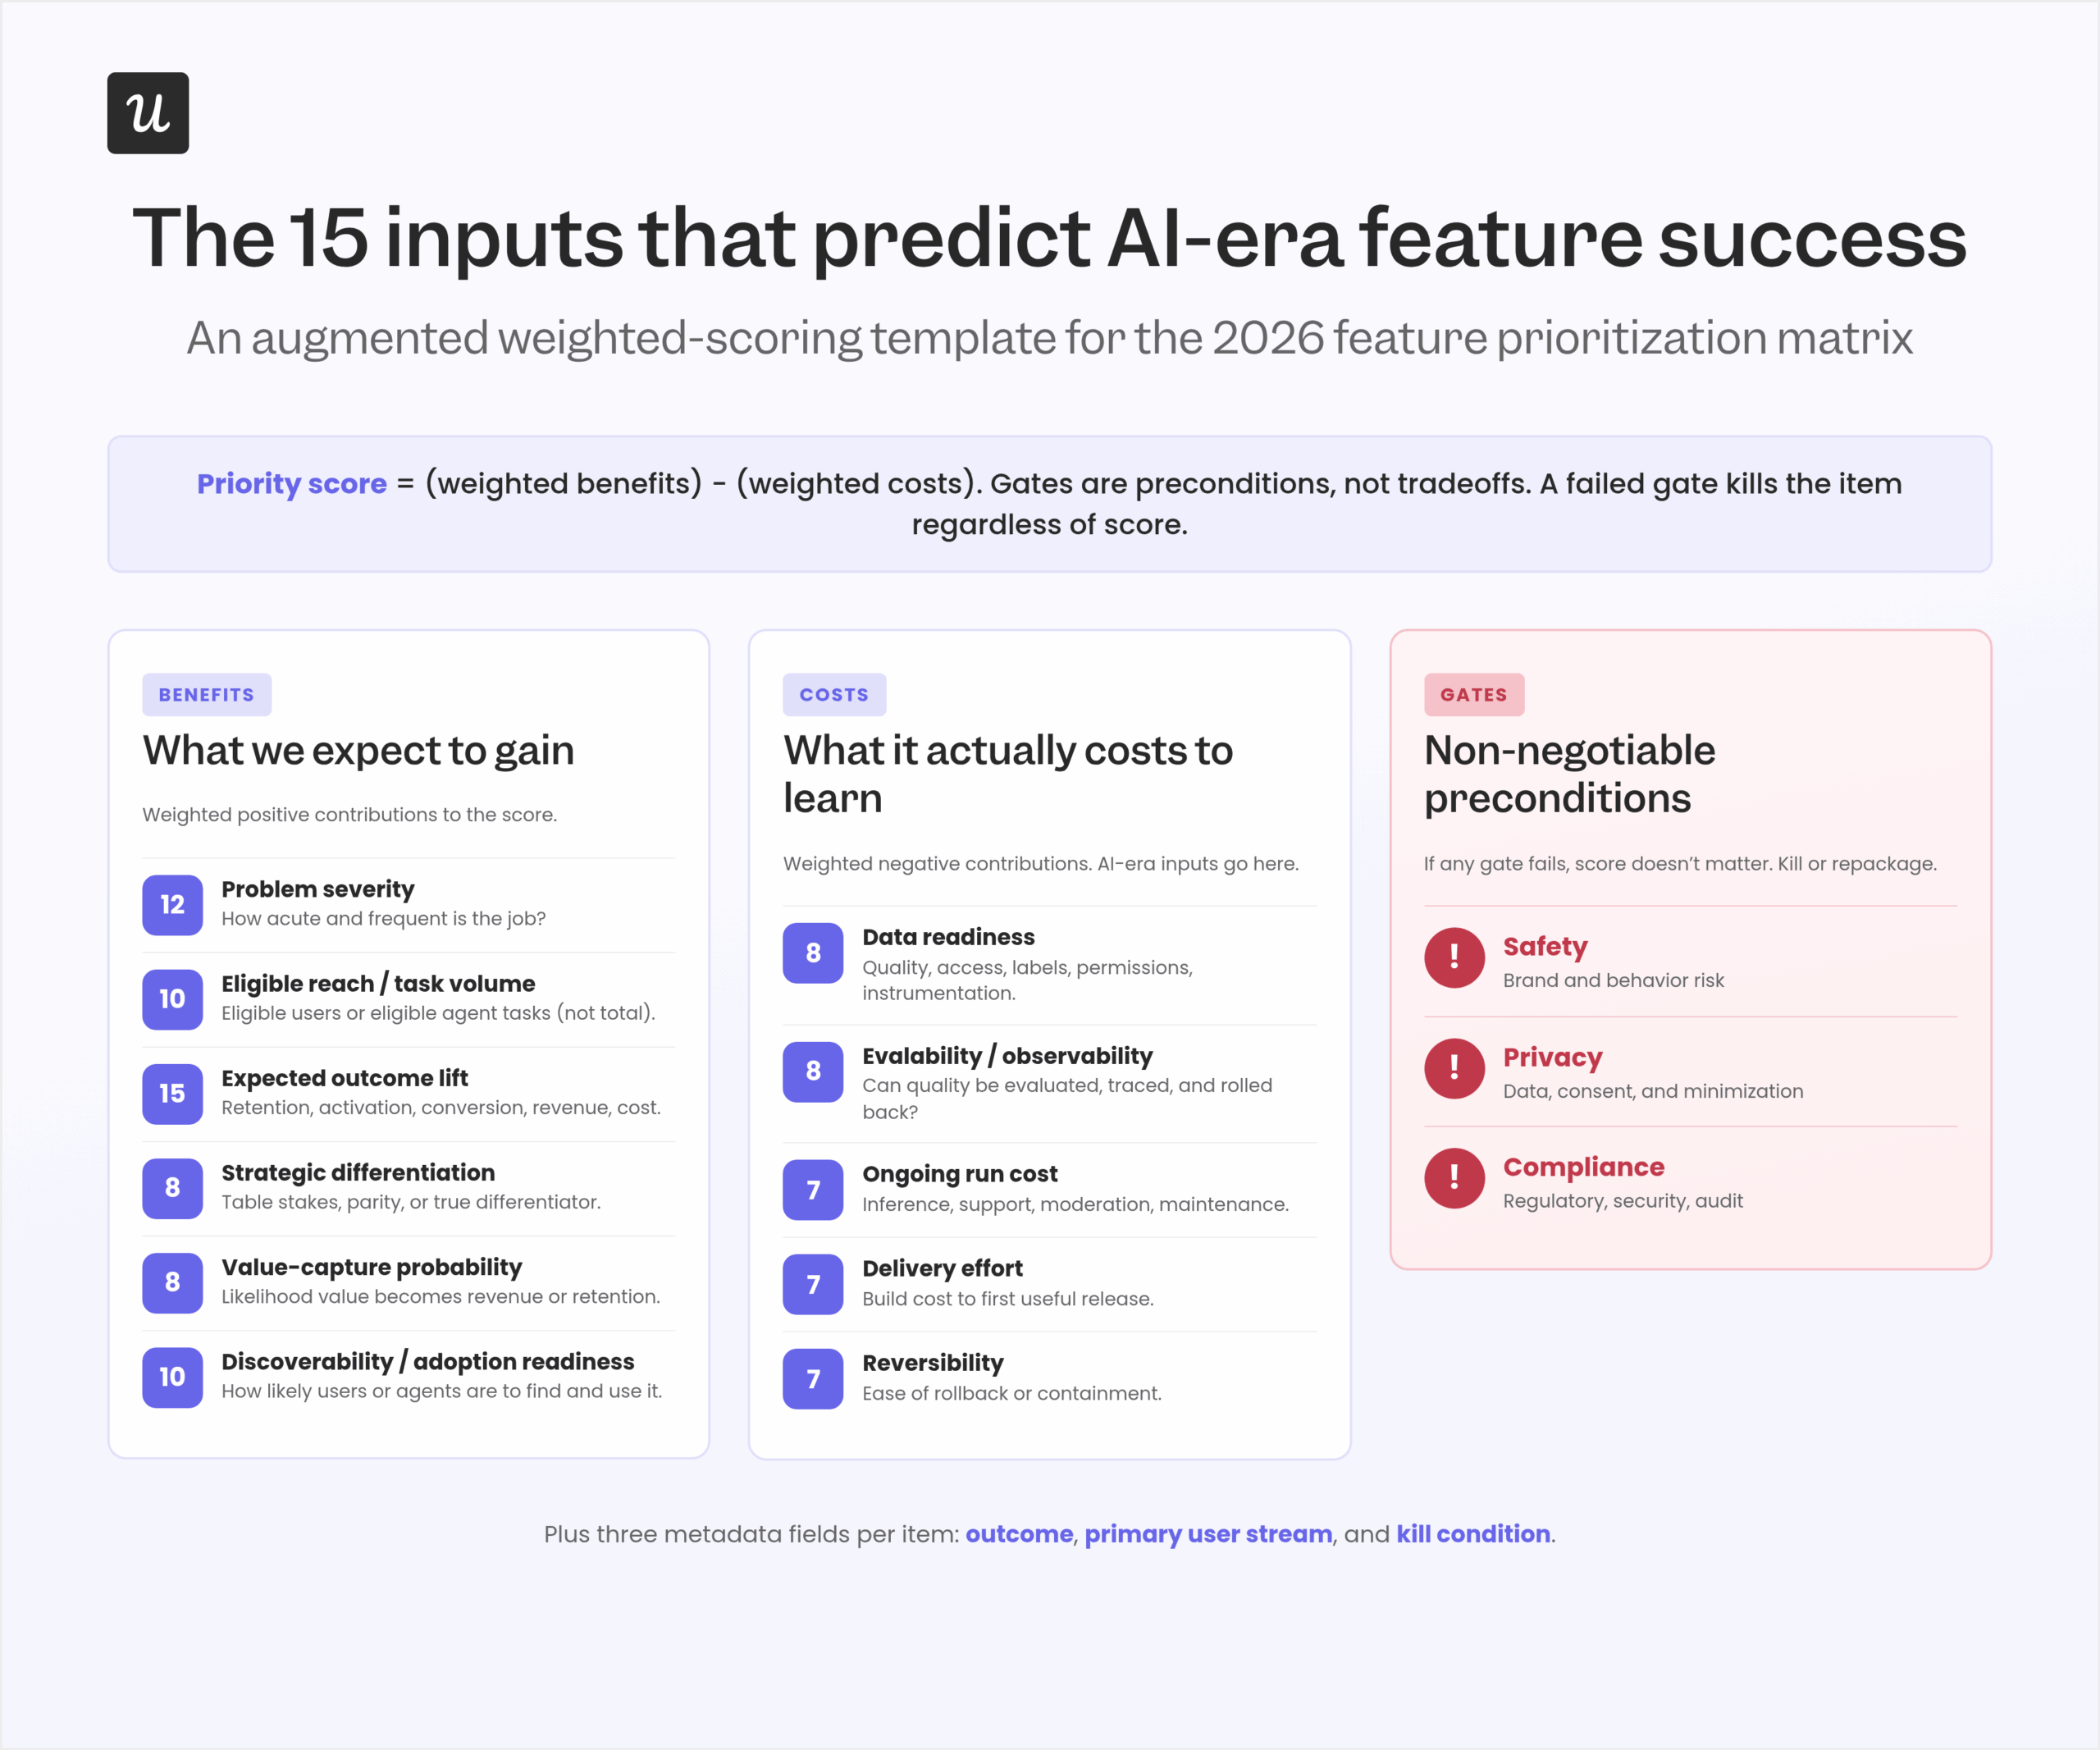
The augmented weighted-scoring template (15 criteria for AI-era prioritization)
Most online scoring system templates use four to seven criteria, and almost none include the AI-era inputs that actually predict whether a feature will succeed: data readiness, evalability, ongoing run cost, value-capture probability, kill condition. The 15-criterion template below adds those inputs without throwing out the original RICE intuitions.
I keep this in a Notion database with each field as a property, but Linear, Productboard, Asana, or a Google Sheet all work fine. Use whichever tool fits your team, because the discipline that matters is that every candidate feature gets the same fifteen passes before it earns a score.
Three buckets organize the prioritization criteria: Benefits, Costs, and Gates. Benefits and Costs receive weights and roll up into a score (weighted benefits minus weighted costs), while Gates act as non-negotiable preconditions, so a failed gate kills the item regardless of its score.
| Bucket | Field | What to capture | Weight |
|---|---|---|---|
| Metadata | Outcome | The business or product outcome this item is meant to move | n/a |
| Metadata | Primary user stream | Human, agent, or both | n/a |
| Metadata | Target segment / eligibility | Who can realistically use it now; define the denominator precisely | n/a |
| Benefit | Problem severity | How acute and frequent is the job or pain? | 12 |
| Benefit | Eligible reach / task volume | Eligible human users or eligible agent task volume, not total user base | 10 |
| Benefit | Expected outcome lift | Retention, activation, conversion, revenue, cost, or task-success improvement | 15 |
| Benefit | Strategic differentiation | Table stakes, parity, or true differentiator | 8 |
| Benefit | Value-capture probability | Likelihood the value translates into revenue, retention, or defensibility | 8 |
| Benefit | Discoverability / adoption readiness | How likely people or agents are to find and successfully use it without heavy friction | 10 |
| Cost | Data readiness | Data quality, access, labels, permissions, and instrumentation readiness | 8 |
| Cost | Evalability / observability | Can quality be evaluated, traced, monitored, and rolled back? | 8 |
| Cost | Ongoing run cost | Inference, support, moderation, vendor, and maintenance cost | 7 |
| Cost | Delivery effort | Build cost to first useful release | 7 |
| Cost | Reversibility | Ease of rollback or containment if adoption or quality disappoints | 7 |
| Gate | Safety / privacy / compliance | Regulatory, security, privacy, explainability, or brand risk | Hard gate |
| Metadata | Kill condition | When to repackage, pause, or sunset the feature | n/a |
A couple of notes on use. The score is a decision aid, not truth, so run sensitivity checks before treating the number as a decision: does the ranking flip if I change two weights by 10%? Confidence bands matter more than precision, because a feature scoring 78 with high confidence usually beats a feature scoring 82 with weak evidence.
The safety, privacy, and compliance gate deserves its own callout. Treat it as a precondition, not a tradeable attribute. If the gate fails, no score gets you out of it.
Here’s a fictional example using the template. Assume a generic B2B workflow SaaS product with a human UI, a public API, and a growing agent surface. Numbers are illustrative, not benchmark values.
| Candidate initiative | User stream | Summary of score pattern | Total | Decision |
|---|---|---|---|---|
| Agent-accessible approval action API | Agent + human | High severity, high eligible task volume, strong value capture, easy rollback, compliance manageable with scoped permissions | 78 | Prioritize now |
| AI-generated weekly project summary | Human | Medium severity, broad reach, good discoverability if surfaced well, moderate run cost, moderate evalability | 63 | Pilot with staged rollout |
| Autonomous workflow builder | Agent | Very high upside but low confidence, weak data readiness, high operational burden, hard rollback | 49 | Prototype only |
| New dashboard theme customization | Human | Low outcome lift, weak retention impact, low strategic differentiation despite low build effort | 31 | Deprioritize |
The interesting signal in this example isn’t the absolute scores but the variance in decisions across initiatives. Agent-API access ships first because eligible task volume is high, data is ready, and rollback is straightforward. Autonomous workflow building waits despite high upside, since data readiness is weak and rollback is expensive.
Mistakes that get worse when AI lets you ship faster
The classic prioritization mistakes (relying on customer feedback alone, gut feeling, team bias, ignoring multiple stakeholders) all still apply in 2026. AI made every one of them more expensive to repeat because the cost of shipping the wrong thing dropped. Three failure modes get particularly louder.
Treating customer requests as a roadmap
Customer requests and feature requests are valuable signal but a terrible roadmap. Users ask for what they can name, and they tend to name features they’ve seen in other products. The job of the product manager is to triangulate the request with product analytics data, support patterns, and revealed dissatisfaction (Opportunity Scoring), then design a solution to the underlying problem.
A worked example from my own work: when we shipped Userpilot’s email feature, the prioritization process said the next item on the roadmap was an advanced templating engine. Customer feedback asked for richer templates. The funnel told a different story entirely.
Inside Userpilot’s product analytics, I saw a sharp drop-off at domain verification: users hit the verification step and a large share never completed it. The “advanced templates” feature would have done nothing for those users, since they’d never reached the templates step. Within a few hours I created a targeting tooltip directly inside Userpilot, highlighted the correct verification steps, and the drop-off closed within days.
That fix never went through the feature prioritization matrix, and it didn’t need to. The funnel showed me where the friction sat, and Userpilot Workflows shipped the solution in hours without an engineering ticket. Realizing that the next thing on the backlog is sometimes a tooltip rather than a build is one of the biggest unlocks the AI era has handed product managers.
Inflating “Must have” until it eats your contingency
I mentioned the MoSCoW 60% rule earlier and it deserves a second mention here as a mistake, not just a guardrail. Most teams I work with classify 80-90% of release scope as Must have, which means Should have and Could have are decorative. When something inevitably goes sideways mid-sprint, the only thing left to cut is something already labeled mission-critical, and the team ends up either missing the release or shipping unfinished work labeled “Must.”
The fix is mechanical. Cap Musts at 60% of effort, reserve roughly 20% for Coulds, and require evidence for every Must classification (legal requirement, security gate, named PMF dependency, evalability blocker). In AI features specifically, the generative output is almost never a Must, although the eval suite and the rollback flag almost always are.
The deeper mistake here is treating prioritization decisions as fixed at the start of a release, when in reality they aren’t. Re-rank weekly, because the data from the last shipped feature is the best input you have for the next one.
Letting bias and “I built this” win the close calls
Every PM I know has a feature they personally championed that turned out to be a 6.4% statistic. Personal bias is the hardest input to filter out of the prioritization process, especially when multiple stakeholders in the room defer to whoever has the most senior title.
The structural fix is to bring multiple stakeholders into the scoring itself, not just the meeting: development team for development effort estimates, customer success teams for adoption-friction reads, sales for value-capture probability, support for run-cost realism. Procedurally, write down the kill condition before launch as a falsifiable threshold that, if hit, kills or repackages the feature.
Teams that write down the kill condition before shipping are also the teams that actually kill the feature later when the threshold is hit. When teams skip that step, they always find a reason to keep “iterating” instead of pulling the plug. This is one of the very few prioritization techniques where the discipline matters more than the framework.
After prioritization: validate, roadmap, monitor both streams
Prioritization is a guess that earns the right to be tested. Once a candidate makes it through the scoring, the next moves are validation, roadmap placement, and monitoring, and all three jobs look different in 2026 than they did in 2022. The shape of each one matters more than the order.
Validate before you build
For validation, the cheapest test is still a fake door experiment: a fake CTA, button, or feature description placed in front of real users to measure click-through interest. If the fake door earns meaningful click-through, escalate to a low-fidelity prototype test with 5-10 target users and a structured task brief. The lower the fidelity at each step, the lower the cost of being wrong.
For AI features specifically, the equivalent of a prototype is a feature validation framework that includes an eval suite. Define the success thresholds for intent resolution, hallucination rate, and latency before you ship anything, then run those same evals against a held-out test set on every release going forward.
Place it on the roadmap with the right granularity
The product roadmap is the artifact most stakeholders see, and it’s the place prioritization mistakes get permanent. Your 2026 roadmap should be outcome-led, not feature-led, with each item paired to the outcome it’s meant to move, a target metric, and a kill condition. Communicating those choices clearly back to product strategy using both quantitative scoring and qualitative reasoning is how you get strategic alignment across the org.
I’d recommend outcome-based product roadmaps over feature lists for one specific reason: outcomes survive AI release velocity. A feature roadmap shipping 7-9 features per quarter becomes unreadable within a month, while an outcome roadmap that names 4-5 outcomes per quarter is still readable in October.
Monitor both streams after launch
This is where most feature prioritization frameworks stop and where the real work actually starts. Once a feature is live, the question shifts from “should we build it?” to “is it working for each user stream, and how do we tell?” Answering that requires two dashboards, not one.
For the human stream, monitor eligible MAU adoption, time-to-first-use, activation rate, repeat use, depth of use, and step-level drop-off. These are the same metrics that surfaced the email-feature domain-verification fix I described earlier, and they’re the bread and butter of feature adoption work.
For the agent stream, the metric set is different: task completion, intent resolution, tool-call accuracy, authentication success, latency, failure-mode mix, human intervention rate. Userpilot’s AI Agent Analytics was built for this view, because plotting agent activity on a human-clicks dashboard reads as either zero usage or unexplained noise.
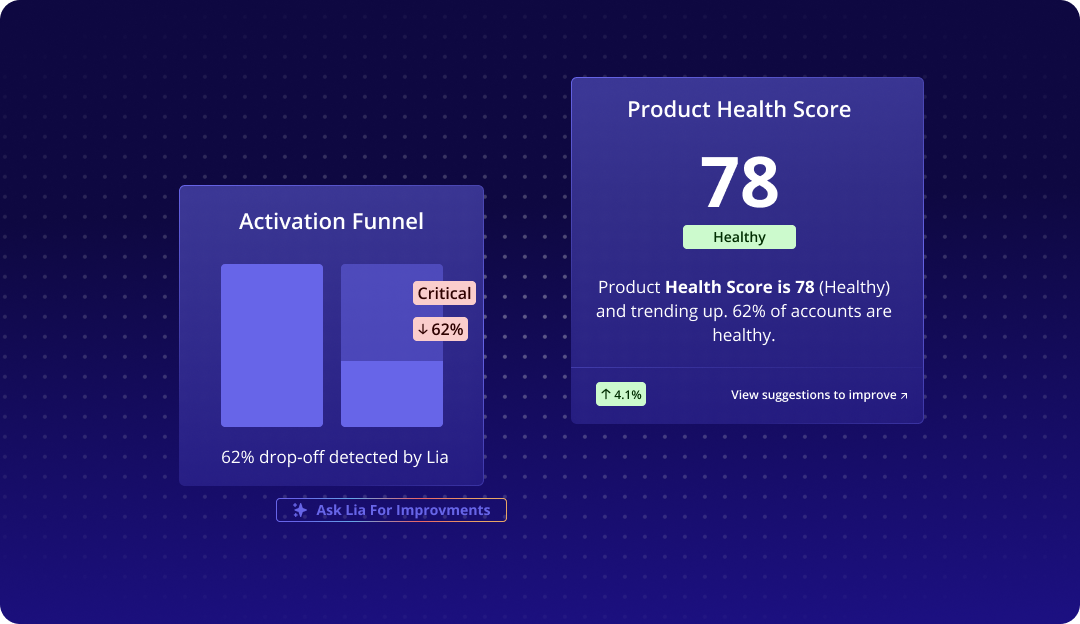
I’d also recommend running an always-on monitoring layer across both streams. Userpilot’s AI agent Lia flags adoption drops, churn-risk signals, and feature-health regressions proactively, so the product manager sees the problem before the next prioritization meeting rather than three months later in a QBR.
Run the prioritization meeting on a cadence
One last operational point. A reasonable cadence in 2026 is weekly release-risk review, monthly signal review, and quarterly portfolio refresh. The cadence matters less than the willingness to actually re-rank candidates with new data each time.
A weekly review keeps batch sizes small, which DORA’s research connects directly to delivery stability. The monthly view catches cohort-level adoption signals and slice-level AI quality regressions that the weekly cadence misses. Quarterly is where you re-weight the scoring criteria themselves, because the right weights in Q1 are rarely the right weights in Q4, and business objectives change faster in 2026 than scoring sheets do.
Turn your feature prioritization matrix into a 2026-ready process
The feature prioritization matrix isn’t dead in 2026, but its inputs are. Classic frameworks (RICE, Value vs Effort, MoSCoW, Kano, Opportunity Scoring) still earn their place, but only after a re-tooling that adds eligible reach, data readiness, evalability, run cost, value-capture probability, and a hard governance gate. Use a layered hybrid (Opportunity Solution Tree for discovery, Weighted Scoring for portfolio, RICE for sequencing, MoSCoW for delivery contingency), classify every candidate by user stream before scoring, and re-rank weekly.
If you want to see how Userpilot helps you collect the customer feedback, product analytics, agent activity, and AI eval signals that feed a 2026 prioritization process, book a demo.
About the author