Churn Rate vs Retention Rate: Formulas, Benchmarks and Ways to Improve
Wondering how churn rate vs retention rate are different?
Both metrics are important to track if you want to implement a successful product retention strategy.
In this article, we will cover:
- Formulas to calculate each of these metrics.
- Other important metrics related to churn and retention efforts.
- Ways to analyze churn and improve retention rates based on the data.
Try Userpilot Now
See Why 1,000+ Teams Choose Userpilot

What is the churn rate?
The churn rate is the rate at which customers stop doing business with a company over a given period of time.
An increasing customer churn rate is a sign of a flawed product or service that is leaving customers dissatisfied. Inevitably, this hits your bottom line, and your revenue decreases.
How to calculate the churn rate?
There are two main types of churn, namely, customer churn and revenue churn. As is obvious from the names, each churn rate focuses on different avenues of company growth, i.e. customer or revenue.
Let’s look at these churn rates in greater detail and understand how to calculate them.
Customer churn rate formula
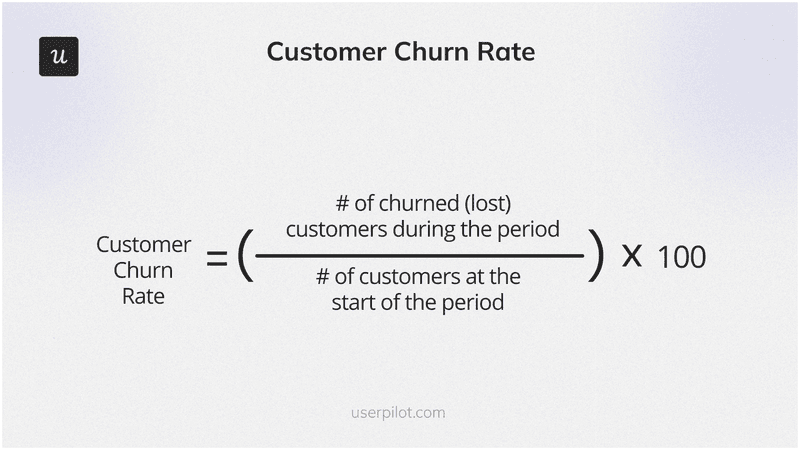
To calculate the churn rate, divide the total number of customers lost by the total number of customers present at the start of a time period. Multiply by 100, and you’ll have the percentage of customers churned.
Suppose you had 200 customers at the start of October. During the month, 30 customers left and ended their subscriptions. Using these numbers, your customer churn rate is (30/200) x 100 = 15%.
Revenue churn rate formula
The revenue churn rate calculates how much revenue was lost during a given period. Revenue churn generally occurs for two reasons: existing customers pause their subscriptions or downgrade their plans.
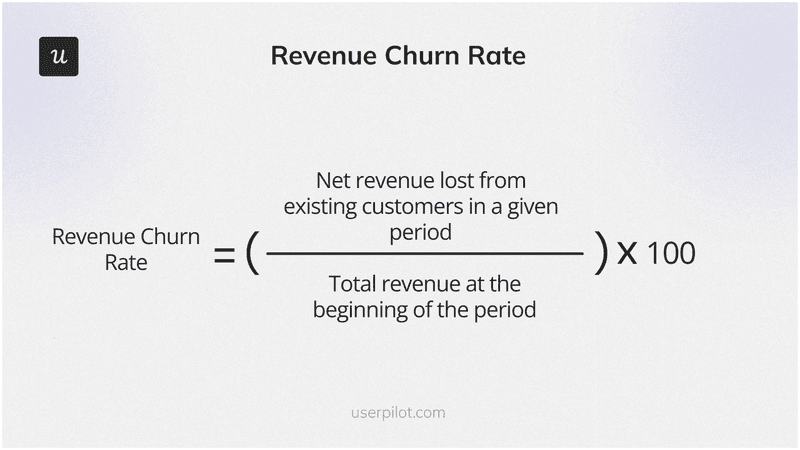
To calculate the revenue churn rate, first estimate the total revenue at the start and the end of a given period. Then subtract the two to get net revenue lost. Then divide the lost revenue during that period by the total revenue at the start of the period.
Let’s say your revenue from existing customers at the start of January was $25,000. By the end of December, you’re left with a revenue of $22,000. Plugging these numbers into the formula, your annual churn rate is (3,000/25,000) x 100 = 12%.
What’s a good churn rate in SaaS?
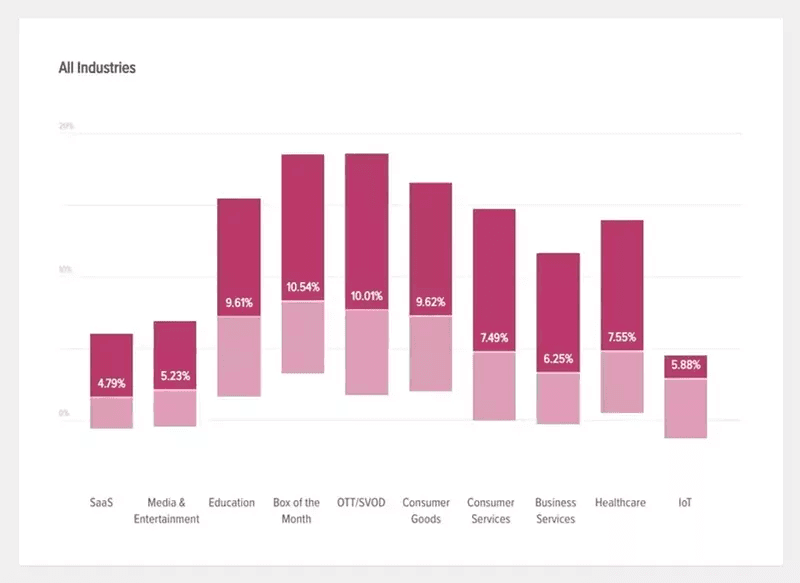
There is no universally ‘average’ churn rate. The average churn rates differ greatly across different industries and companies. Moreover, a good or bad churn rate also depends on what growth stage and product lifecycle your company is in.
As a general rule, a 5% to 7% annual churn rate and around 1% or less monthly churn are considered acceptable churn rates for established SaaS companies.
As opposed to this, early-stage startups will understandably have a higher churn rate, since they still may not have product-market fit yet. For them, an average annual churn of 10% to 15% is considered good.
What is the customer retention rate?
Customer retention is the percentage of customers who made repeat purchases during a given time period.
The entire business model of SaaS companies is built around retaining customers for the long run, thus increasing customer lifetime value and monthly recurring revenue.
How to calculate the retention rate?
Calculating the retention rate is pretty straightforward.
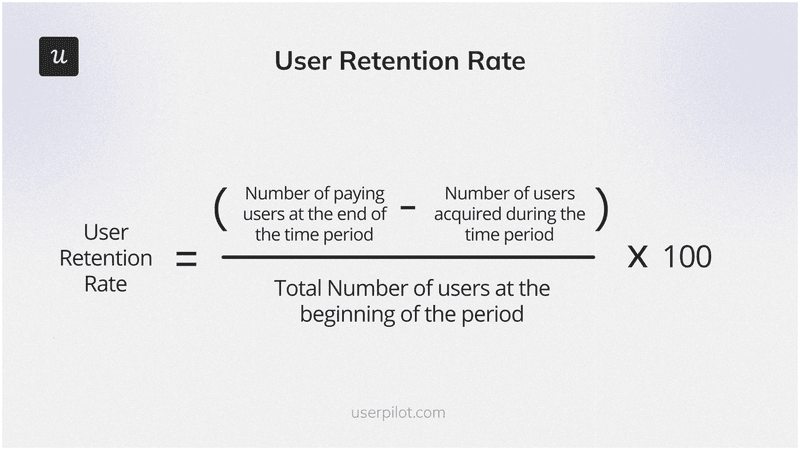
you need to subtract the number of paying customers at the end of a specific time period from the number of customers acquired during that same period. Then divide this number by the total number of customers at the start of the period. Multiply by 100, and voila, you have the customer retention rate.
Suppose your company has 80 customers at the start of June. You lose 25 but acquire 10 new customers in the same month. Using the formula, your customer retention rate is: ((65 – 10) / 80 )) x 100 = 68.75%.
What’s a good customer retention rate?
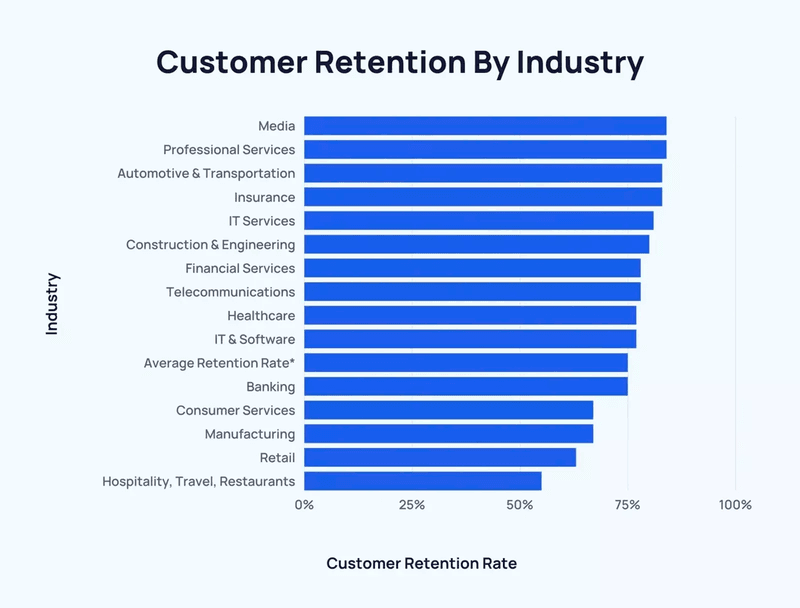
Similar to churn rate, there isn’t any set rule that defines what a good retention rate is. Typically, what is defined as good will depend on your industry and your company’s growth stage.
Newer SaaS companies are naturally going to have lower retention rates. Whereas for established ones the average customer retention rate is as high as 90%.
Research by SaaS Capital provides further proof of such high retention rates, reporting a median net retention rate of 102% and a median gross retention rate of 91% across SaaS companies.
Churn rate vs retention rate: What’s the difference and which should you track?
Customer retention rate and churn rate are basically two sides of the same coin. The churn rate shows how many customers your company lost during a period, while the retention rate shows how many customers it managed to keep.
For both metrics, businesses aim to be as close to one extreme as possible: 0% for the churn rate and 100% for the retention rate.
Both metrics are also similar in that they give insights into customer satisfaction. A high customer retention rate shows that customers are happy with the value you’re providing. Conversely, a high churn rate suggests the exact opposite.
Having such insights is helpful when formulating new customer success strategies.
In conclusion, it’s important to track both if you want comprehensive data.
How to make sense of customer churn and retention data?
Simply calculating customer churn and retention rates isn’t enough on its own. You also need to know how to properly read the results to be able to put them to good use. That’s where customer churn analytics comes in.
There are several ways you can interpret customer retention and churn data. Below, we dive deeper into three of these methods.
Conduct cohort retention analysis
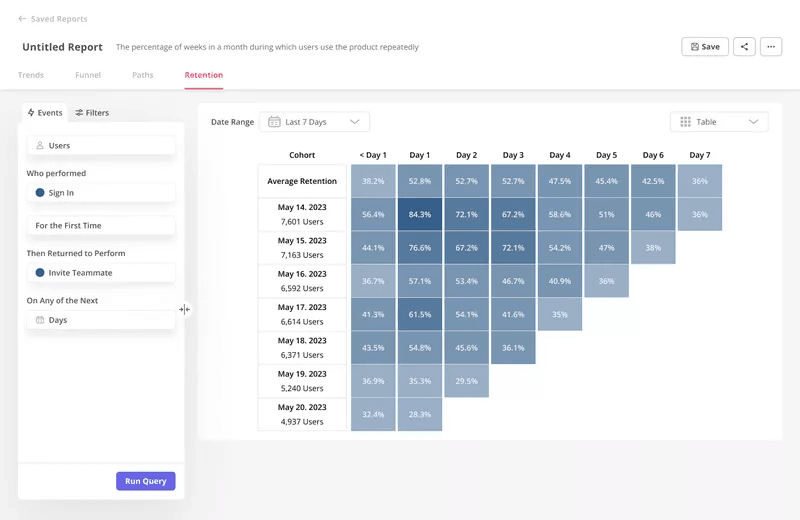
Cohort analysis enables you to study how different user segments engage with your product over time. Couple this analysis with the use of retention tables, and you’ll be able to look at retention trends for several periods.
Once you’ve uncovered user behavior trends, you can easily use these to improve your retention strategy and increase retention rates.
Cohort retention analysis helps pinpoint where and when retention takes a hit, and churn rate goes up so you can proactively act on data and improve these metrics.
Analyze churn with path analysis
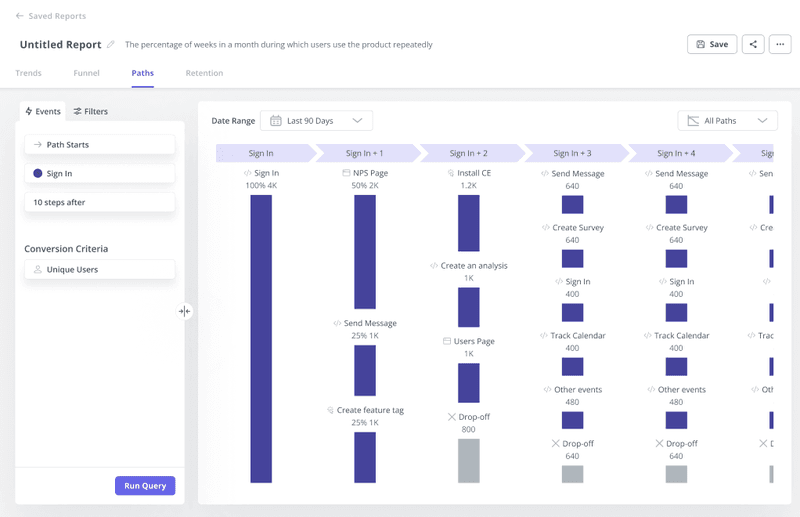
You can identify and prevent churn with reverse path analysis.
This is basically looking at the steps users take before churning and identifying patterns that lead to churn.
That puts you in a position to act on data and adjust your retention strategy to engage with users fast and put them on a different path before they churn.
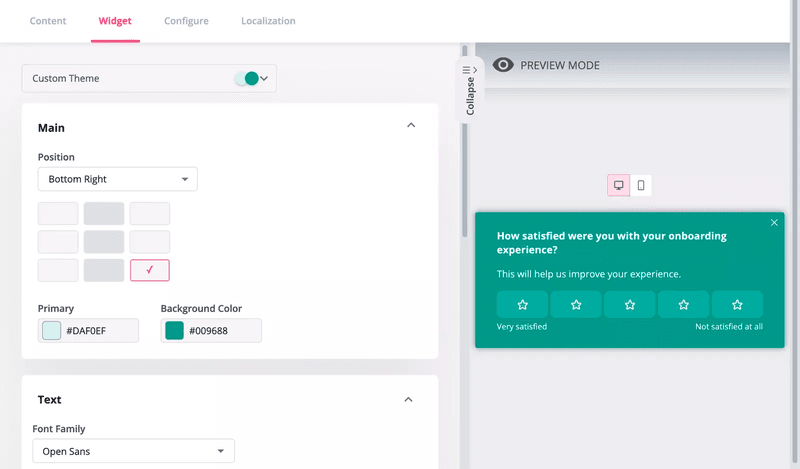
Understand churn with customer satisfaction surveys
Customer feedback is vital to help grow retention rates. If you know what customers think, only then can you design your offering accordingly to improve customer satisfaction.
An easy way of collecting such feedback is by setting up customer satisfaction surveys in-app.
You can set up triggers for satisfaction surveys throughout the customer journey. This will enable you to identify the touchpoints that leave your customers frustrated and fix them to drive repeat purchases.
Track main reasons for churn with exit churn surveys
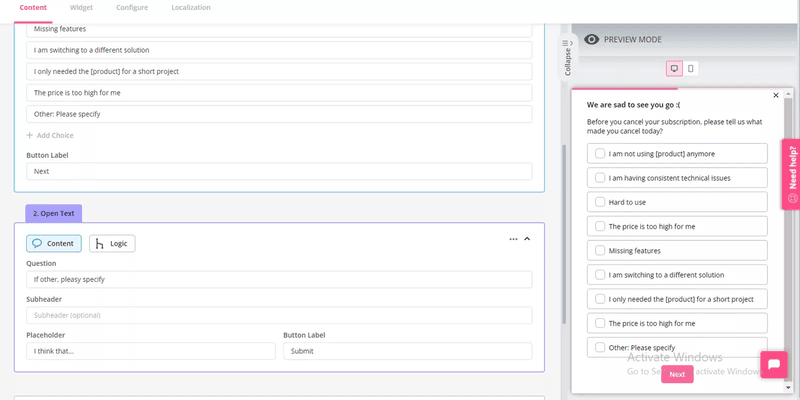
To reduce churn rates, first, try to understand why customers are leaving.
Do this by simply triggering cancellation surveys for churning customers and asking them the reason behind their decision.
Offer multiple answer options in your survey so you can see which ones rank the highest. Add an open-ended follow-up question, too, for deeper insights.
How to act on data to reduce churn and improve retention rates
Finally, it is time to put all the churn analytics into use to reduce your churn and increase your retention rate.
You can take several concrete steps in order to do that. Some of these include introducing user onboarding to further help customers, focusing on feedback, and providing proactive in-app support. Below, we discuss all of these in greater detail.
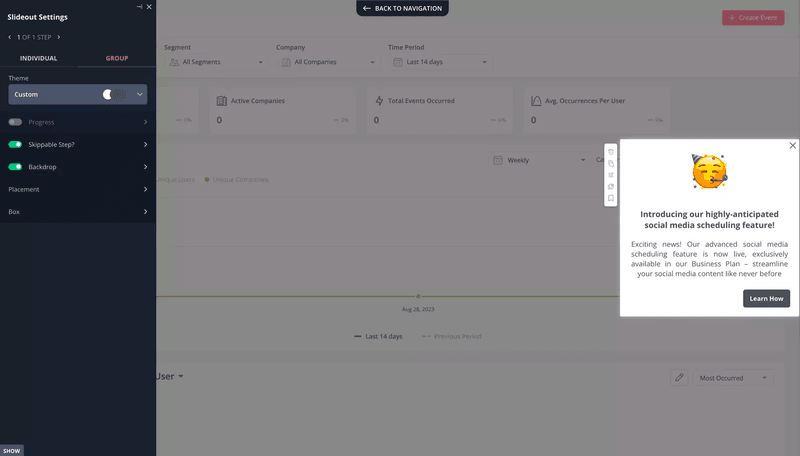
Implement secondary onboarding to retain existing customers
Onboarding isn’t just for new customers.
Rather, it’s a continuous process because all customers need guidance at different points in their journey.
For example, a newly launched feature might not be as easily understandable as you thought. It could cause friction and lead to churn. To solve this issue, you should create a feature onboarding flow to teach customers how to use it effectively.
Close the feedback loop to improve customer satisfaction
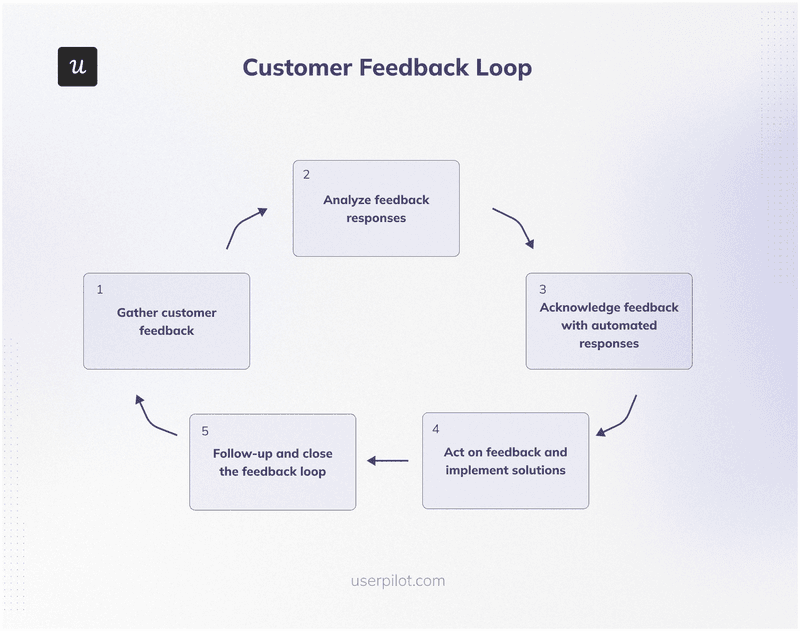
Collecting feedback isn’t enough. You also need to follow up on feedback and act on it to close the loop.
Closing the feedback loop can look like getting back to customers about updates you’ve made based on their suggestions, explaining to them why you can’t implement their feedback, or simply acknowledging that you’ve received it.
This is an important step most companies forget about. Closing the loop helps build user trust and improve satisfaction, which in turn results in a better retention rate.
Offer proactive in-app support to remove friction
Having a great customer support team is necessary. But it’s also necessary to provide customers with the resources needed to troubleshoot independently. This way, customers benefit from having the problem solved quicker, thus reducing any user friction.
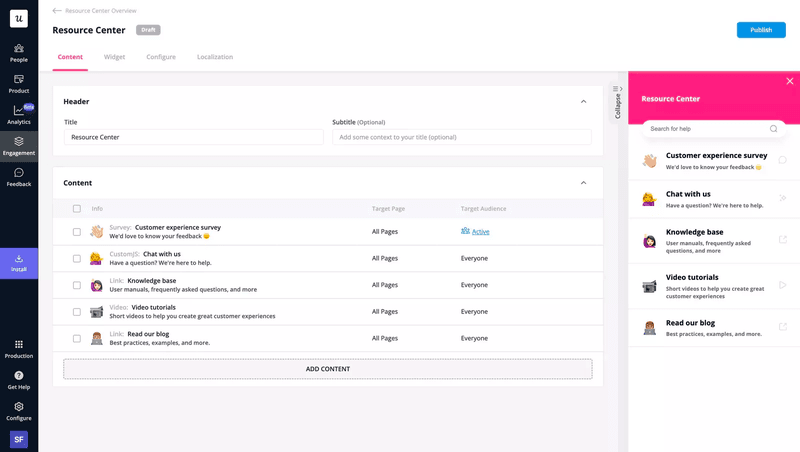
Make this happen by introducing an in-app resource center for quick and easy customer support.
Embed multiple types of help materials and tips in there so customers have different options to choose from.
Conclusion
Understanding and effectively managing churn rate vs retention rate is crucial for business success.
By focusing on tracking and improving both, you can enhance customer lifetime value and drive sustained revenue growth.
Want to get started with churn management? Get a Userpilot Demo and see how it can help you with improving your retention rate.


