Core Feature Adoption Rate: Benchmark Report 2024

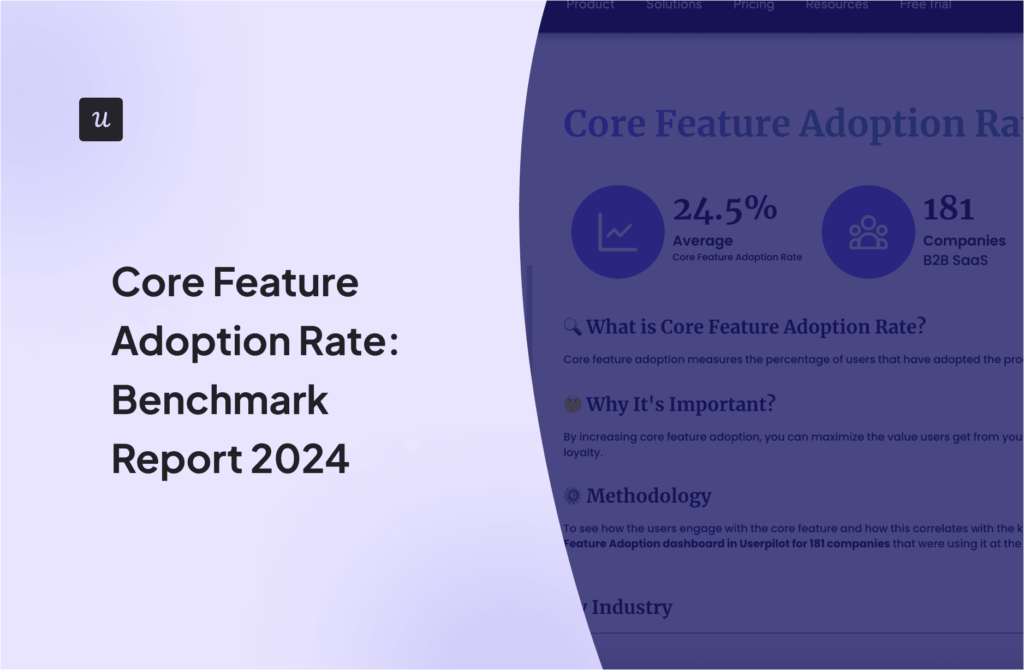

24.5%. That’s the average core feature activation rate across the companies we studied for our Product Metrics Benchmark Report 2024.
This figure doesn’t give you a full picture because it doesn’t take into account the industry, company size, or acquisition model.
Fear not, though, as we explore the data in more depth in this article. We also look at ways to improve the core feature activation rate for your SaaS product!

Summary of core feature adoption rate for our Product Benchmarks Report 2024
- The data about core feature adoption rates comes from 181 companies.
- The average adoption rate across all sectors was 24.5%, and the median was 16.5%.
- The highest adoption rates were recorded in HR products (31%), while the lowest was in healthcare, FinTech and Insurance products (22.8% and 22.6% respectively).
- Companies with annual revenue of $5-10M had the best results (30.4%) and the adoption rates decreased once companies passed $10M.
- Sales-led companies had higher core feature adoption rates than product-led ones (26.7% vs. 24.3%).
- To increase feature adoption, use onboarding checklists and interactive walkthroughs. Track user behavior and adoption trends to find friction in the user journey and optimize the onboarding processes.
- Want to learn how to do it in Userpilot? Book the demo!

What is the core feature adoption rate?
The core feature adoption rate describes the percentage of users who have adopted the key features necessary to realize the product value.
To calculate the adoption rate, you first need to define adoption. This could be using feature X times, for example, sending 200 messages in an instant communicator or scheduling 50 posts in a social media management app.
Once you know it, divide the number of users who meet the adoption criteria by the total number of users. So, if 350 of your 1000 users use a feature regularly, the adoption rate is 35%.
Why is the core feature adoption rate important for SaaS businesses?
High core feature adoption rates indicate that customers find value in a product. This is essential for their satisfaction and long-term retention.
Moreover, customers who adopt key functionality, are more likely to appreciate the benefits of more advanced features. And upgrade to premium plans or purchase add-ons to access them.
Core feature adoption data can also guide product development. By showing product teams what features customers value, it allows them to make better-informed prioritization decisions.
Finally, tracking trends in feature adoption can help you identify issues with the onboarding process. If you can see the figures stagnate or decline, it could be evidence that your current practices aren’t adequate.
What is the average core feature adoption rate?
The average core feature adoption rate across 181 companies we studied over the past year was 24.5%. And the median – 16.5%.
The 24.5% is considerably higher than the 11% reported by Pendo in the product benchmarks report. Could this be because Userpilot customers are better at designing effective onboarding experiences?

Average core feature adoption rate by industry
With the core feature adoption rate of 24.8%, Artificial Intelligence & Machine Learning SaaS companies were the closest to the average.
FinTech and Insurance companies had the lowest core feature adoption rate (22.6%), while HR products had the highest (31%).
What could be the reasons for that?
HR tools are essential for managing companies’ daily processes, like payroll, and ensuring compliance with labor laws and regulations.

Average core feature adoption rate by company size
When we break down the data by company size, expressed as annual revenue, we can see that businesses from the $5-10M bracket have the highest adoption rate (30.4%).
Such companies have sufficient resources and have been around long enough to have fine-tuned their onboarding processes.
However, if that’s the case, why are the larger companies (10M+) less effective at driving adoption then?
We can speculate that once companies reach 10M in revenue, they become less agile and adaptable, which makes it hard for them to respond to changes in customer needs.

Average core feature adoption rate by PLG and SLG
Sales-led companies we studied turned out to have higher adoption rates than product-led companies (26.7% vs. 24.3%).
At first sight, this is a bit of a shocker. After all, PLG businesses are believed to be more customer-centric than SLG ones. Moreover, their ability to monetize the product depends on how well they can lead users to activation and adoption.
But here’s the thing:
When companies commit to a product and pay for it upfront, as is the case in the SLG model, they have no choice but to adopt it. There’s way more motivation to get the value out of the product than if they were on a free trial or freemium plan.

How to improve the core feature adoption rate?
When asked this question, Nimrod Priell, the CEO at Cord, said that customers tagging their teammates in comments were the biggest drivers of core feature adoption.
But by far the most effective for us, as a “social” product, is when other users leave comments @mentioning their teammates.

Cord’s tactic is very product-specific. Here are a few more general strategies that you can use to drive feature adoption for most SaaS products.
Use a checklist to guide new users to your key features
Checklists hinge on a powerful psychological process to drive action: people find it difficult to move past a task until it’s completed. And the closer they are to the end, the stronger the pressure to see it through.
So creating a list made up of features that you’d like your users to adopt and triggering it at the onboarding stage increases the likelihood they engage with them.
Especially if you add a progress bar to the list to reinforce their sense of achievement.

Couple your checklists with interactive walkthroughs to make sure users adopt the feature
Checklists provide a structure for the onboarding process but don’t always offer enough guidance to teach users how to use the features.
The solution?
Link each checklist task with an interactive walkthrough. This is an onboarding flow made up of a sequence of tooltips and driven actions that show users how to complete a task step by step.

Analyze what percentage of your users adopt the feature with cohort analysis
Cohort or retention analysis enables you to track how users from different groups adopt a feature.
This is useful for comparing adoption trends over time and evaluating the impact of changes to the onboarding processes.

Host webinars to showcase feature usage and advanced use cases
Webinars are a great tool for introducing new features and driving their adoption.
Simply, design a series of webinars covering your new features and their applications.
Start with a general one, like the one on new analytics features we ran in October last year.
Next, focus on specific customer problems and how the product features solve them.

Quickly identify and fix any friction points
Friction slows down feature adoption and, in some cases, prevents it altogether. Users get discouraged by poor UX design and usability issues and simply give up.
You can address such issues by tracking user behavior inside the product and analyzing it for patterns that could indicate friction.
For example, if your funnel analysis reveals users drop off in the middle of an onboarding flow, you know exactly which step you need to redesign to improve conversions.

Conclusion
The core feature adoption rate is one of the product success metrics. If customers use your key features regularly, they find them valuable. Conversely, if the adoption rate is low, it means the product doesn’t satisfy their needs, and you’ll struggle to retain them in the long run.
If you want to learn how to increase your feature adoption rate with Userpilot, book the demo!
![]()
Try Userpilot and Boost Your Feature Adoption to the Next Level

About the author