
Wondering how you can improve the product adoption rate of your SaaS business? And what product adoption metrics should you track?
Without product adoption, your new users will remain stuck in the activation stage, and there will be no growth. As users adopt more and more features down their journey and continue getting value from them, they become loyal and profitable customers.
So, let’s look at how you can track and improve your product adoption metrics to drive growth.
Get The Insights!
The fastest way to learn about Product Growth, Management & Trends.
What is product adoption in SaaS?
Product adoption refers to the progression in which individuals become familiar with your product or application and begin utilizing it to achieve their objectives.
The concept of product adoption is typically set apart from activation, as activation is a single event: users hit a milestone in your product and experience value that shows them your tool will be worth their time.
On the other hand, user adoption happens when the user completely embraces your product as the habitual solution to the specific problem they’re solving.
Why you should measure and improve product adoption?
The product adoption rate is one of the most crucial metrics for all SaaS companies. However, it’s often easily overlooked and confused with customer acquisition.
In fact, retaining an existing customer is between 5 and 25 times less expensive than acquiring a new one.
Product adoption is the complete opposite of customer churn. When customers churn, they are determined to leave your product because it fails to deliver value.
Therefore, it’s critical to give continuous value to customers, so they adopt your product and become repeat, long-term customers.
Thus, the higher the product adoption rate, the higher the customer retention.
Moreover, adopted customers are the perfect targets for your revenue expansion strategy via upsells, new features, and cross-sells.
How to measure product adoption rate?
The product adoption rate tracks how many customers actively use your product, as opposed to just activating or downloading it once. It shows how many people become regular users of your product to help them achieve their goals.
You can measure product adoption daily, weekly, monthly, or annually. To calculate the product adoption rate, divide the number of new active users by the number of signups, and multiply it by 100. Simply put,
Product adoption rate = (New active users / Signups) * 100
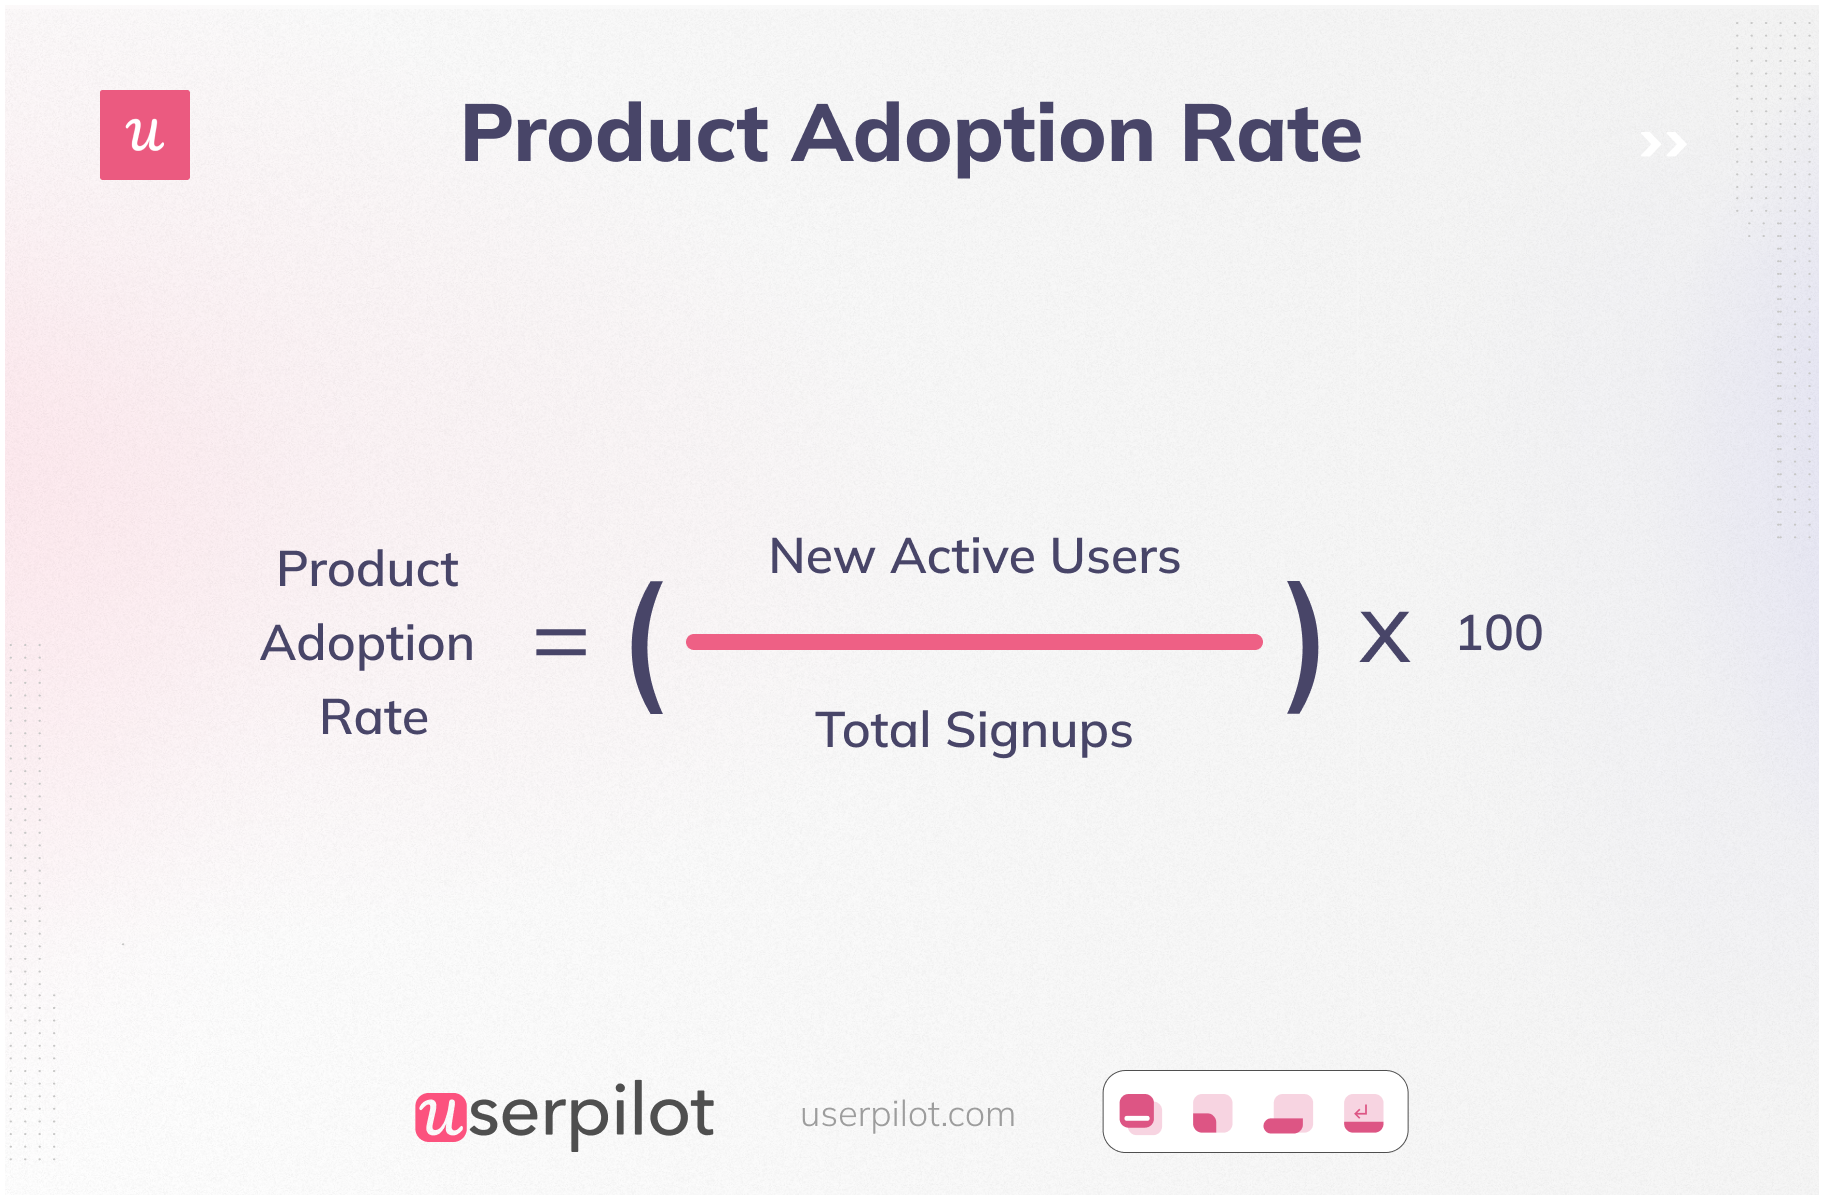
For example, if your total number of users is 400 and the number of new users in a month is 40, your product adoption rate is (40/400)*100 = 10%.
Product adoption rate benchmarks in SaaS
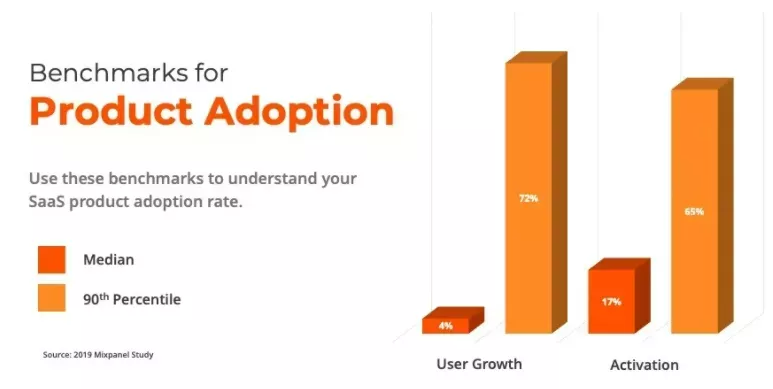
Let’s look at some stats to compare your product adoption rate to other SaaS solutions.
- Activation: It is the percentage of existing customers who completed the key actions needed to reach the activation point and experience your product’s value for the first time. The median activation rate is 17%, while the 90th percentile rate is 65%.
- User growth: It is the month-over-month growth in the number of weekly active users. The median growth rate is 4%, while the 90th percentile rate is 72%.
So what is a good product adoption rate for your SaaS?
The ideal product adoption rate will differ from one product to another, but you can use the above benchmarks for evaluation.
In general, the higher your adoption rate, the better. More people using your SaaS means they’re able to see the value of your product and are likely to renew their subscription.
Other user adoption metrics you should track to measure product adoption
Your product adoption metrics should be tied to particular business goals. This way, you can track these metrics and use the insights to develop a well-informed product adoption strategy.
Tracking product adoption is a crucial step to customer success. Instead of wasting your valuable time on metrics that don’t matter, track and optimize the ones that will help boost user adoption. Here are the most important user adoption metrics that you should constantly track.
Time to Value
Time to Value (TTV) is a metric that measures the amount of time it takes for a user or customer to derive value from a product or service after their initial interaction or user onboarding.

Your goal should be to decrease time-to-value as much as possible to improve product adoption. Tracking it will let you keep track of the trend in adoption within your product and identify potential points of friction in the product adoption process.
You can then remove friction from the onboarding flow and focus on nudging users toward the activation point to drive faster adoption.
Customer lifetime value (CLV)
Customer lifetime value is the amount of revenue you can earn from each customer over the course of their customer journey with you.
Customer Lifetime Value = (Customer Value) x (Average Customer Lifespan)
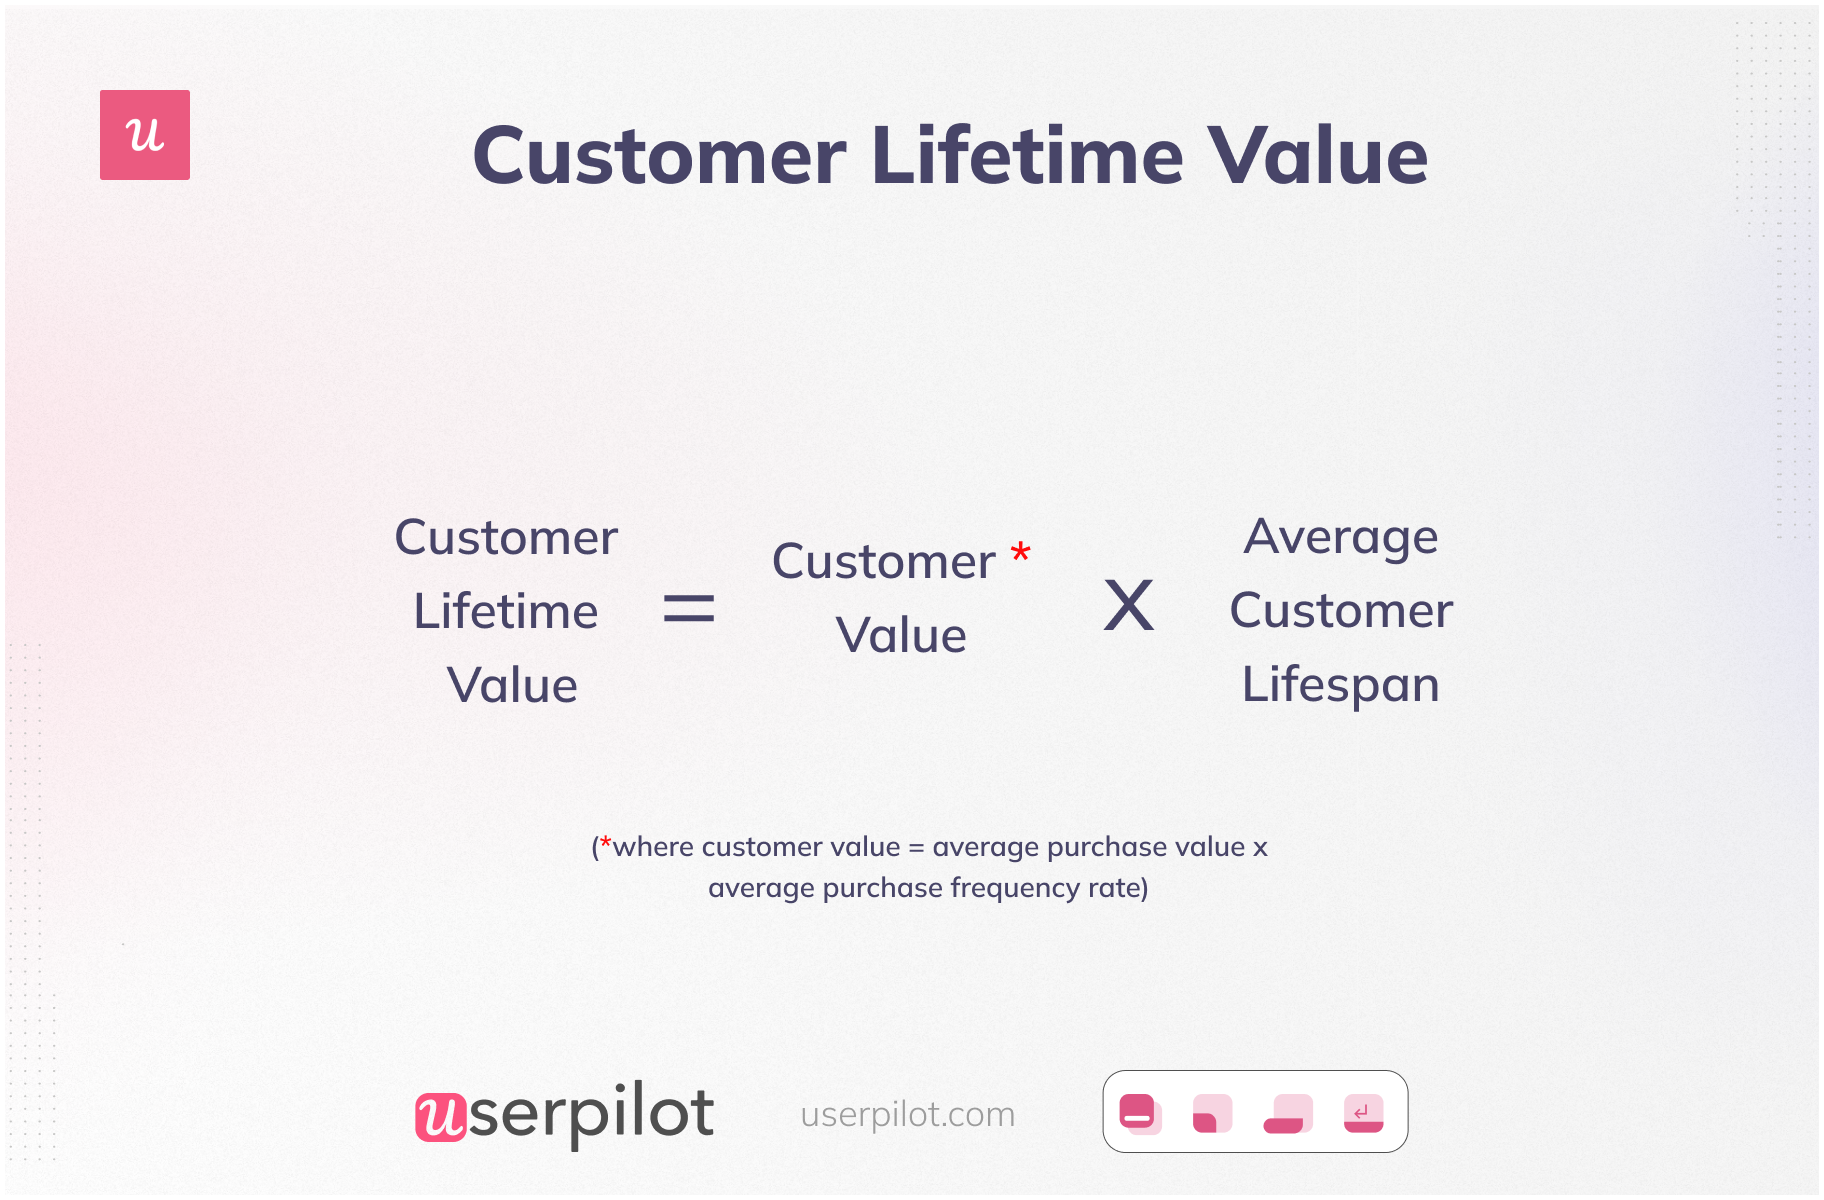
Here’s a breakdown of each component:
- Average purchase value is the average amount of money a customer spends per transaction. It is calculated by dividing the total revenue generated from all purchases by the number of purchases made by customers.
- The number of repeat purchases is the average number of times a customer makes a purchase within a given time frame. It can be calculated by dividing the total number of purchases by the number of unique customers.
- The average customer lifespan represents the average duration of the customer relationship. It is typically measured in months or years.
The higher the customer lifetime value, the longer your customers stay with you and become more profitable for your business.
Increase CLV with contextual onboarding flows!

Activation rate
The next important thing for you to ensure is product activation.
To start activation, you have to select specific in-app events that would encourage users to activate upon completion. Divide your users into segments based on the different user personas and measure the activation rate for each of them separately.
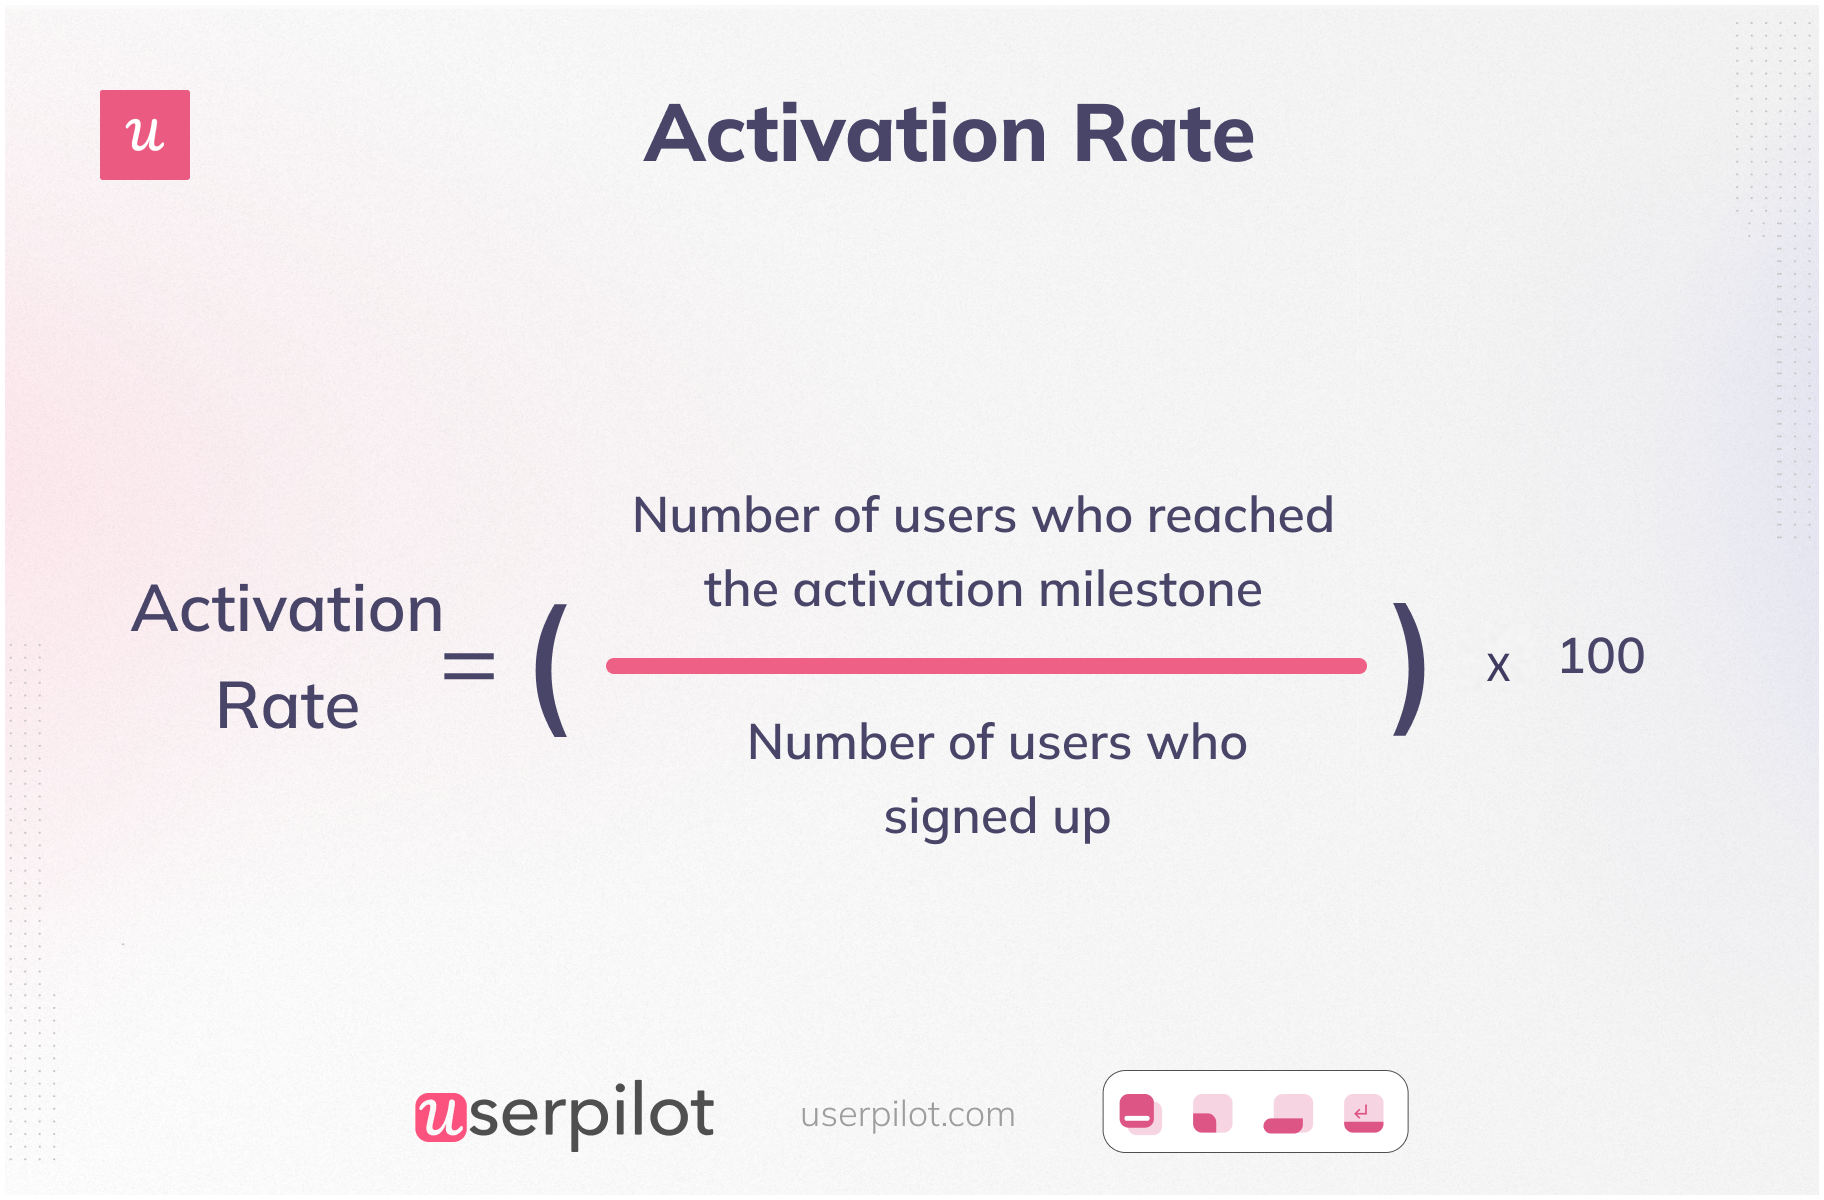
The activation rate shows how many users reached the activation point and equals the number of users who reached the activation point or milestone divided by the number of users who signed up, multiplied by 100.
This metric has the biggest effect on your revenue. A 25% rise in activation can boost your MRR by 34% over a year.
So, gather insights into this metric, especially for the most valuable customer segments, to formulate your activation strategy.
Implement your activation strategy with Userpilot!

Average session duration
Average session duration is the average time a user spends engaging with your product. It measures the level of user engagement and how long it takes for a user to get value from one visit.
Average session duration is a key indicator for TTV, helping you determine if you need to adjust the onboarding processes.
It can serve as an early warning sign for potential churn, as shorter session durations may suggest users are spending less time engaged with the product.
You can measure average session duration with the following formula:
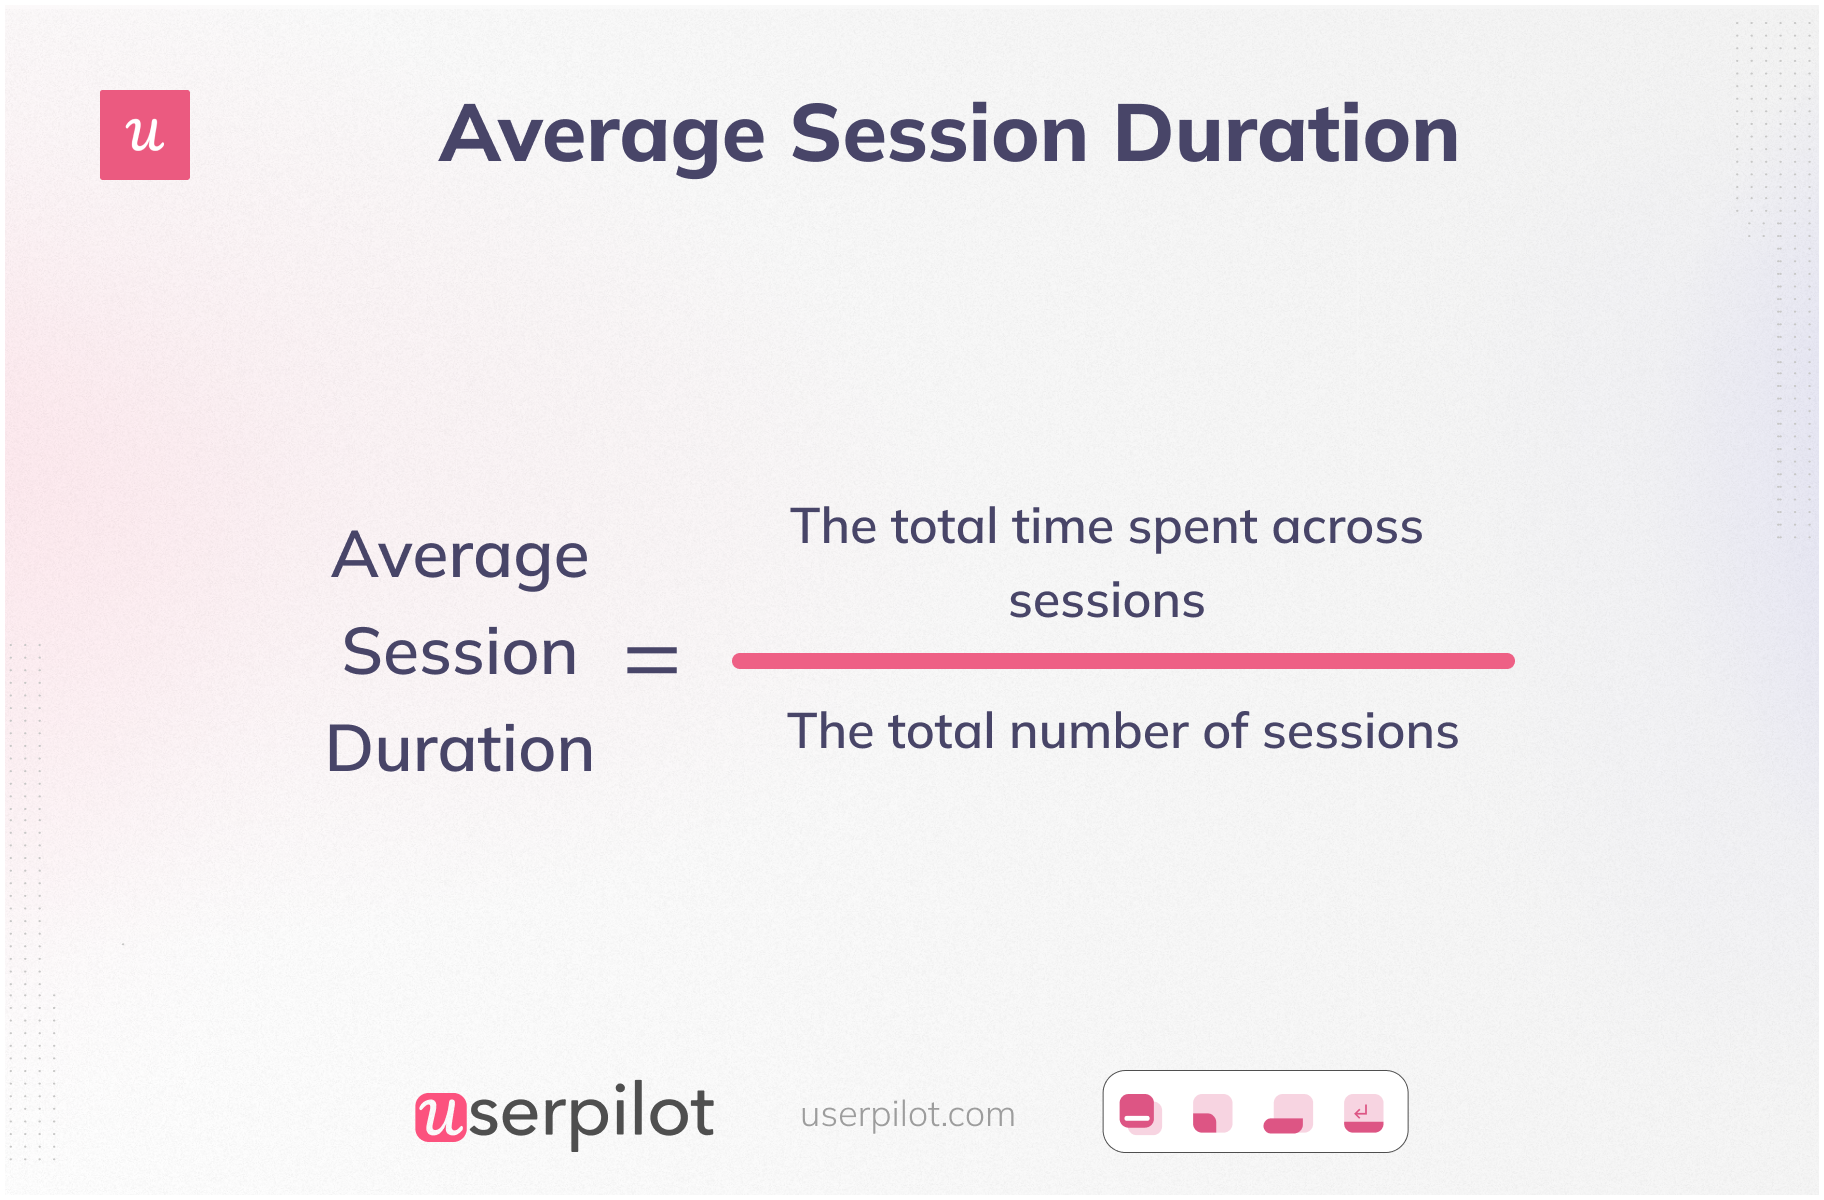
The total time spent across sessions is the total duration a user spent on your product over a specific time frame.
The total number of sessions is the number of individual sessions over a specific time frame.
Product stickiness metric
Product stickiness rate is one of the key product metrics you should measure to know whether your product creates value. It is the tendency of users to keep returning to your product because it’s engaging and valuable to them.
Stickiness is equal to the ratio of daily active users (DAUs) to monthly active users (MAUs). For example, if you have 2,500 daily active users and 5,000 monthly active users, your stickiness rate is 0.5 or 50%.
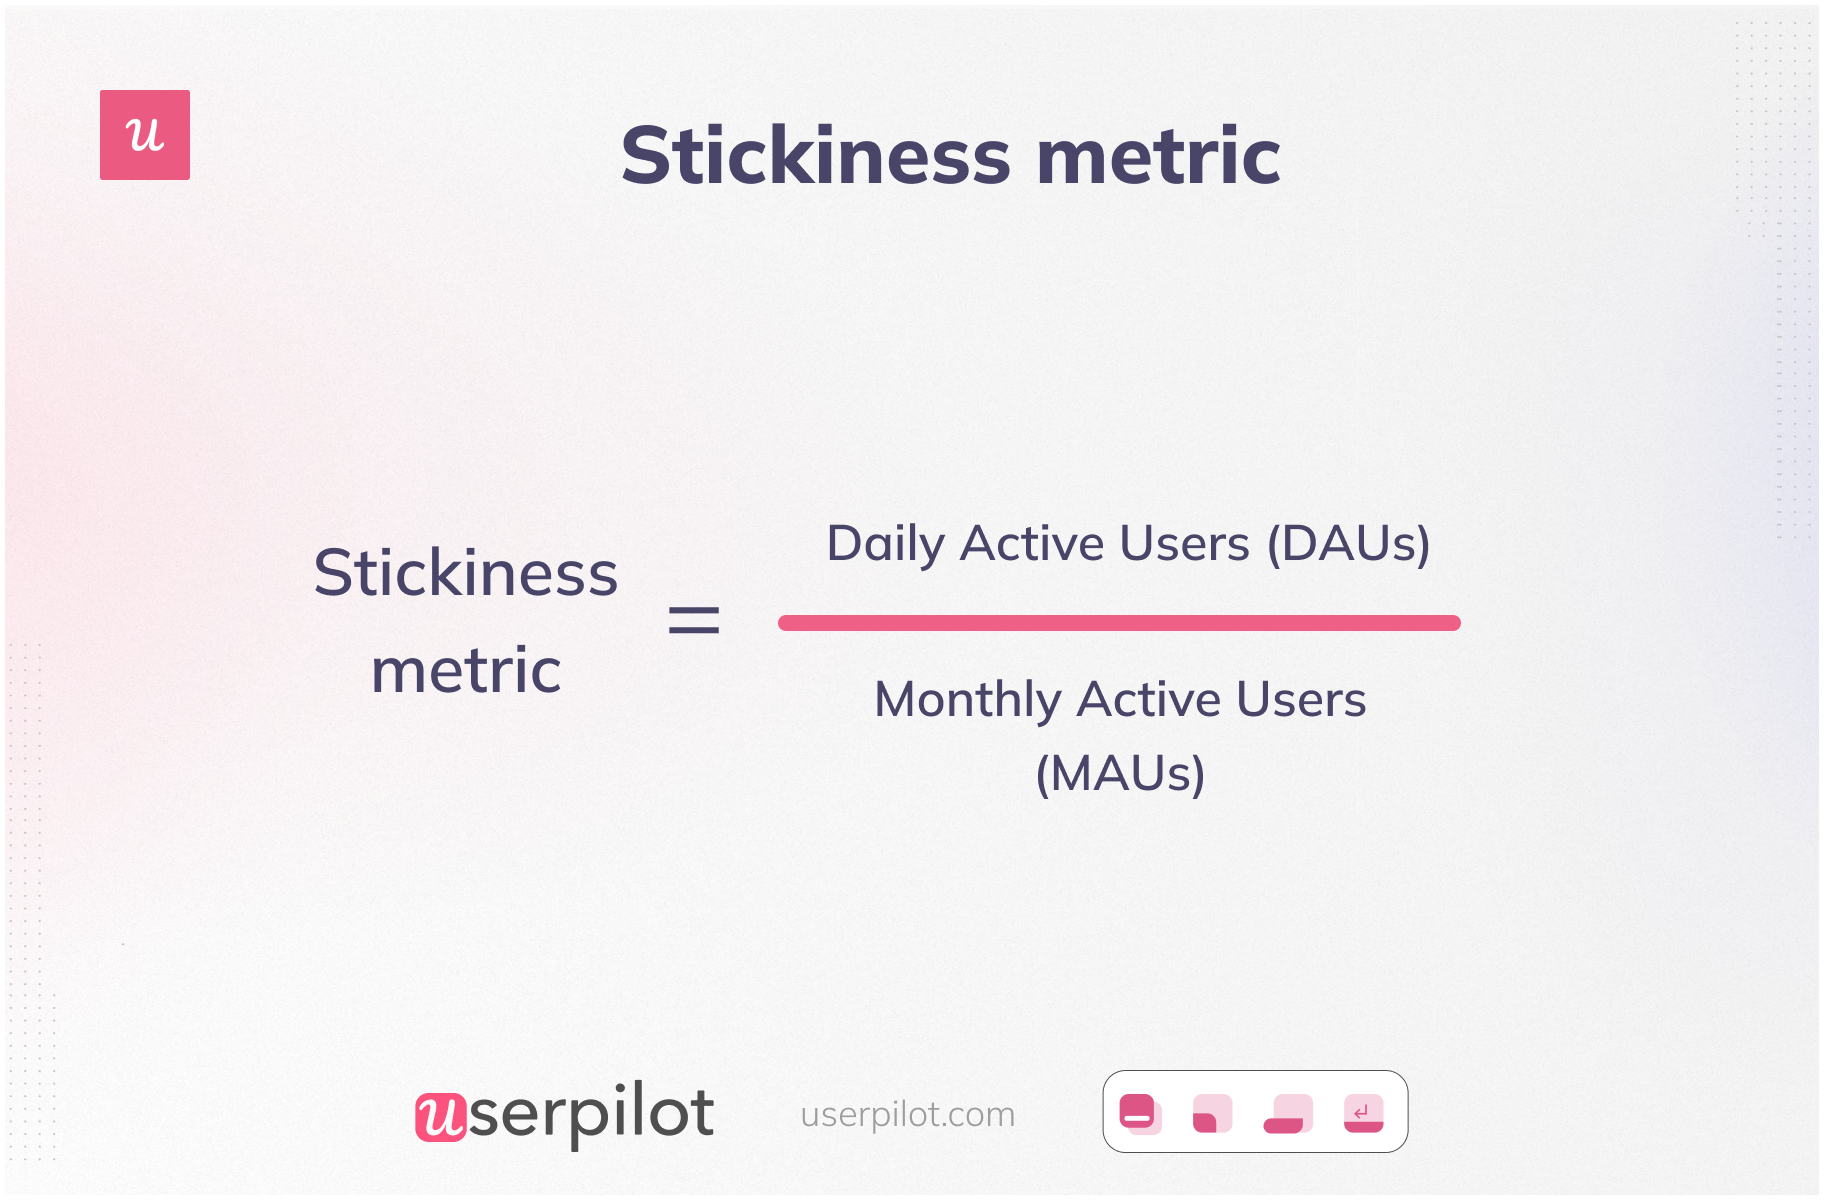
Product stickiness drives growth by improving customer retention, providing account expansion opportunities, and increasing customer lifetime value.
Create engaging experiences to increase product stickiness!

Product feature adoption rate
To adopt your product, customers need to find your product’s features useful. This is where the feature adoption rate comes in.
Some relevant features may not be hidden, but customers can still find it difficult to notice where they are. This is why feature discovery helps improve your feature adoption, especially with a new feature.
To calculate the feature adoption rates, divide the number of monthly active users of a feature by the number of users who logged in within a specific period and multiply the result by 100.
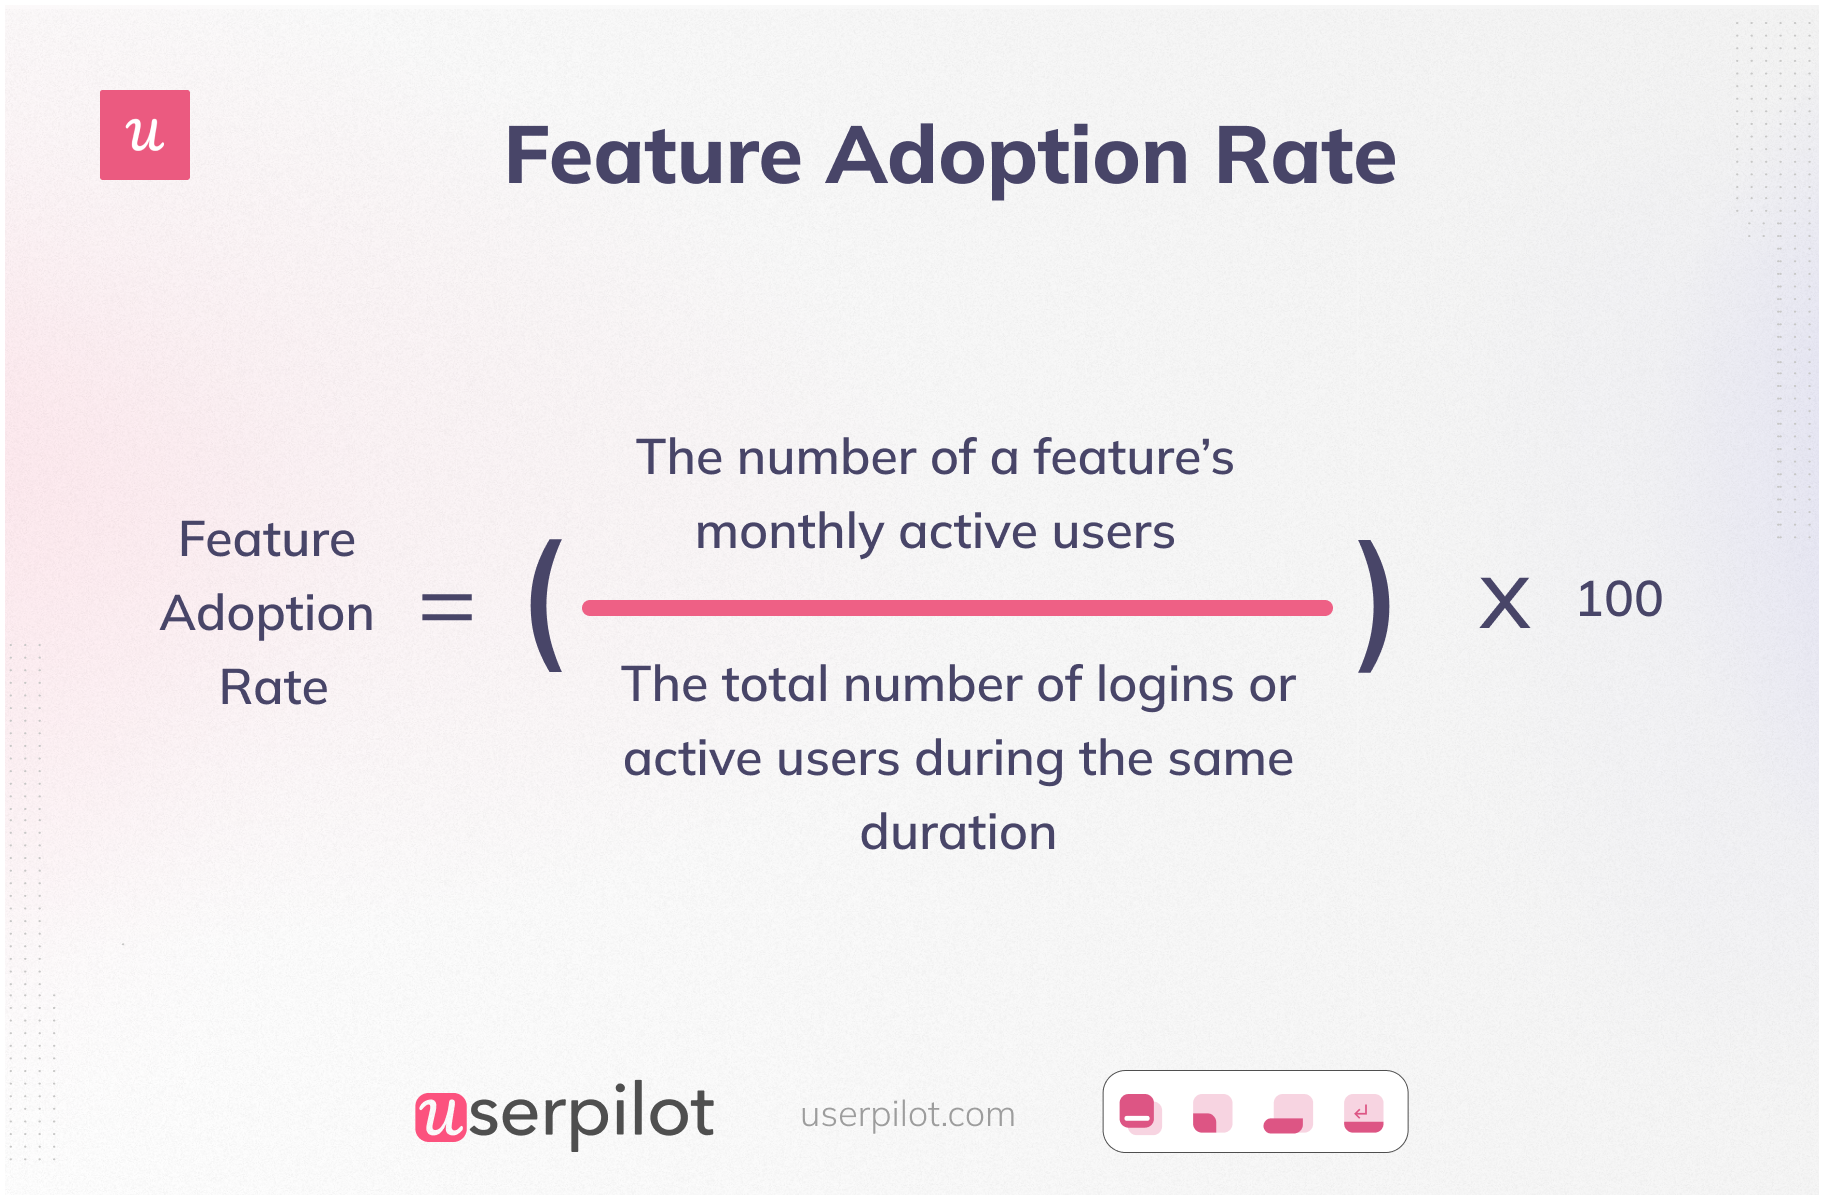
Along with other advanced feature adoption metrics and analytics, you can use this metric to develop a successful strategy to drive feature adoption. You can also create onboarding experiences to guide users to new or more advanced features.
User engagement score
If your target users don’t engage with your product enough, they won’t find it helpful to their cause. Therefore, customer engagement provides vital insights into the ‘health’ of your customers.
The user engagement score allows you to discover disengaged customers on the verge of churning and even find opportunities for product expansion.
CES needs to be calculated using a multi-step process.
First, find out the key events your users complete, which measure engagement directly. Second, assign action impact scores (on a scale of 1-10) to each of these events according to their level of importance.
Calculate the total event values by multiplying the action impact score by the action frequency (last x days). Then add each of the total event values to get the user engagement score.
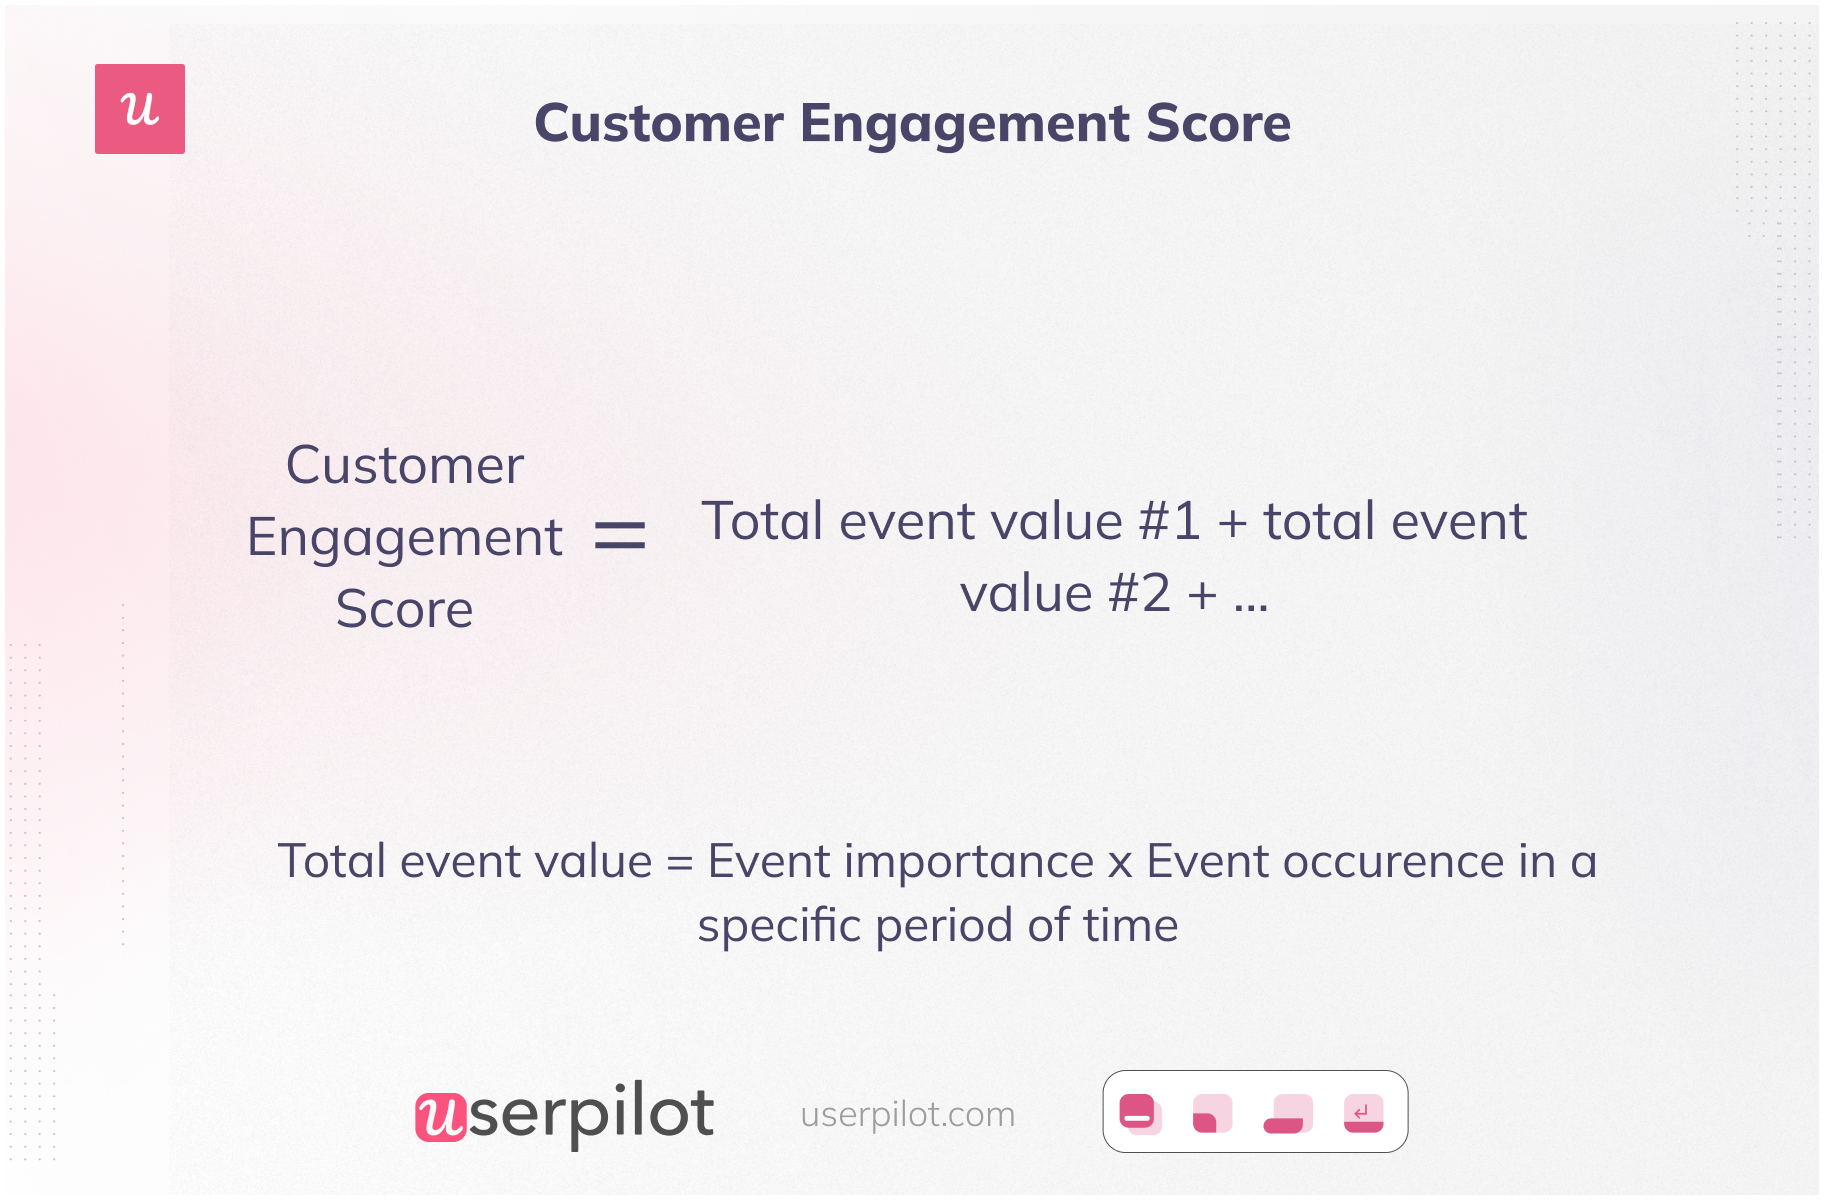
The customer engagement score gives you a snapshot of your product usage metrics. You can track customers with low CES to find points of friction.
After cross-referencing CES with other usage metrics, you can collect valuable information to improve your product and customer engagement.
On the flip side, you can target customers with high CES to implement your revenue expansion strategy.
How to use product adoption metrics to improve your product adoption process
In this section, we will discuss the tactics customer success teams can apply to your product adoption strategy.
Create personalized user onboarding to improve customer satisfaction
Your users can’t adopt your product unless they activate it, and welcome screens are a perfect means of onboarding your users.
Welcome screens allow you to give warm greetings to your users, introduce yourself with a personal touch, and let them know what to expect next.
But more importantly, welcome screens help you segment users by using a micro survey.

Segmentation lets you understand the needs of your users better and identify their jobs to be done. This helps you create a personalized user onboarding flow for each cohort to direct users to the shortest route to activation.

Use interactive walkthroughs to drive the feature adoption rate
Interactive walkthroughs are a great onboarding tool for driving product adoption. Unlike product tours that provide a lot of information at once, walkthroughs make guides engaging for new users by making them learn by doing.
Walkthroughs use a series of tooltips that guide users through your product features. Thus, they shorten the learning path so users can quickly experience the value of your product and adopt it.
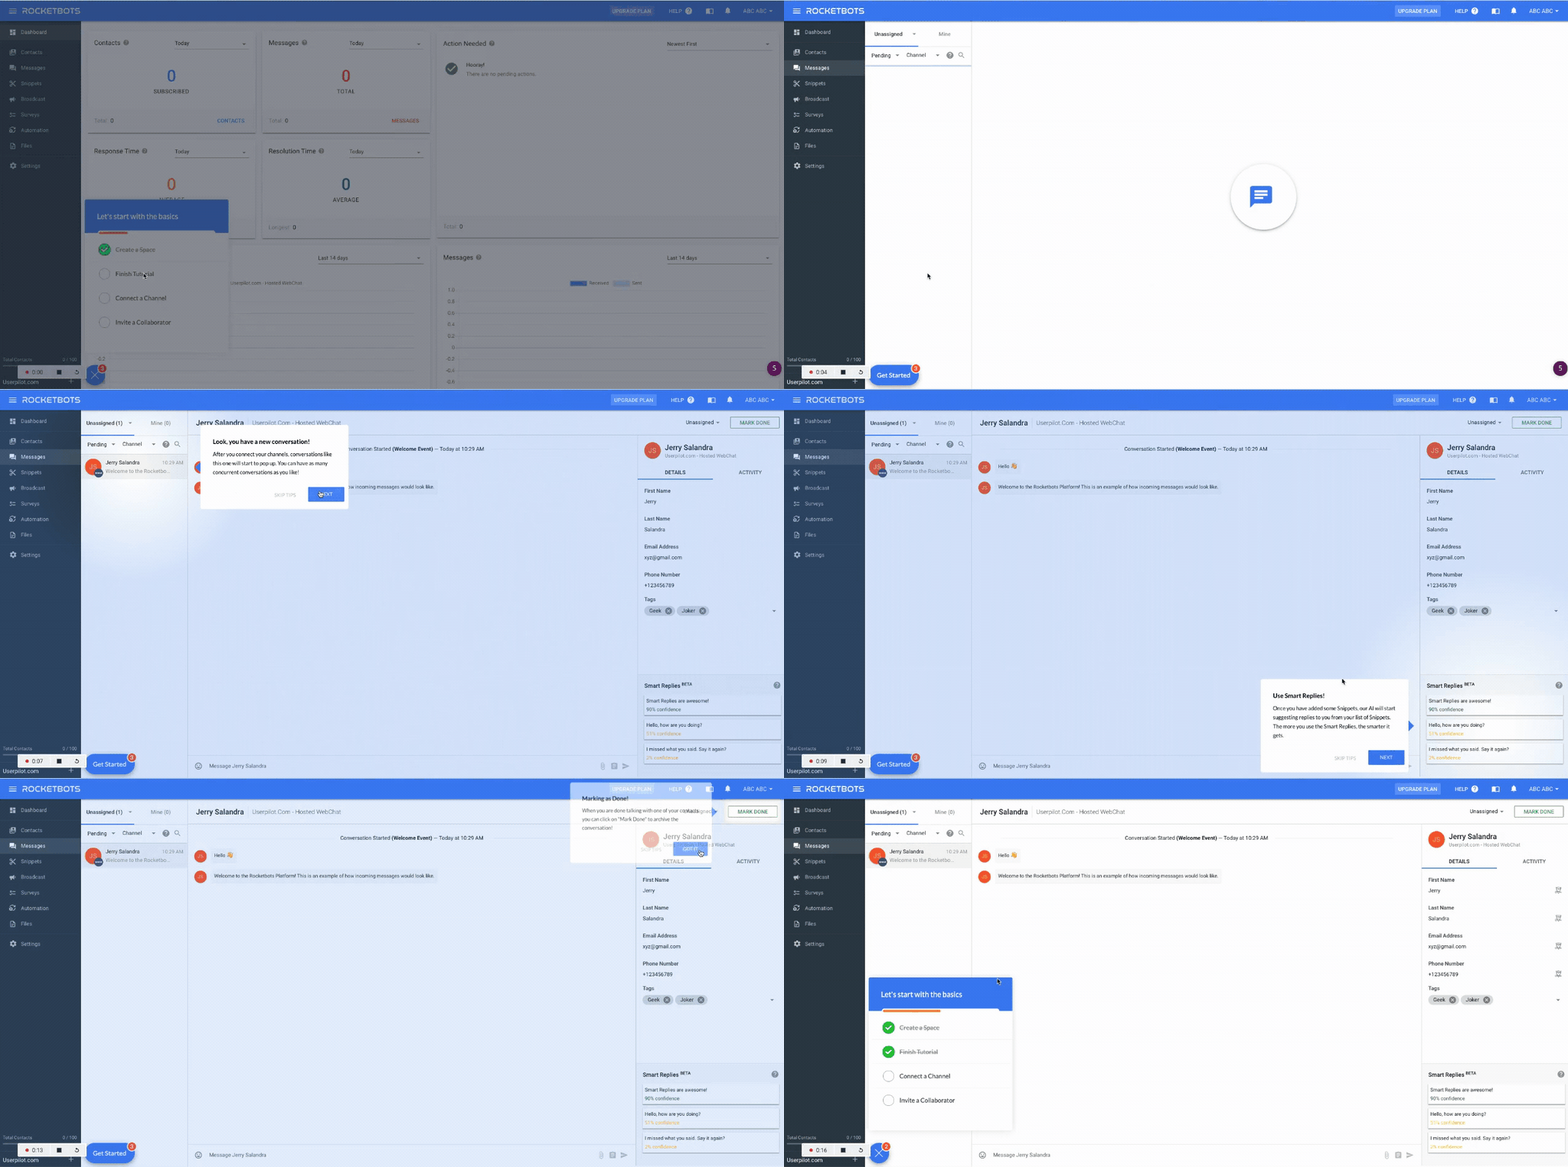
You can also use walkthroughs during secondary onboarding to showcase secondary or new features relevant to a customer’s use case. In addition, this lets you drive secondary usage frequency and feature adoption rate.
Use in-app messaging to improve customer engagement
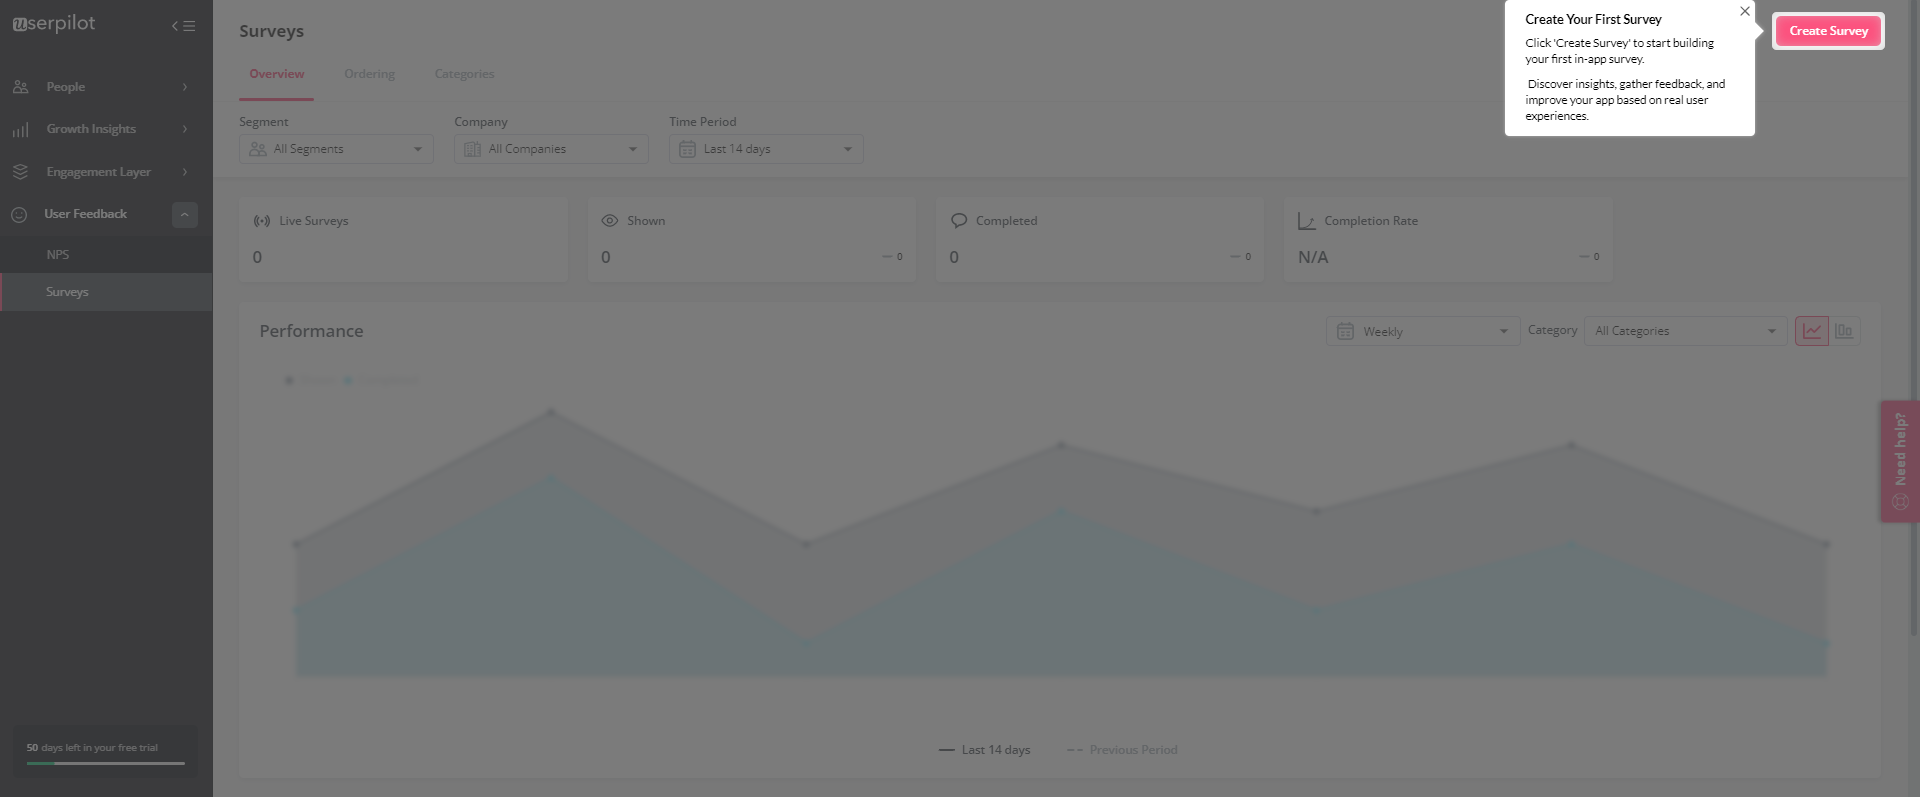
In-app messaging can highlight the stickiest features of your product to ensure you get an ROI on all your acquisition efforts.
When trying to drive user engagement and feature adoption, you should create in-app messages that educate users about the features they’re missing out on and give them a reason to opt-in to using them.
Provide strong customer support with self-service options
Self-service support reduces the risk of churn due to delayed customer service. Ensuring Day 1 retention is a serious challenge for many SaaS companies.
If a user’s first experience with you involves them having to wait for 2 days to get an issue resolved, they might not stick around to activate and adopt your product.
This is where self-service support comes in.
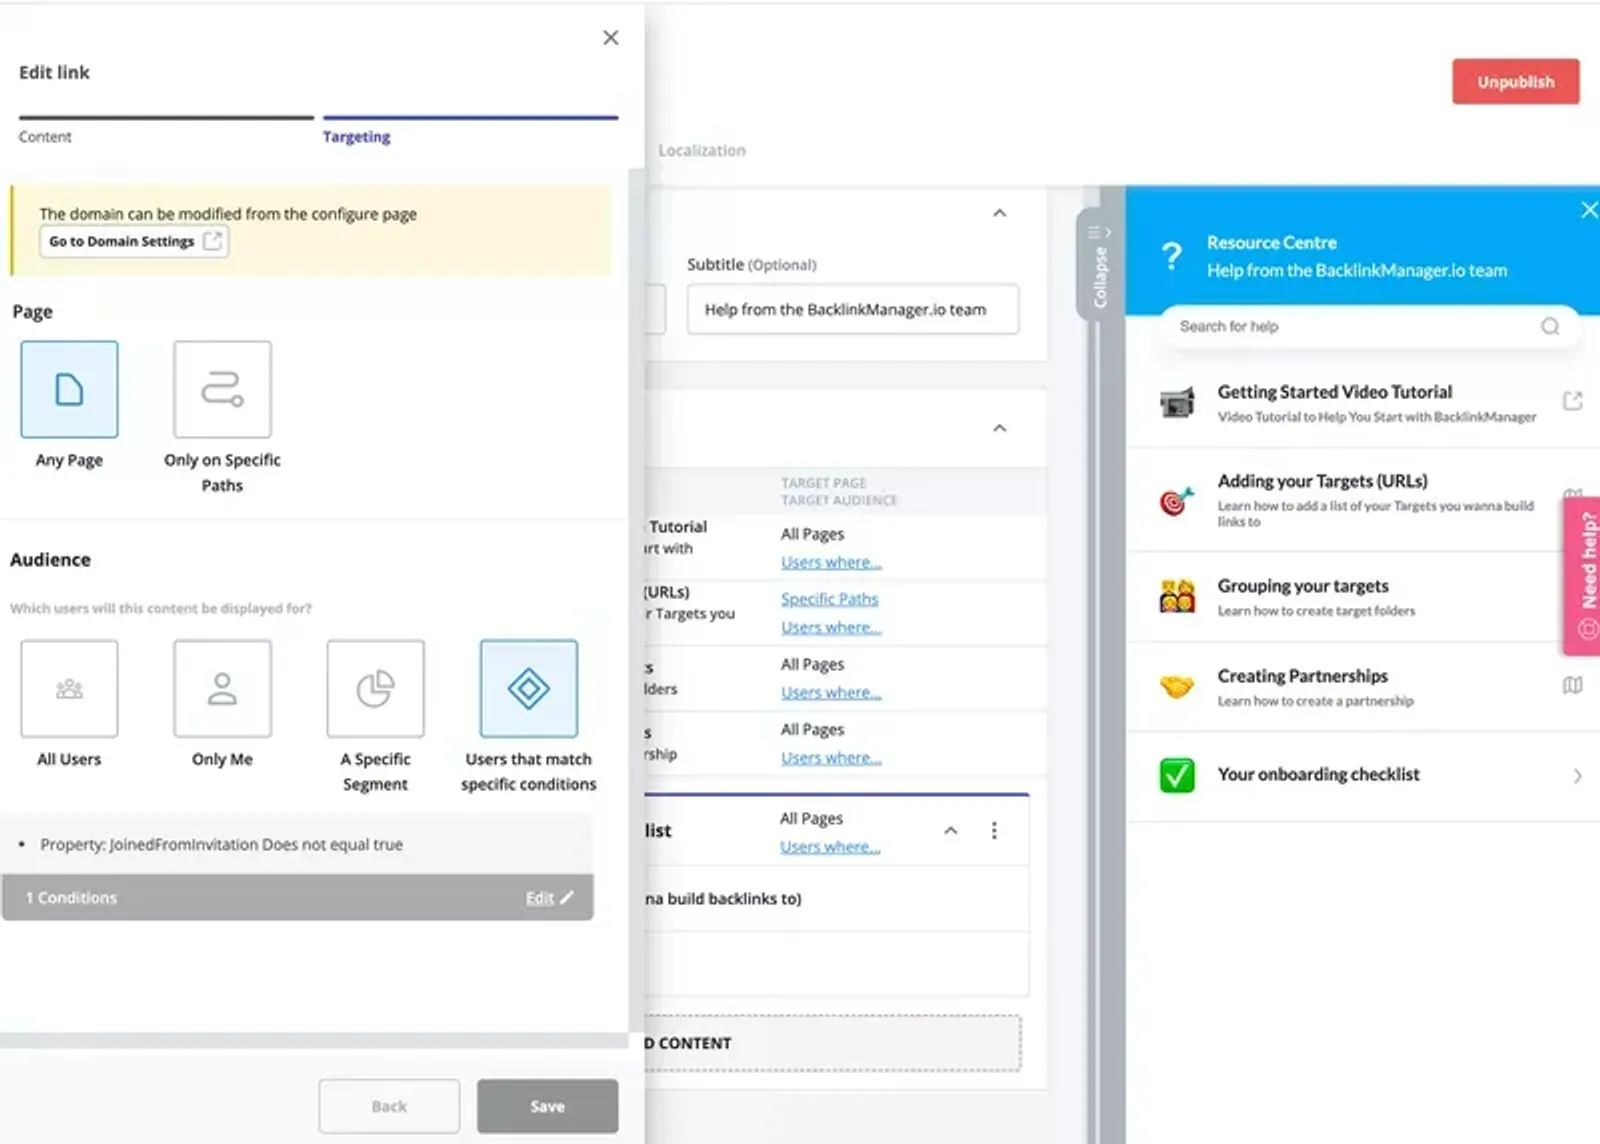
Self-service support provides a practical opportunity to equip users with educational resources for continuous customer onboarding. Thus, it also helps to boost engagement.
In addition, when customers reach out to the support team less often, it can focus more on the unusual and serious problems that other users face.
Collect customer feedback to improve customer experience
While the onboarding tactics above help you improve customer satisfaction, you also need to conduct micro surveys to track this metric and improve your product. Micro surveys help you collect just enough user feedback without losing the attention of your users.
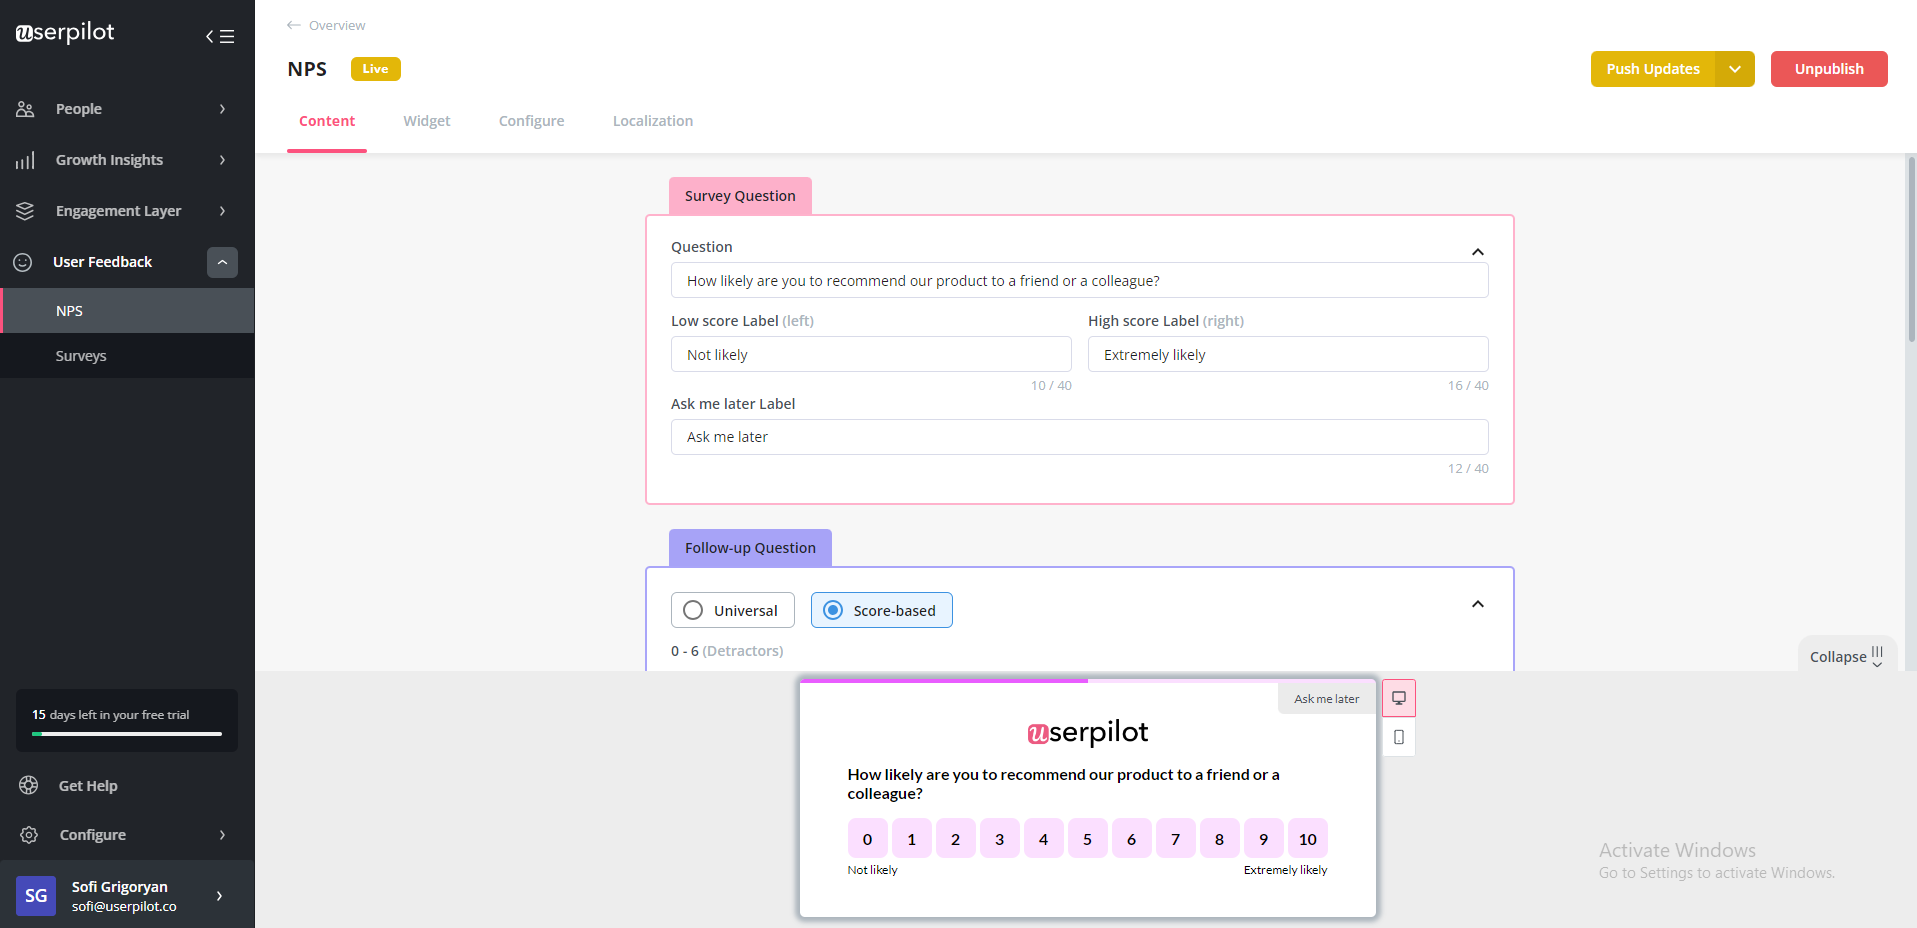
One such survey is the NPS survey, which asks users to rate how likely they are to recommend your product to others on a scale of 1-10. Hence, it’s also a measure of customer loyalty.
To know why customers gave a particular score, add a follow-up question to collect qualitative customer feedback. It will help you learn what makes them happy and what does not so that you can capitalize on your strengths and address your weaknesses accordingly.
Use marketing automation software to drive more users to activation
SaaS marketing automation is a process of automating marketing activities with the use of software. These tools allow product marketers to send contextual messages to their users at the right time.
Think sending in-app messages across multiple touchpoints, when the user reaches a certain milestone. This helps them improve product adoption metrics, and user satisfaction, and provide a better customer experience.
Whether you’re trying to salvage an abandoned registration or drive product adoption through timely nudges inside the platform, with a SaaS marketing automation tool you can deliver on-brand messaging with coherence across multiple touchpoints.
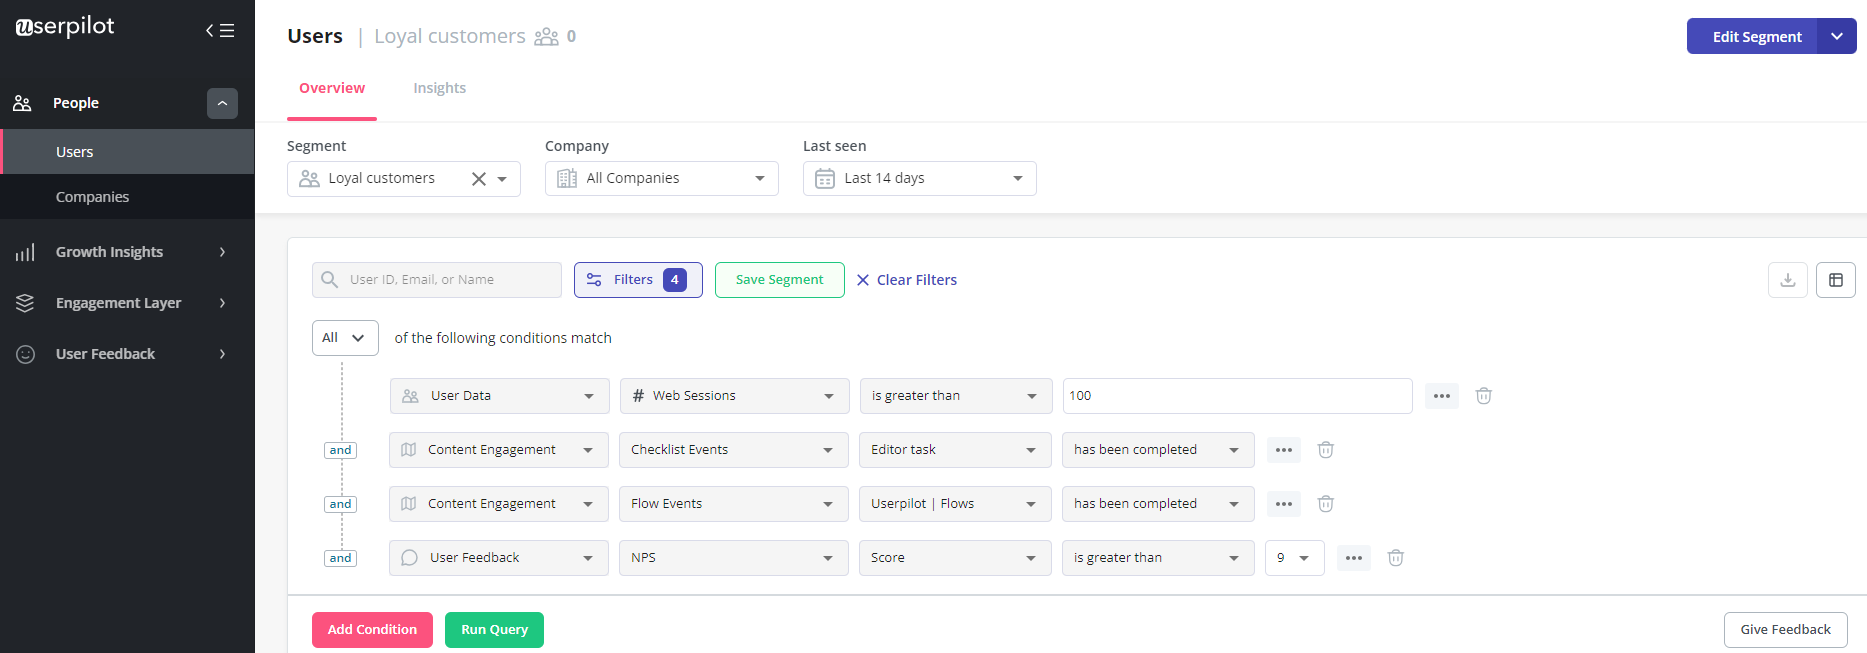
You can easily launch in-app experiences at the right time for the right segment of your SaaS to drive adoption.
How to improve your product adoption rate with a digital adoption platform
In this section, we will delve into the actionable steps and strategies you can employ to improve your product adoption rate using a digital adoption platform.
Userpilot is a versatile user onboarding and digital adoption platform with well-developed analytics features, user feedback collection functionality, and an engagement layer. Let’s take a closer look at its features and functionality.
Set goals and monitor their completion
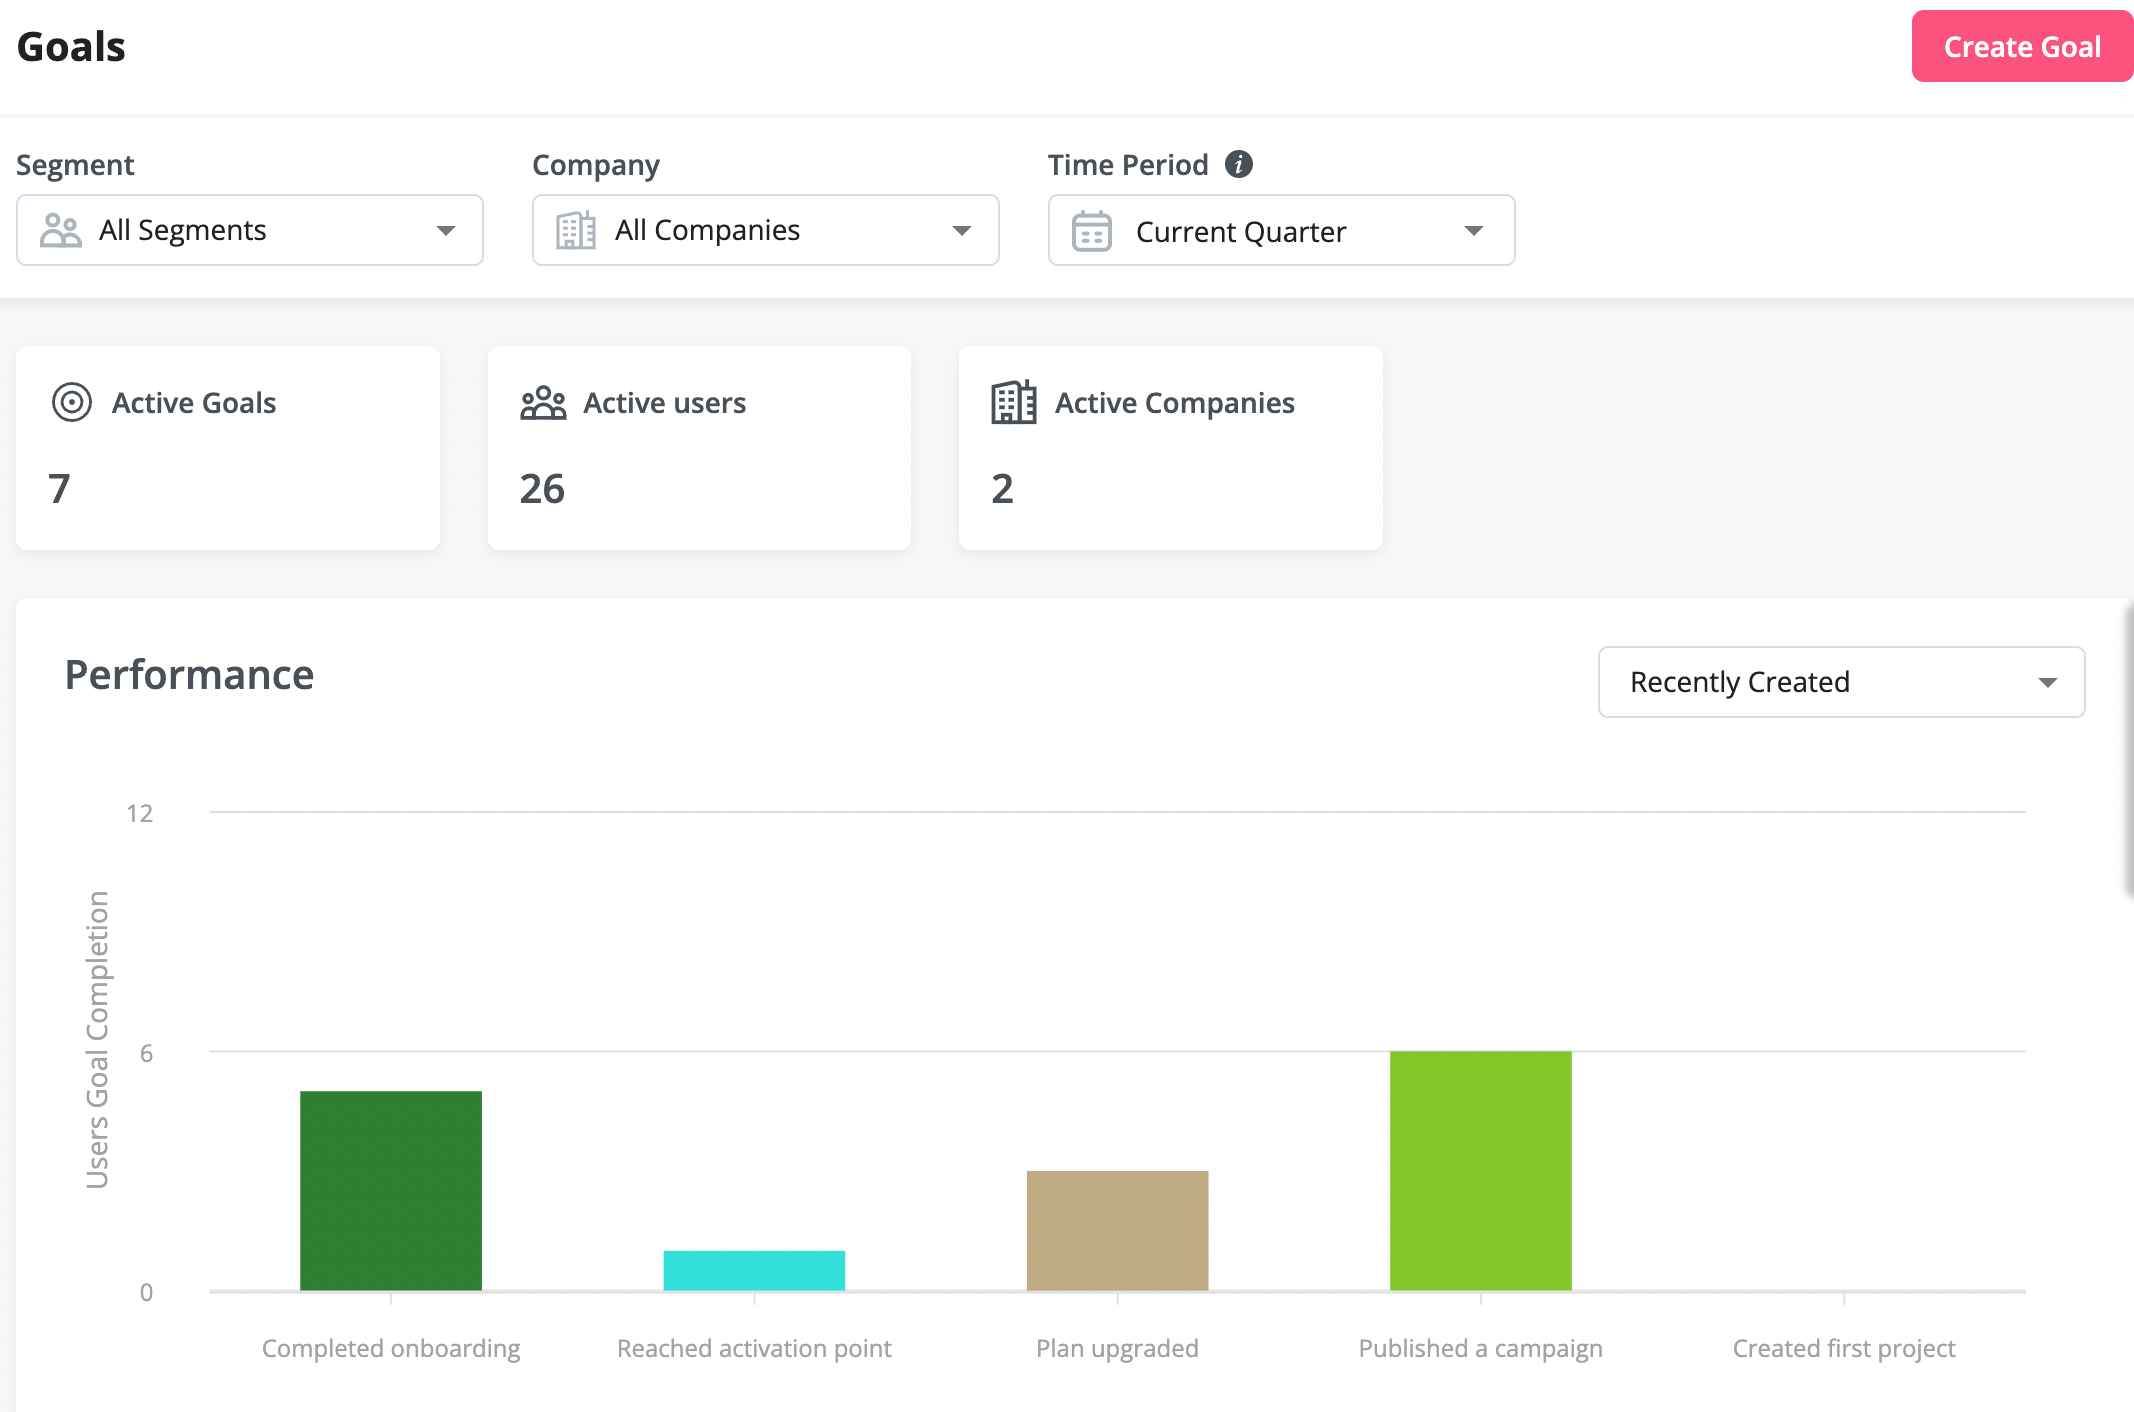
Userpilot lets you track what customers are doing in-app and what percentage of the users have completed a particular goal. Thus you will see how customers are interacting with the goals and find friction points that they might be facing.
You can also attach goals to different activation milestones to see how users progress through your product and contextually nudge them when they are not completing their goals.
Drive feature adoption with in-app guidance
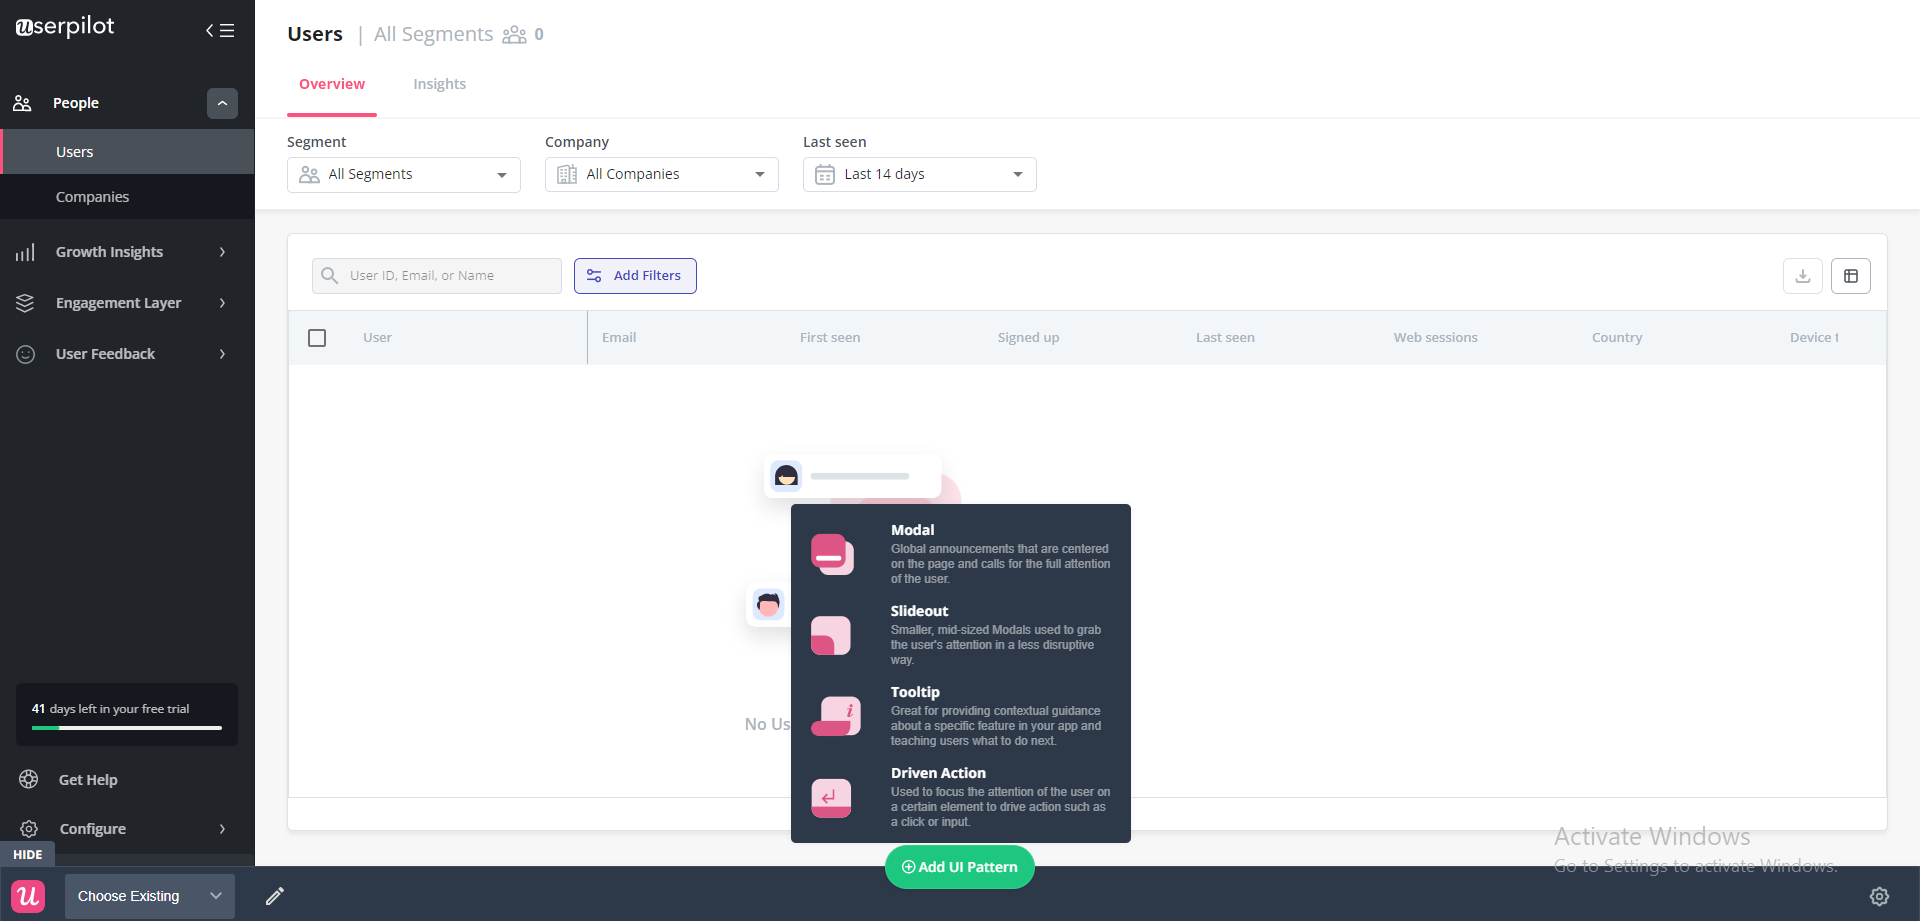
With Userpilot, you can create different in-app experiences, such as tooltips, checklists, interactive walkthroughs, and much more. These in-app patterns will help you to guide users to necessary features without disrupting their experience.
Experiment with different user adoption strategies
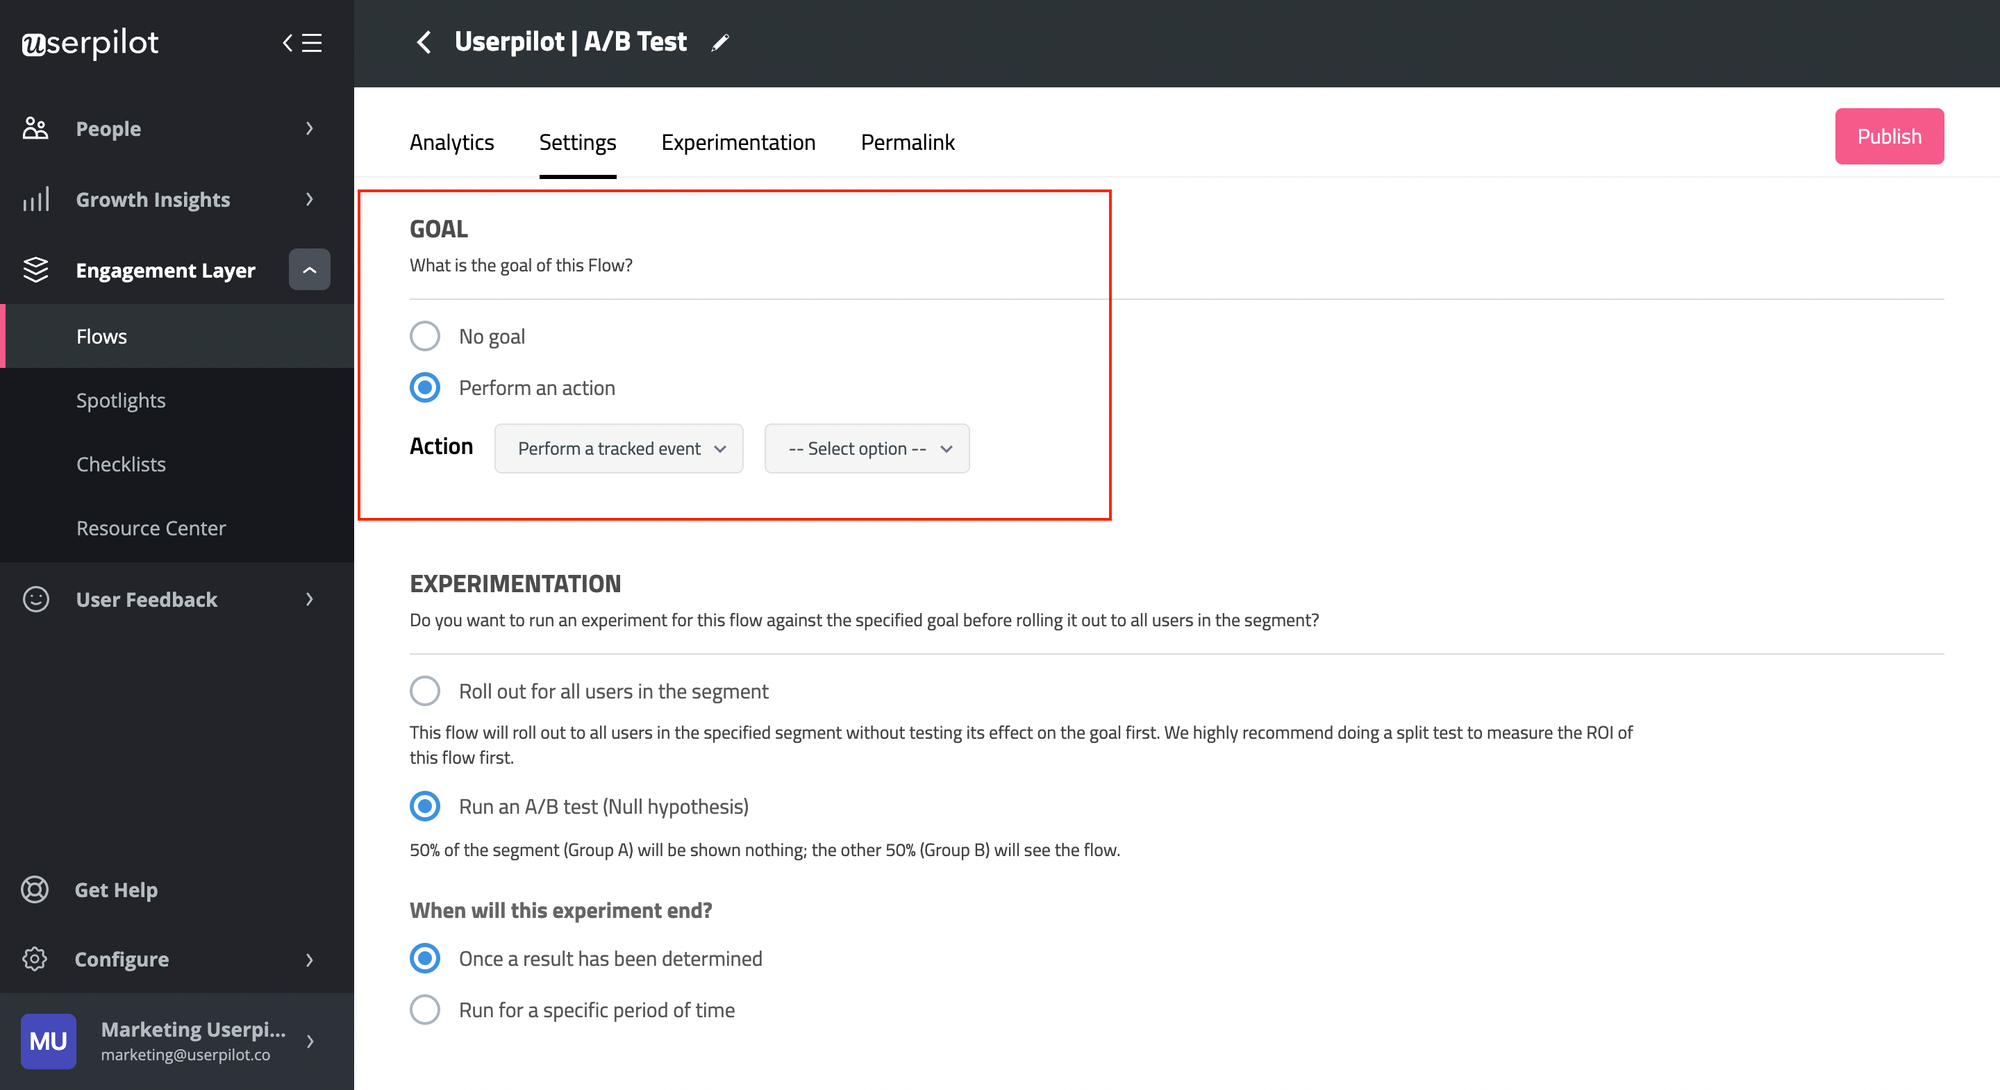
You can even run A/B tests to see which elements of your strategy result in higher product adoption rates.
You can align results tracking with specific goals, and tweak user experiences all within Userpilot.
Conclusion
Activation isn’t enough. Your new users need to adopt your product and keep finding value in each new feature, along their user journey. Therefore, you need to track adoption metrics regularly and use tactics to improve product adoption simultaneously.
Want to know more about how Userpilot can help with product adoption? Book a demo today!
Drive product adoption with Userpilot!


