
Confused about which SaaS product adoption metrics you need to measure?
Improving product adoption in SaaS is all about being at the right place at the right time. Or, in SaaS terms – prompting users to engage with the right features at the right moment.
And measuring product adoption metrics essential to your business will help you improve user retention and achieve sustainable growth.
In this article, we’ll cover:
- How you can measure product adoption the right way.
- Which metrics you should be tracking.
- How to drive users to adoption.
- What tools can help you improve product adoption metrics?
Let’s get right into it!
Try Userpilot Now
See Why 1,000+ Teams Choose Userpilot

What is product adoption?
Product adoption refers to the moment your users start using your product purposefully.
A product is considered “adopted” when users move from trialing the product to actually using it, allowing them to accomplish goals with the product.
What are SaaS adoption metrics and why are they important?
SaaS product adoption metrics serve as vital indicators for evaluating the performance of a SaaS product in the market. These metrics can include the number of sign-ups, conversion rate, churn rate, customer lifetime value, user engagement, DAU/MAU, onboarding time, adoption rate, feature adoption rate, CSAT, and NPS.
By analyzing these metrics, businesses gain valuable insights into the effectiveness of their marketing efforts, the product’s ability to convert non-paying users into customers, and the overall satisfaction and loyalty of their user base.
Moreover, these metrics enable companies to make well-informed decisions and implement targeted strategies to optimize user adoption, enhance customer satisfaction, and drive revenue growth.
How to pick the right product adoption metrics for your SaaS business
Product adoption isn’t just about getting users to use your product. It would be best if you made sure that your users are realizing the value of your product.
And the right user adoption metrics will help you understand:
- Who is adopting your product (breadth of adoption)
- What are the most valuable features to them (depth of adoption)
- When can they understand the value of your product (time to adopt)
- How long do they continue to see the value (duration of adoption)
Breadth of adoption – the “who”
The breadth of feature adoption measures how many users are using a specific feature. In other words, it measures “how widely” these features have been adopted across your target user base.
This will help you understand which features are working or not working (as well as the underlying reasons) and the key actions that you should take to improve your feature adoption strategy.
Depth of adoption – the “what”
The depth of feature adoption measures the usage frequency of a specific feature by your target number of users.
This will give you an understanding of your product usage and product stickiness, as well as the usefulness of particular features.
Time to adopt – the “when”
Time to adopt measures the time it takes for a user to start using a new feature after they first discover it. This can offer you valuable insights such as UI/UX issues, non-relevance, or the effectiveness of the new features onboarding process.
Duration of adoption – the “how long”
You might notice in most cases that users can be quick to adopt new features, but their usage frequency for that feature dies down over time. Duration of adoption measures whether users go beyond the initial “trying out” stage and continue to use a feature repeatedly.
SaaS product adoption metrics you should track
It’s easy to get confused with all the advanced adoption metrics you can track to measure different aspects of product adoption.
So let’s keep it simple. Here are some of the key metrics and why you should be tracking them.
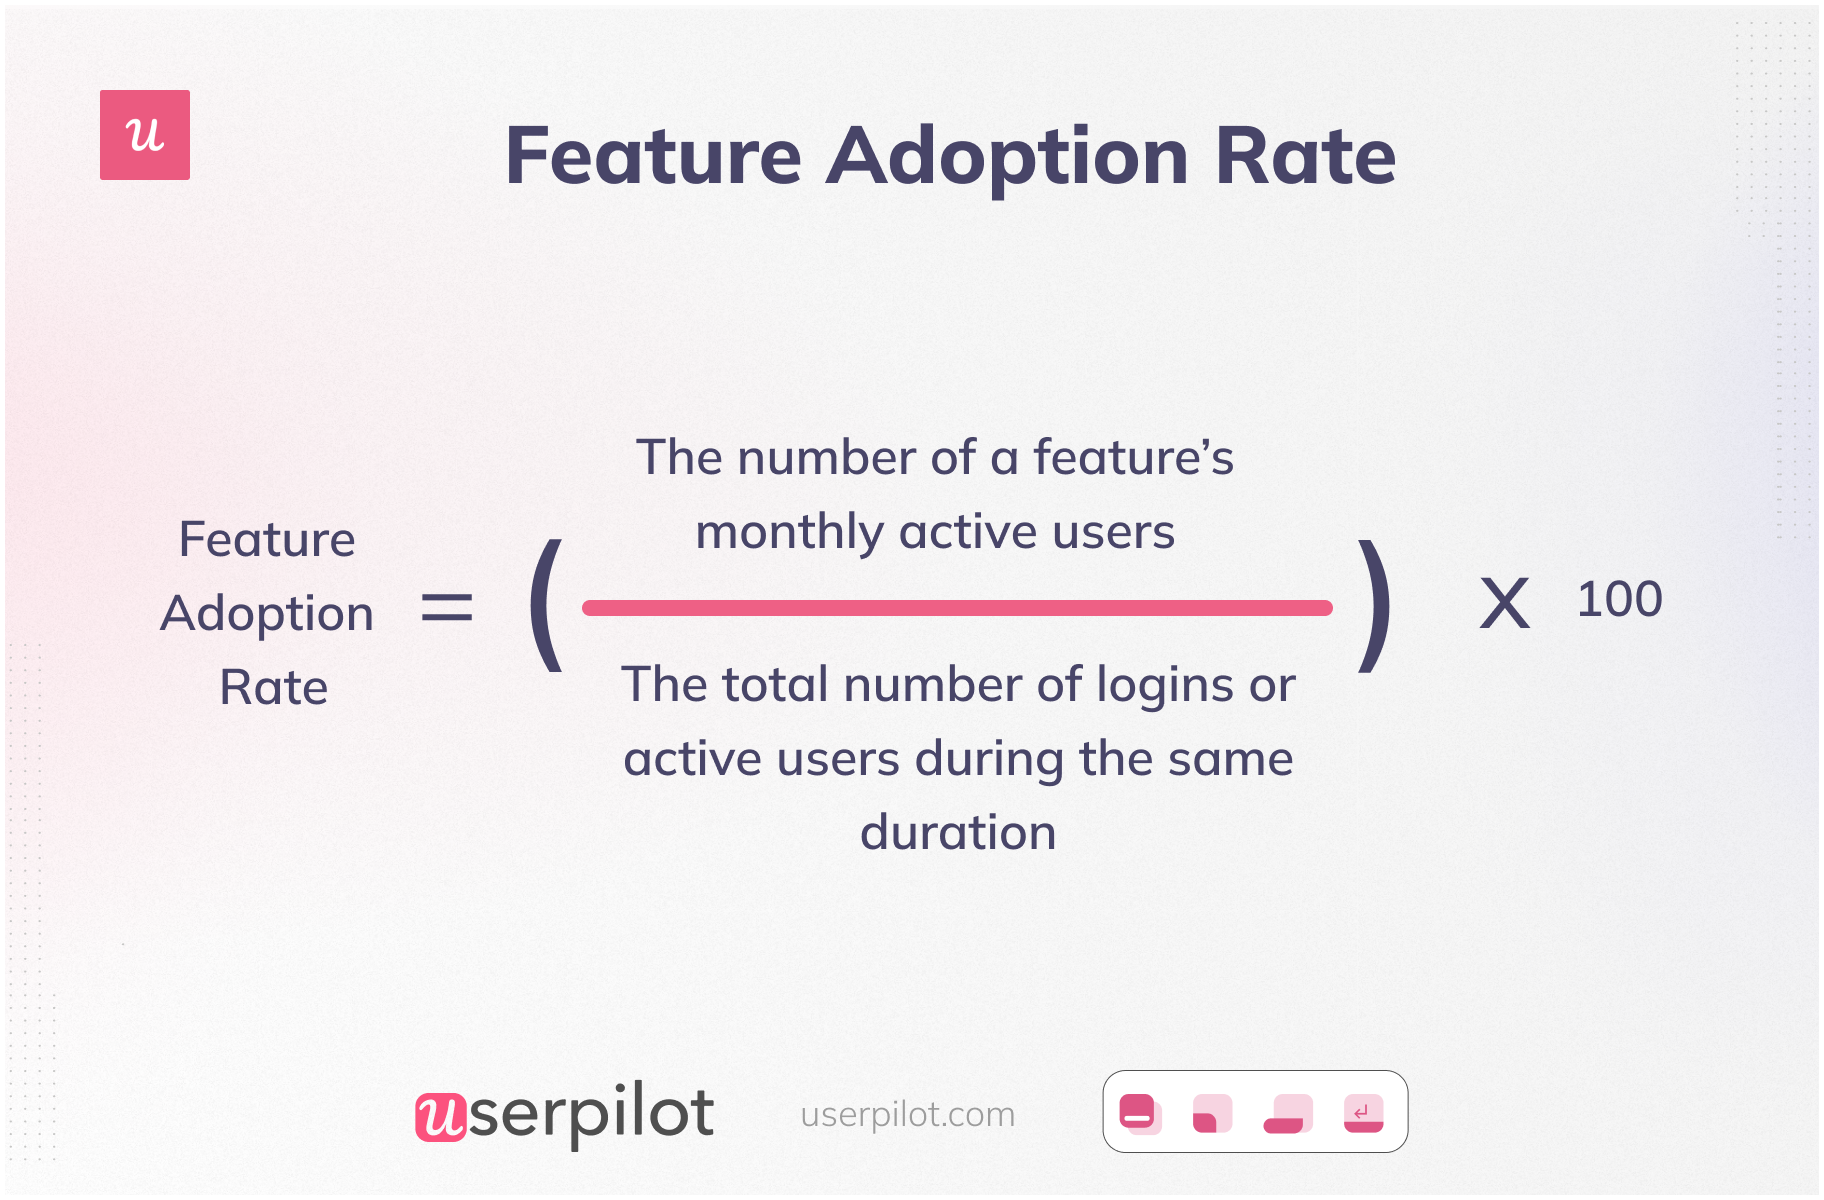
Feature adoption rate
Measuring the feature adoption rate can help you understand how well your existing users continue to adopt your product features. It helps you drive feature adoption as you can make more informed decisions while developing your product adoption strategy for your most relevant features.
You can calculate the feature adoption rate with the following formula:
Time to Value
Time to value is the time it takes for your users to gain value from your product.

You need to make sure that you can minimize time-to-value as much as you can.
Measuring it will help you keep tabs on the adoption trends within your product and alert you of potential friction points in the user adoption journey.
Removing friction in your onboarding flow and guiding users toward the activation point faster will increase product adoption.
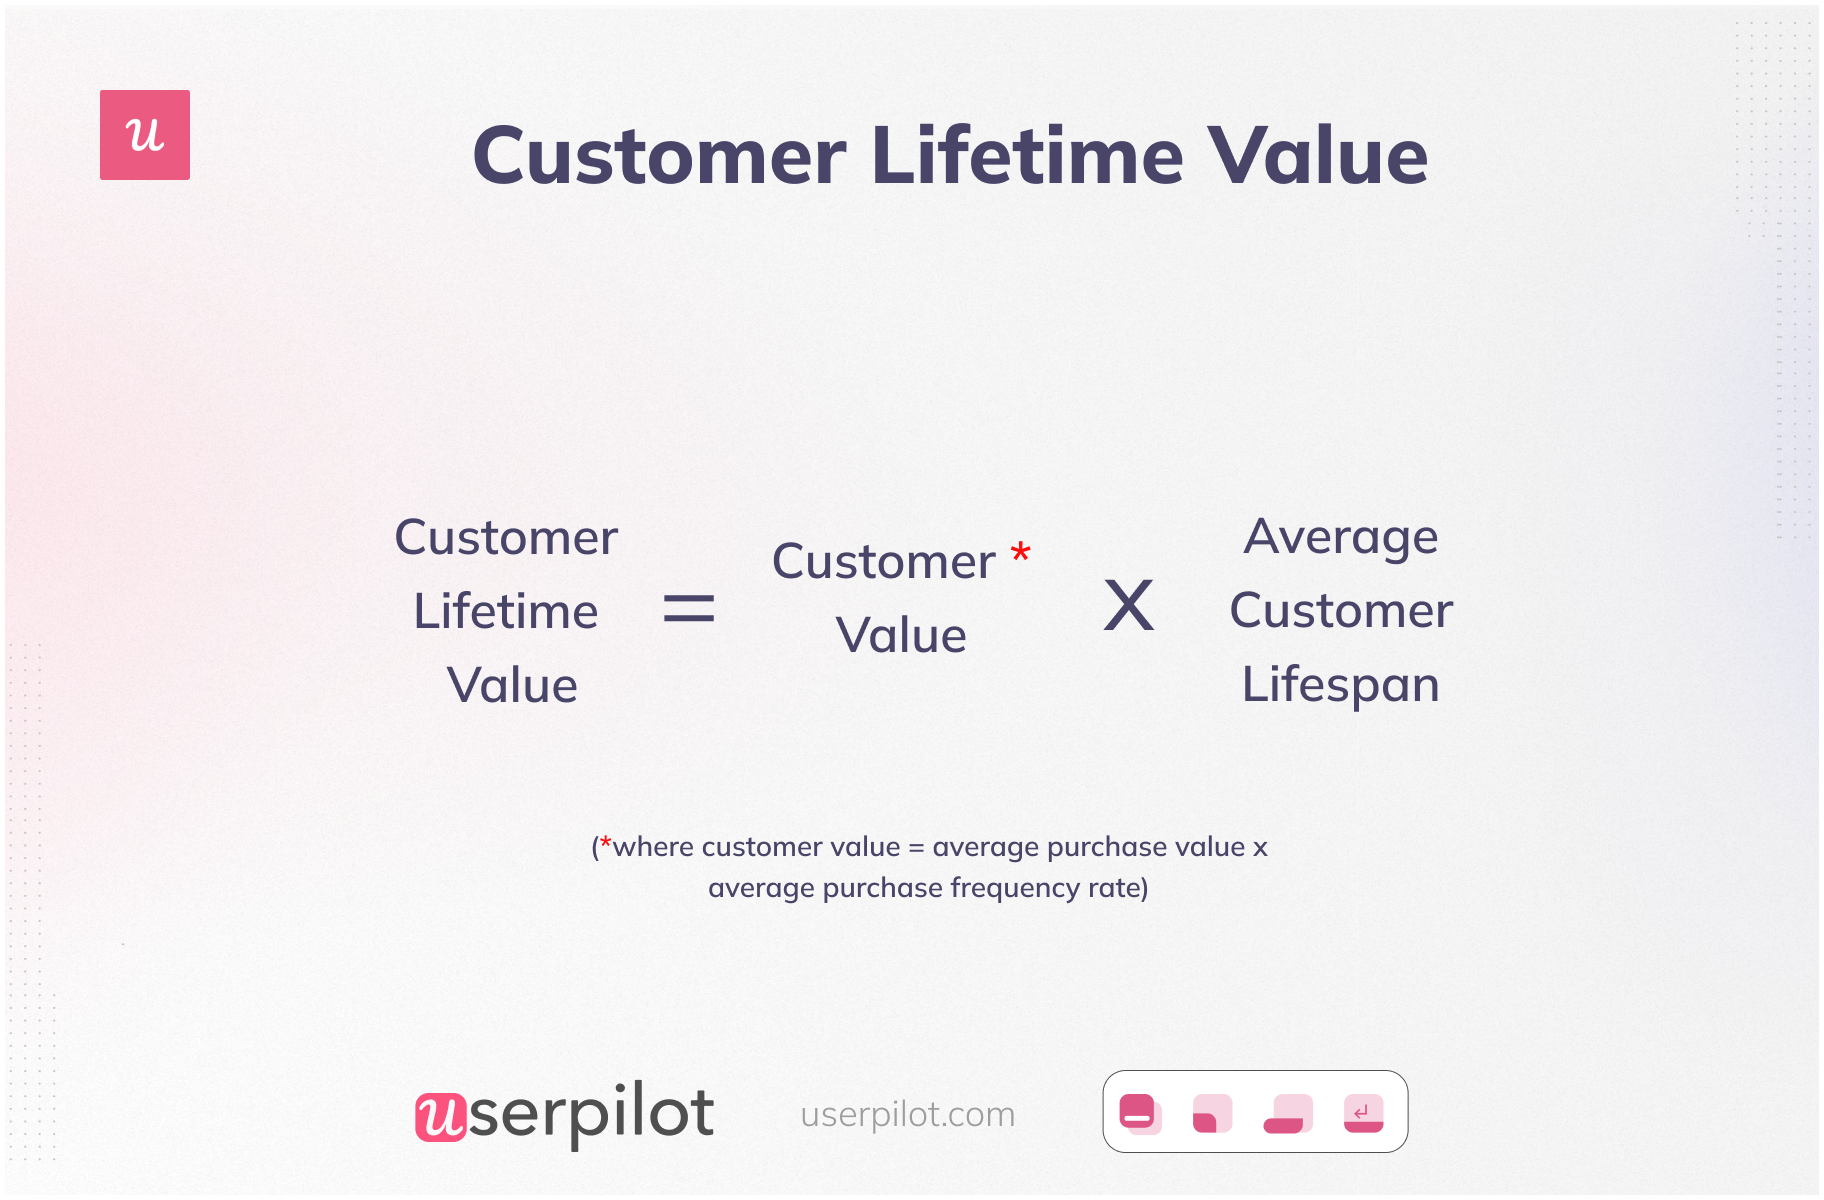
Customer lifetime value
Customer lifetime value (CLV) measures the financial contribution of a customer during their lifetime as a customer.
A high CLV means that customers are staying loyal and renewing their subscriptions. Whereas a low CLV means that you have a product adoption problem.
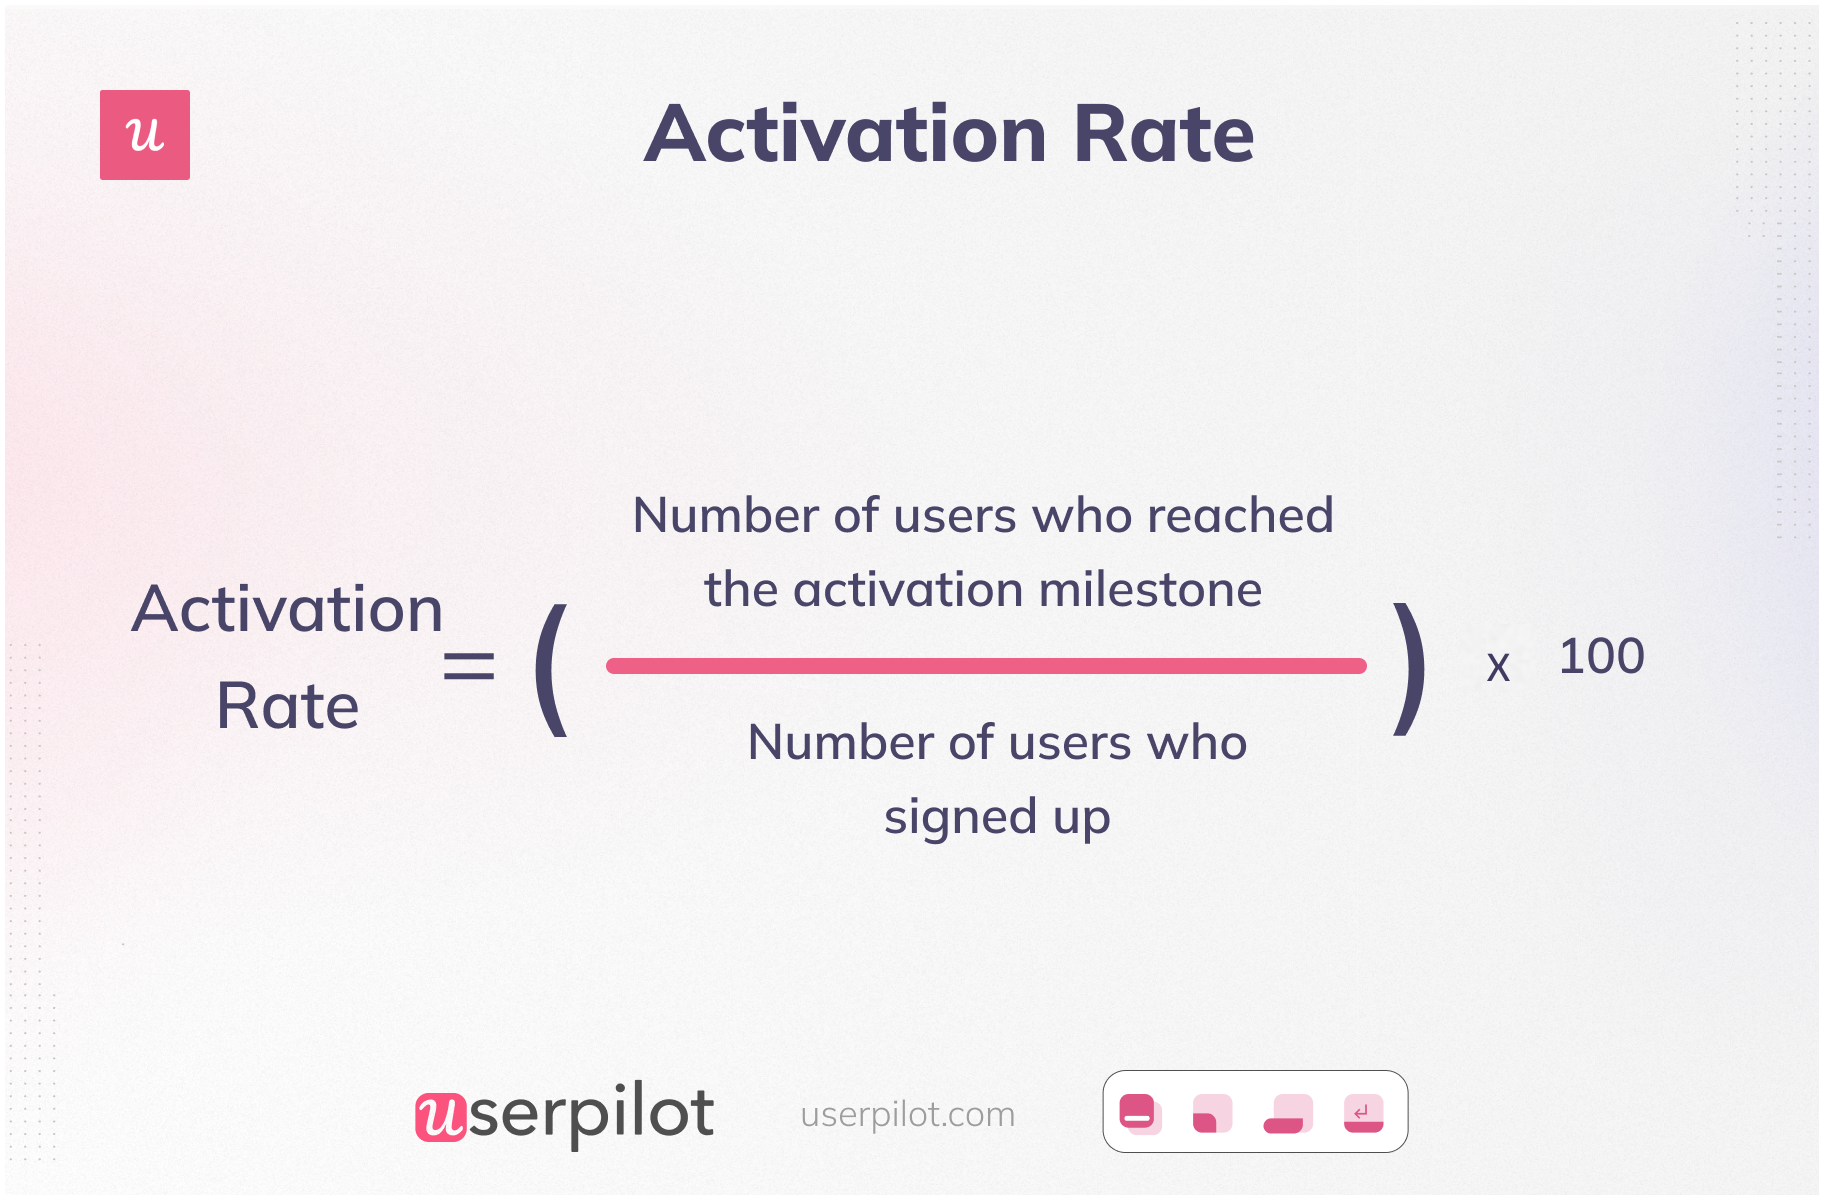
Activation rate
The activation rate measures the number of users reaching the activation point in the user journey. Measuring the activation rate helps show how successfully you drive the new users to complete activation.
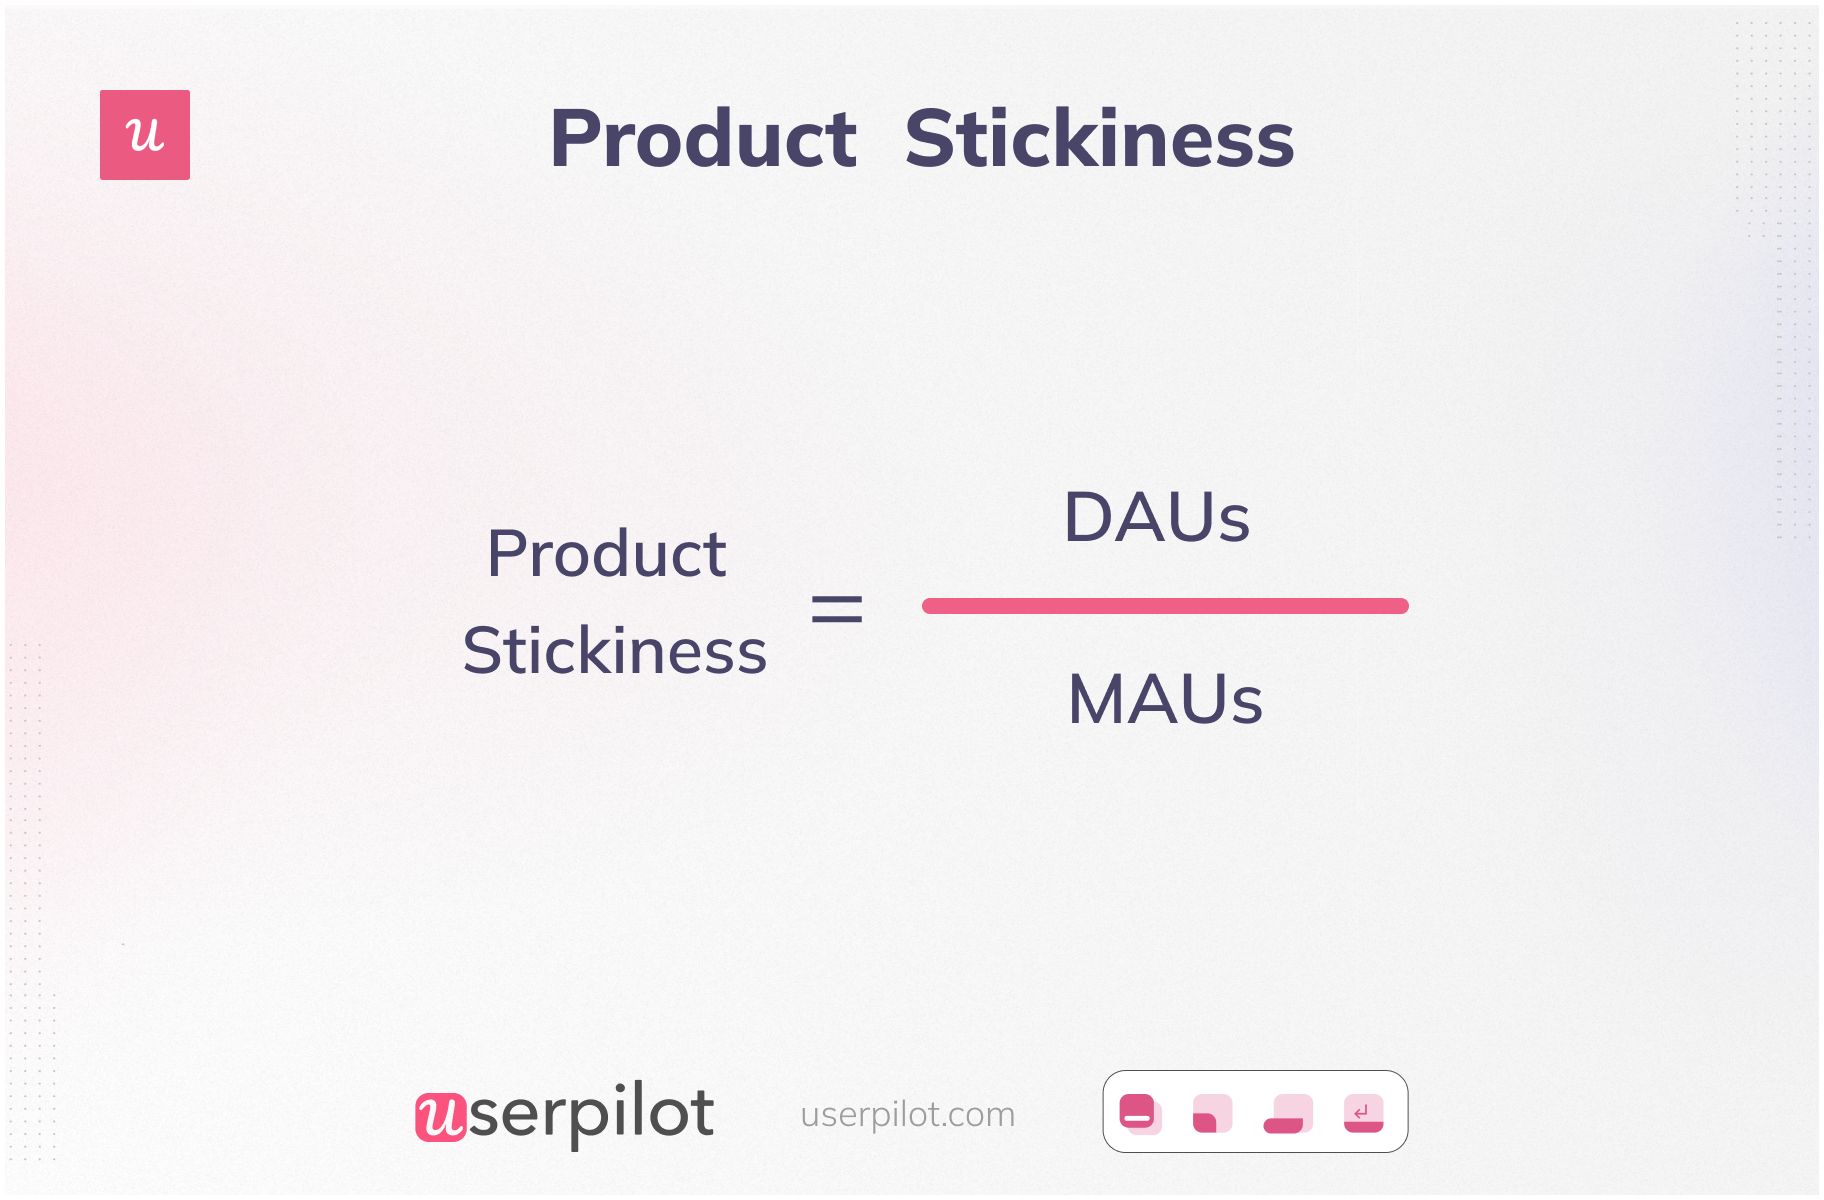
Product stickiness – Daily active users and Monthly active users
Product stickiness is how well your product retains and engages users over an extended period. You can measure it with daily active users or monthly active users (maus). Or you can use weekly active users, depending on your goals.
User retention rate
Customer retention rate is the number of customers you retain over a specific time frame. It can show you how well your onboarding process is, demonstrating the value your product can offer them and how well it activates them to continue using it.

A low customer retention rate can indicate friction in your product adoption strategy that you might want to investigate further.
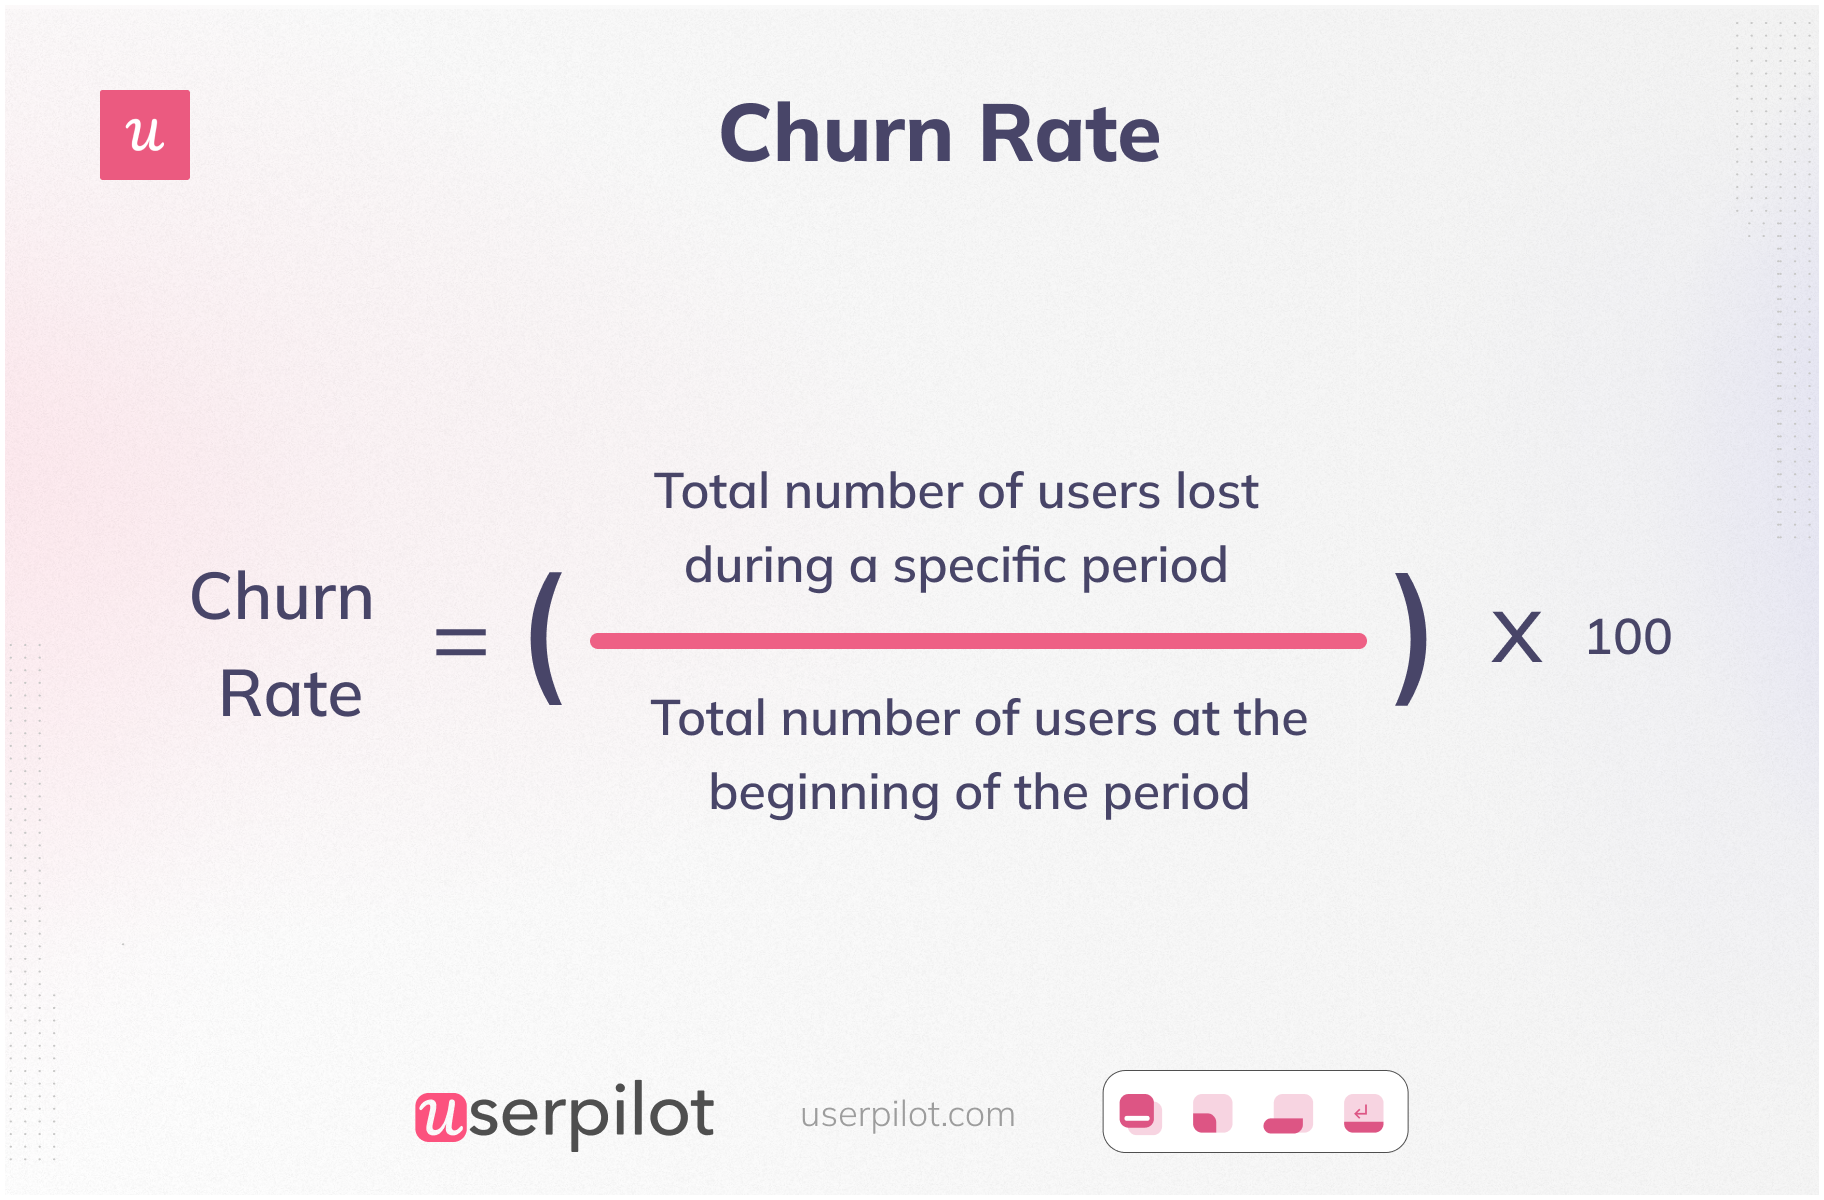
Customer churn rate
Customer churn rate is the number of customers that stop using your product over a specific time frame.
Initially, it shows you how many users fail to adopt your product so you can investigate why and improve the product adoption process.
Net promoter score (NPS)
Net Promoter Score (NPS) is a metric that helps to measure customer loyalty and satisfaction towards your product. It is an important metric as a high score means that your existing customers are happy, user expectations are met, and they have successfully adopted your product.
In contrast, a low score shows they are dissatisfied and lets you know something needs improving.

How to encourage adoption to improve product adoption metrics
Now that you know the metrics to track when measuring product adoption, you might be wondering how these metrics fit into your overall product adoption strategy.
Let’s take a look at a few ways you can help new users adopt your product and improve product adoption metrics.
Shorten the time to value with a personalized user onboarding process
The purpose of primary onboarding is to drive users to the activation point so they can experience the value of your product.
You can make onboarding more relevant and personalized to users by segmenting new users by using a micro survey on the welcome screen.

A welcome screen will help you collect useful information about your user’s job to be done, which will allow you to better understand their needs, identify features that will help them meet their goals, and personalize the onboarding process.
Use an onboarding checklist to guide users to the activation event
Once users complete the survey, and you identify your user segments, use an onboarding checklist personalized for each use case to encourage users to engage with core features and relevant content for their use case.

Use tooltips to encourage the adoption of secondary features and increase the customer lifetime value
Your primary features are the core product features that get the job done. Secondary user onboarding highlights the features that add value on top of these primary features.
You need to make sure users discover and adopt the features that are relevant to their use cases.
For instance, you can use tooltips as a part of your secondary onboarding to help users discover the features that are relevant to their use cases.
Tooltips also provide helpful information about the feature and teach users how to adopt them properly.
Create in-app experiences code-free!
Collect user feedback to improve customer experience
Feedback helps you uncover insights that will be instrumental to improving your SaaS product adoption strategy and enhancing the user experience.
There are different ways to collect feedback and measure product adoption: from relational Net promoter score (NPS) to quick customer satisfaction surveys.
Choose the survey types that best suit the data you want to gather. Also, practice collecting both qualitative and quantitative feedback to get a holistic understanding of the user experience.

Afterward, act on your insights to improve the user experience.
Check the user behavior to identify and fix friction points
You can monitor user behavior to see what parts of your product that bring value are not being adopted by different user groups.
Track feature usage with feature tags to determine how users interact with different and where they spend most of their time.
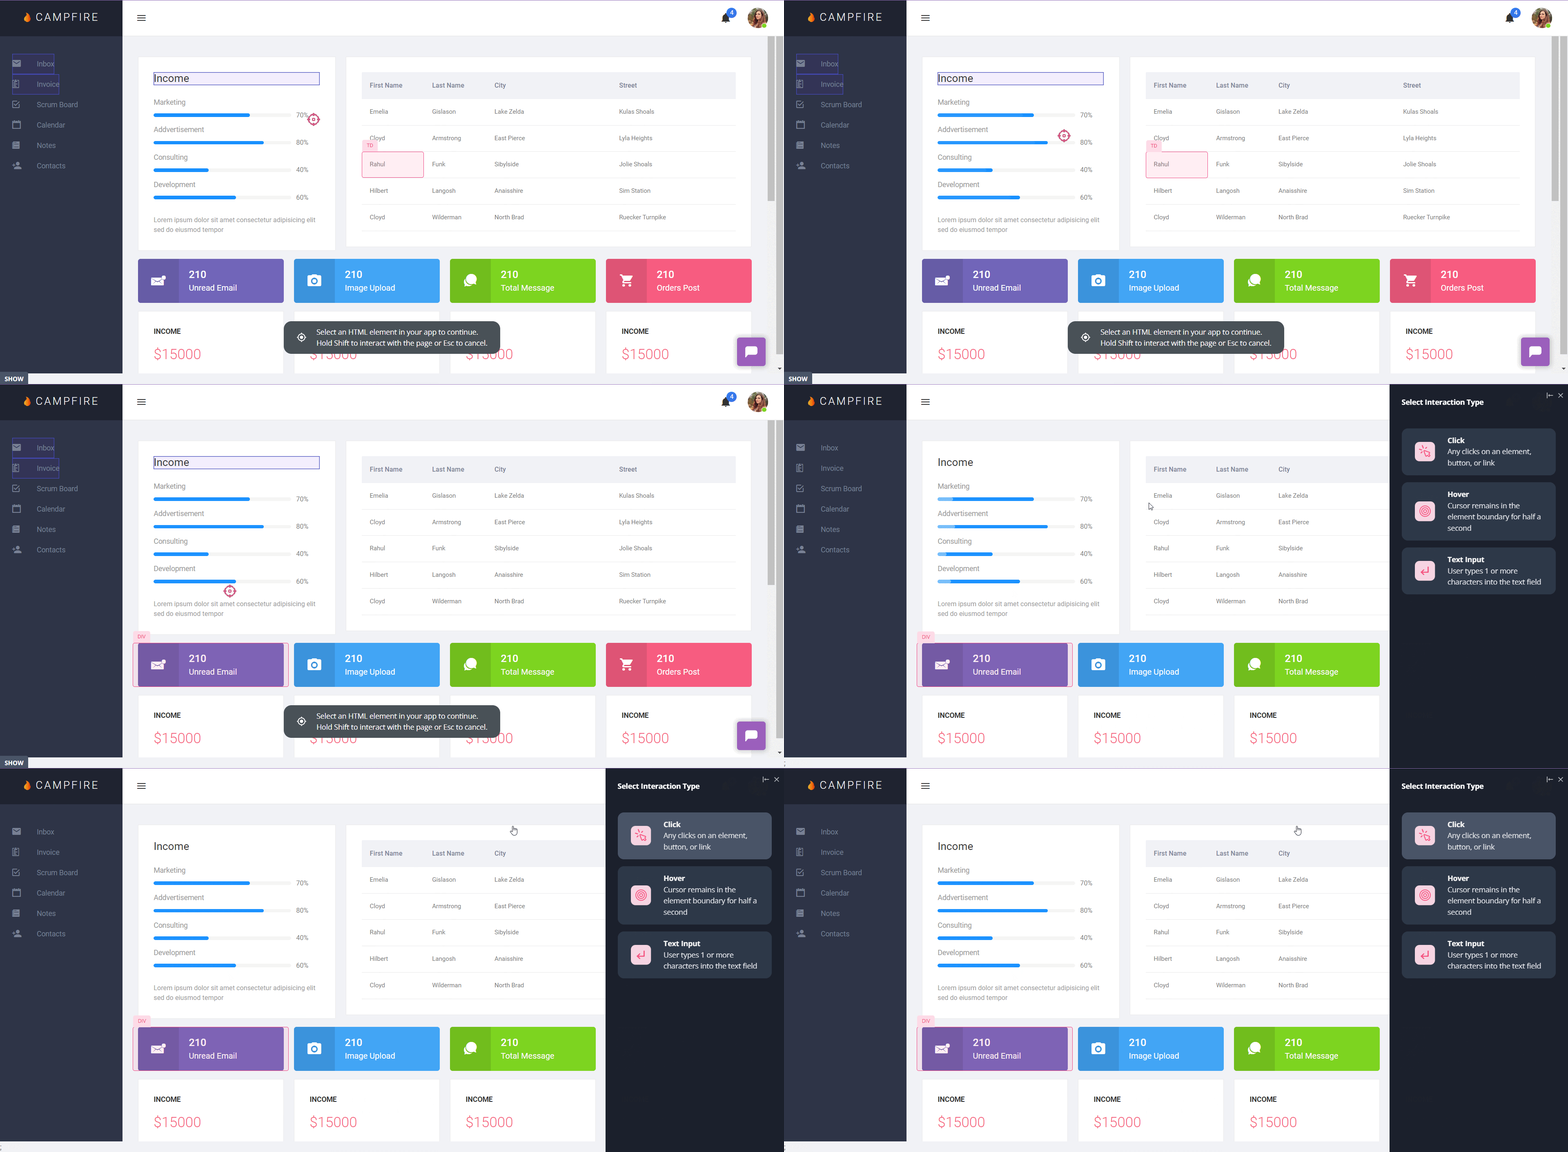
If new users aren’t using certain key features, it reduces the chance of product adoption. You can identify underperforming areas of your product with feature tags and contextually prompt user interactions to adopt these features.
Duplicate the happy path of paying customers to improve product adoption
To ensure the success and retention of your customers, take a look at the journey of your paying customers; what features do customers interact with the most that drive constant value? Where do they spend most of their time? etc.
By analyzing their behavior and interactions with your product, you can duplicate their path for new active users with the same goals, and ensure that they have a similar experience and adopt the product sufficiently.
By guiding new users along a successful path and encouraging them to interact with key features, you increase the likelihood of their long-term product adoption and retention, ultimately driving the growth and success of your SaaS business.
Track and improve SaaS product adoption metrics with Userpilot
Userpilot is a product growth platform that helps you track product adoption metrics and engagement and build flows to improve them.
Track product adoption metrics and engagement
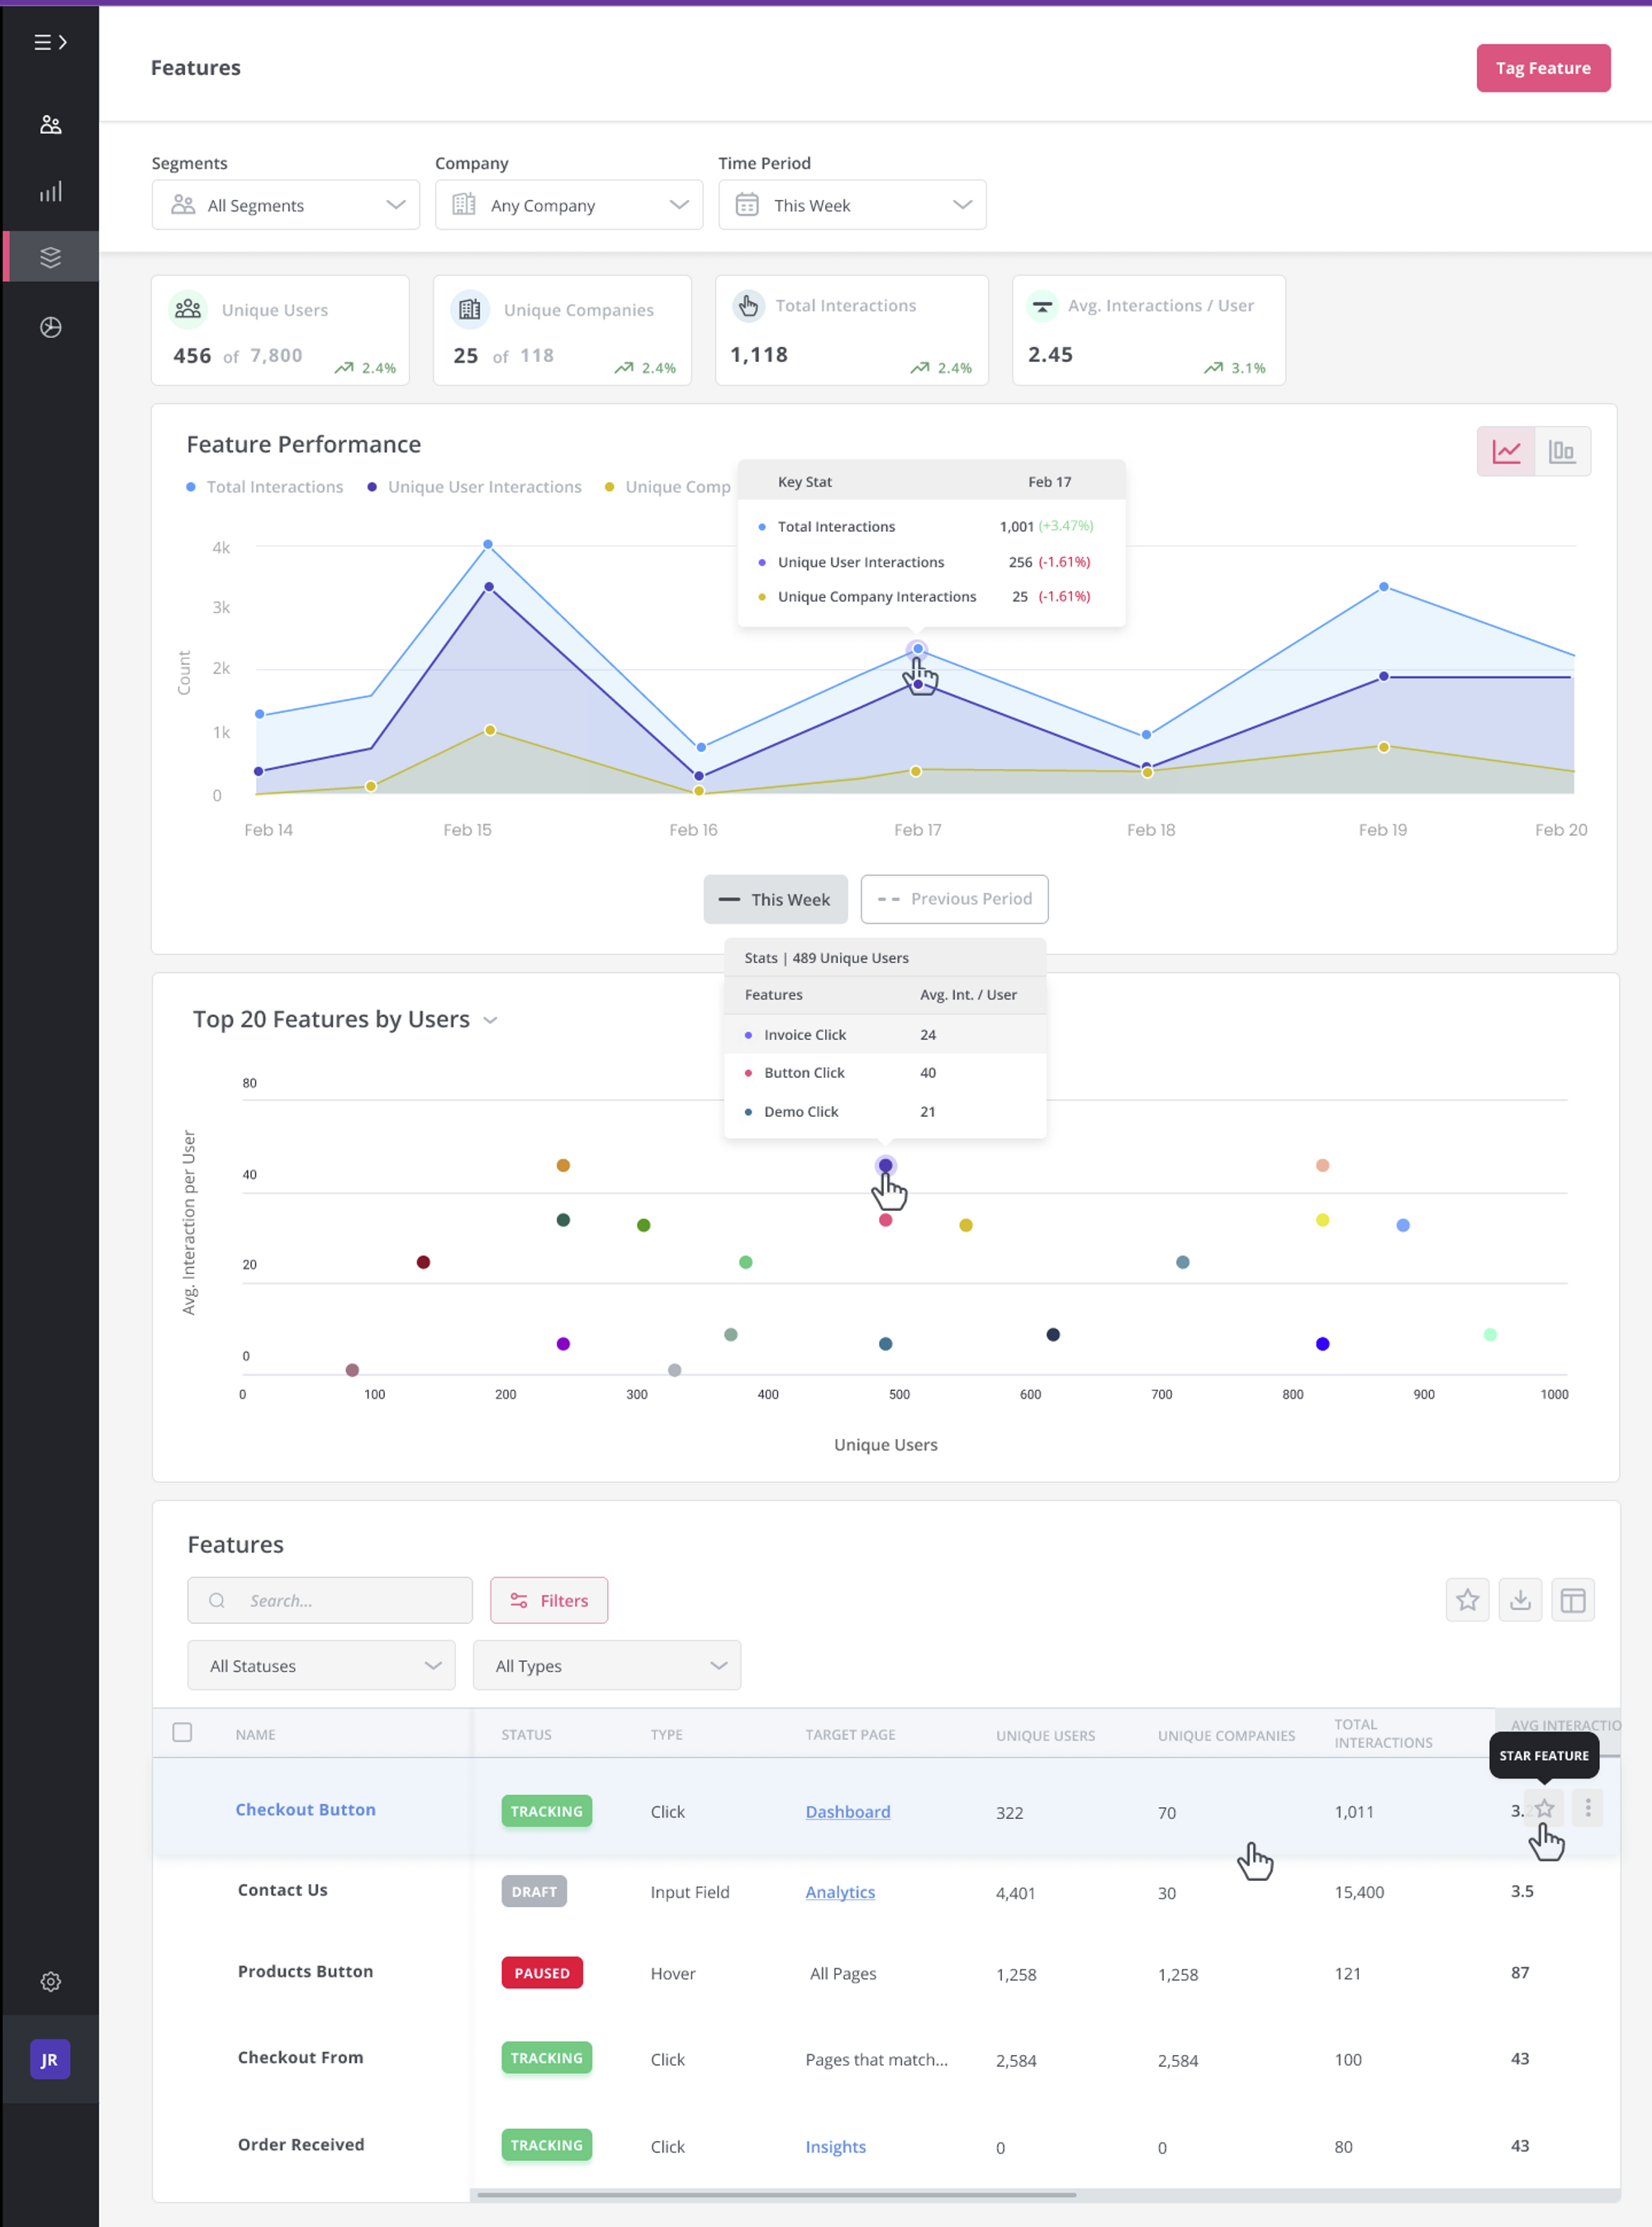
You can easily track engagement and adoption metrics inside the analytics dashboards.
You can also easily track feature usage by using feature tagging, which lets you tag any UI element in your app dashboard and track how many times each user engages with it.
Increase product adoption metrics with in-app flows
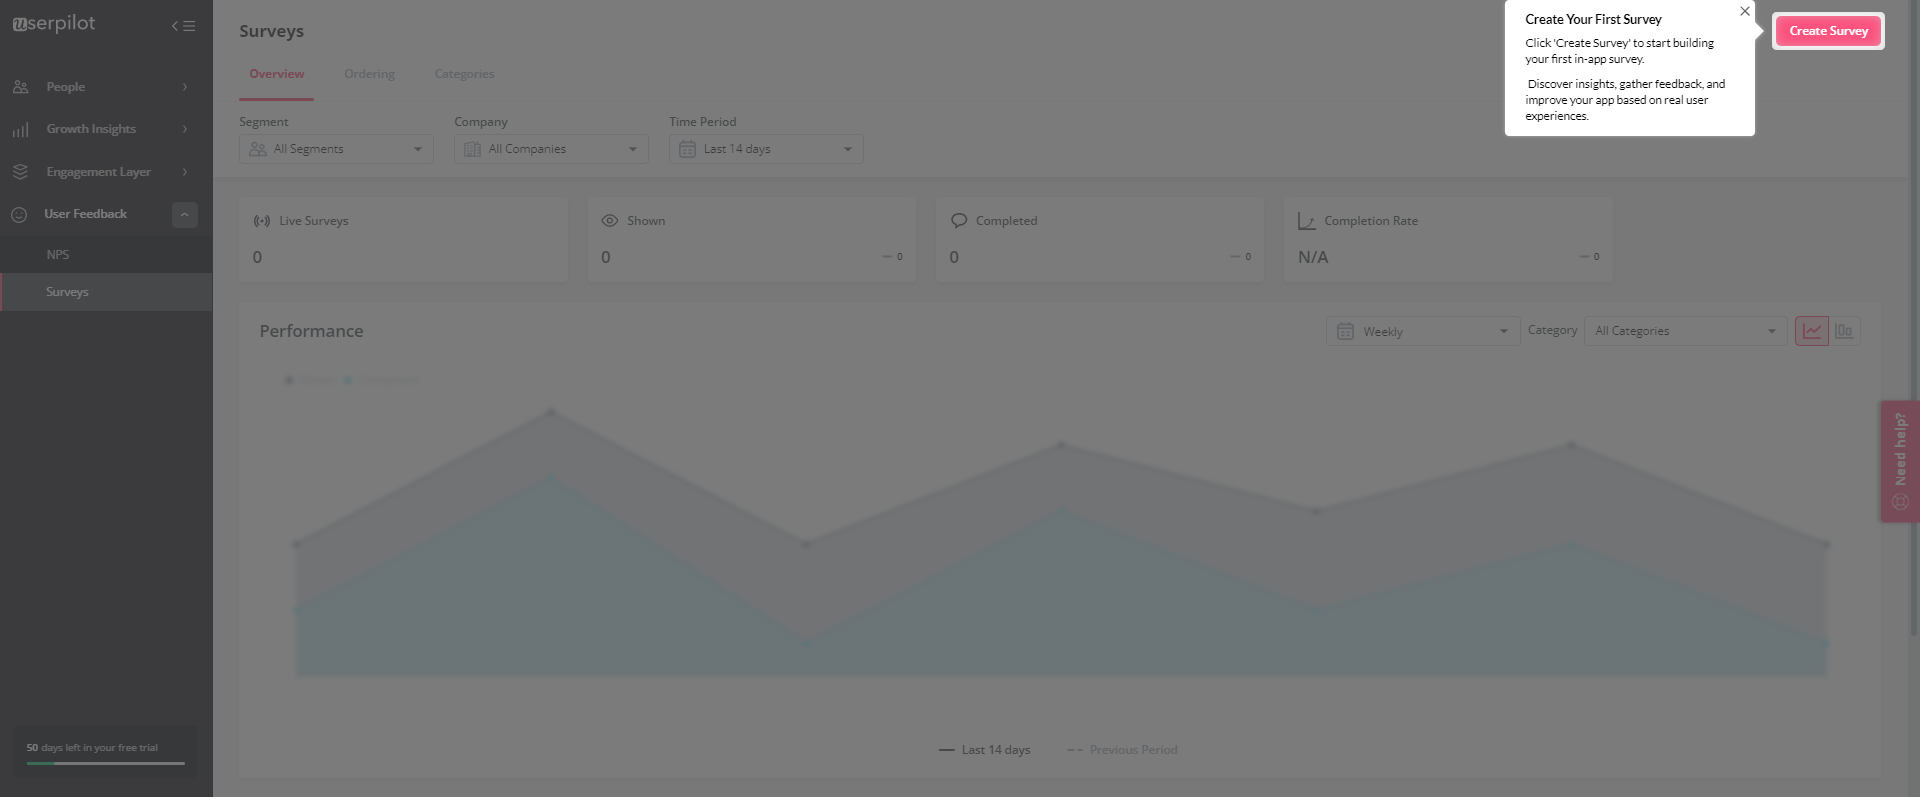
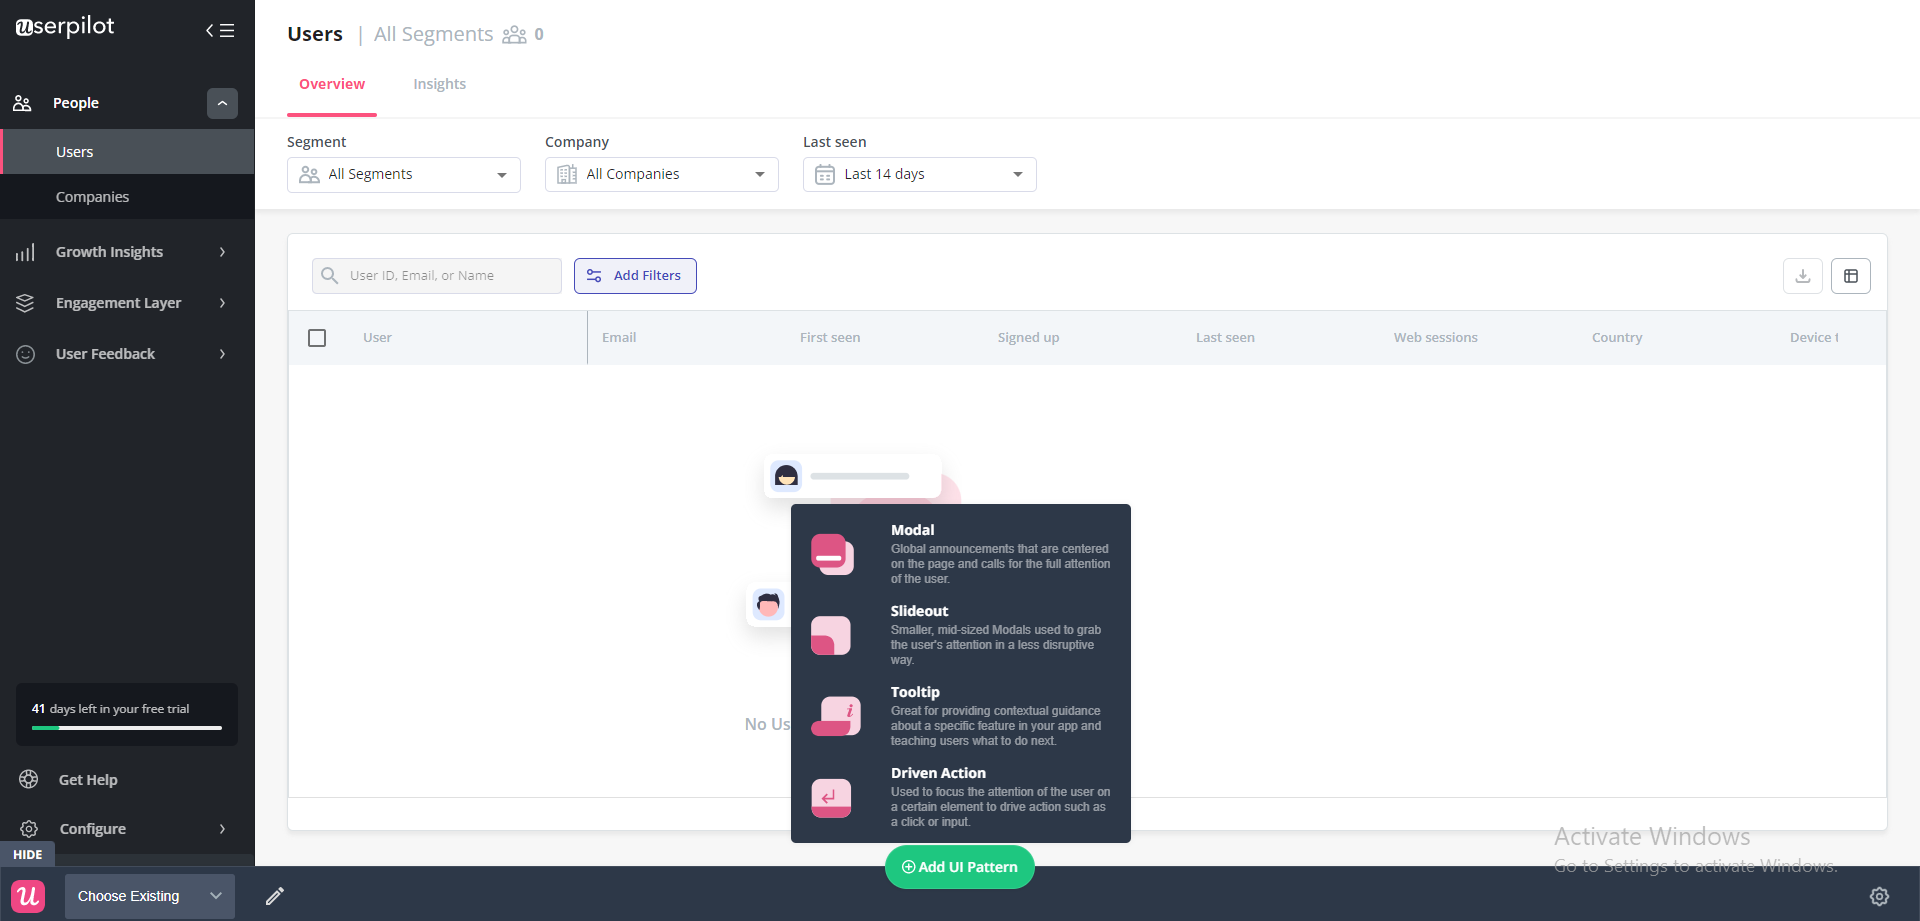
You can build the in-app flows that we mentioned in the previous sections. This includes interactive walkthroughs, checklists, modals, welcome screens, and more that drive user engagement and impact feature adoption.
You can select from a range of customizable UI patterns that best fit your product adoption strategy.
Experiment with different user adoption strategies
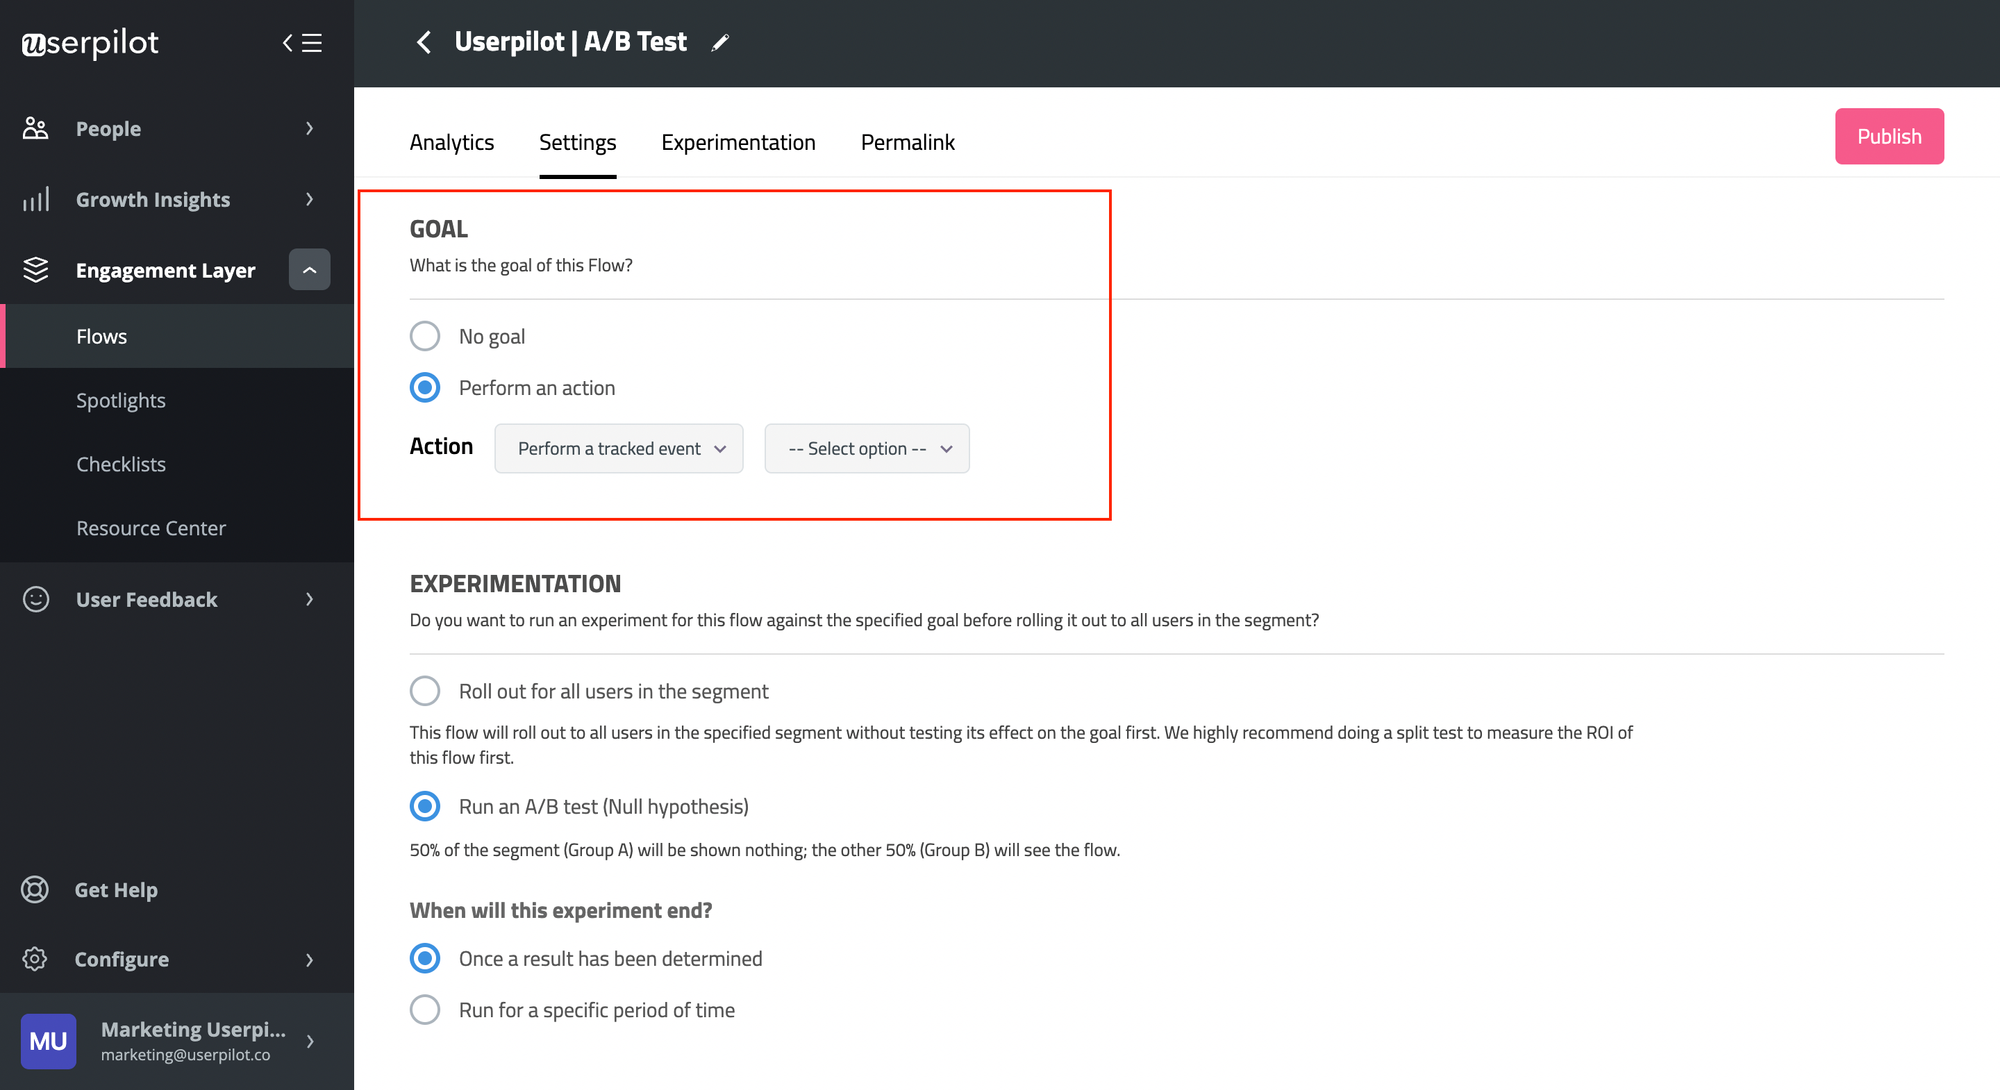
You can even run A/B tests to see which elements of your strategy result in higher product adoption rates.
You can align results tracking with specific goals, and tweak user experiences all within Userpilot.
Conclusion
Tracking the right SaaS product adoption metrics is an essential part of your product adoption strategy.
We’ve covered more than just the essential metrics in this post, including the best ways to measure these metrics, and how to improve them.
Keep in mind that your SaaS product was built to offer value to your target user base. So, it’s your responsibility to help them understand this value.
Want to increase the total number of users who adopts your product? Book a Userpilot demo and get started!
Track and improve SaaS adoption metrics with Userpilot





![What are Release Notes? Definition, Best Practices & Examples [+ Release Note Template] cover](https://blog-static.userpilot.com/blog/wp-content/uploads/2026/02/what-are-release-notes-definition-best-practices-examples-release-note-template_1b727da8d60969c39acdb09f617eb616_2000-1024x670.png)

