How to Identify and Reduce User Drop-Offs in 7 Steps


Drop-off analysis feels deceptively simple at first glance. You figure out where users leave, find the problem, and fix it. But if that’s all you’re doing, you’re probably missing the bigger picture.
All drop-offs leave a trail of signals that tell where the product failed users. It’s up to us to connect the dots and take action to prevent soaring drop-off rates.
Mind you, spotting these clues isn’t the big deal, a decent product analytics tool should do the trick.
The real challenge is understanding what those behavior patterns mean in the context of your product. Without that, you’re left guessing and making changes blindly, hoping something sticks.
I’ve put together seven steps to solve that exact problem. By the end of these steps, you’ll be able to pinpoint where users drop off, understand why this is happening, and fix it before they give up on your product entirely.
How to identify drop-off points and remove them?
Let’s get straight to the steps that’ll help you plug those drop-off gaps.
1. Choose and set up a product analytics tool
Before anything else, you need data to work on to understand why your funnel drop-offs occur. An all-in-one analytics platform like Userpilot helps you track behavior patterns without the fear of data inconsistencies.
To get started, simply install the tracking code provided by your product analytics tool in your app. After that, define your key events like signup and activation to begin the drop-off analysis.
2. Analyze user funnels to locate drop-offs
Once you have the data, select a specific funnel to monitor, preferably one with high impact, such as onboarding or renewal.
Create a funnel analysis report and analyze conversion rates between funnel stages to pinpoint where most drop-off rates occur. At this stage, we’re concerned with identifying who dropped off and where – we’ll cover the why section in the next step.
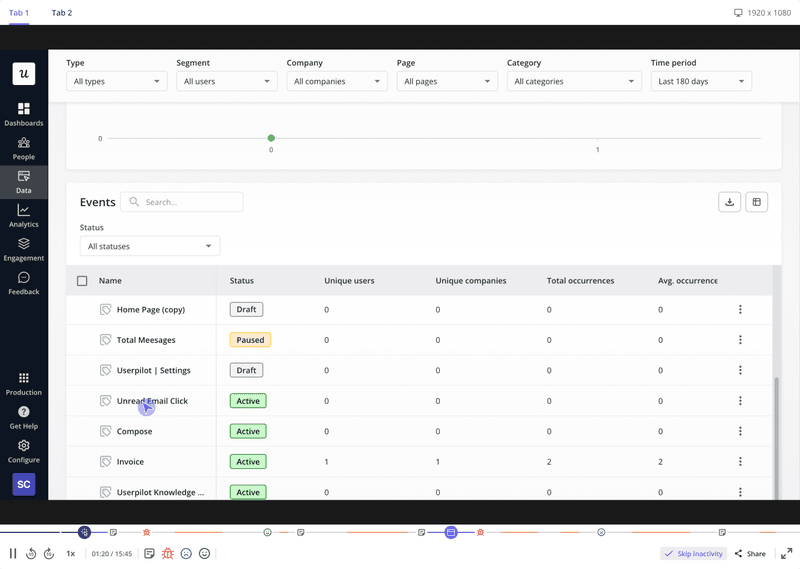
When you use Userpilot to analyze your funnel, finding these insights takes just three clicks:
- Select events of a funnel you want to analyze and click on ‘Run Query’.
- Hover over the lighter-colored block on the bar chart.
- Click on it to see the exact users who left at that stage
3. Watch the session recordings of dropped-off users
After obtaining the list of users who dropped off, watch their session recordings to determine common friction points in the customer journey.
Let me tell you why I love session recordings for this – they show exactly what frustrates users. For instance, a user rage-clicked a button 5 times and eventually abandoned the journey when nothing loaded. That’s the kind of specific insight you need.
Here are some common signs of frustration you can spot with session recordings:
- Rage clicks (>3 clicks/second in the same area): The user expects an action but nothing happens (broken user flow or technical issue).
- Repeated back-and-forth page navigation: The user is lost in your product flow.
- Hover without clicks on buttons: Clickable elements aren’t clear enough.
- Multiple clicks on help/support links: Features need better in-app guidance.
- Sudden exits after page load delays: Performance problems need fixing.
But, before making any decisions about the user journey based on these friction points, gather context by grouping session recordings with similar behaviors.
One user struggling might be an outlier, but when you group the session recordings and spot the same patterns across them, you’ve found a real problem lowering funnel conversion rates.
![]()
Start Analyzing User Drop-Offs with Userpilot Today!

4. Conduct customer interviews for deeper insights
Here’s where you get to the heart of the issue.
Interview a sample of users who dropped off to understand the ‘why’ behind their actions. Interview them in a timely fashion so the experience is still fresh in their minds. This way, they are more likely to remember exactly which features caused friction and where your product workflow broke down.
Ask descriptive questions in order to get detailed insights. Ask “How was your experience with [feature]?” instead of “Did you like [feature]?” or “Walk me through how you use analytics” rather than “Do you check dashboards daily?” to find unexpected use cases and pain points.
Once users have shared their experience, fill any gaps in your understanding with specific questions.
To put it clearly, here you’re trying to understand how users think your product should work versus how it actually does. Don’t mistake this for a feature request or product demo session.
5. Prioritize drop-off causes based on impact and effort
There will always be too many UX issues that you can resolve at a given time. Instead of trying to fix everything, focus on high-impact, low-effort changes that drive quick improvements in your drop-off rates.
Let’s understand this with an example.
During analysis, you find these friction points causing drop-offs:
- Users can’t track onboarding progress (40% drop-off)
- Unclear error messages during integration (25% drop-off)
- No guidance for API key setup (15% drop-off)
- Missing confirmation after saving changes (12% drop-off)
- Complex navigation in the settings menu (8% drop-off)
While the onboarding issue needs a 3-month redesign, the other four issues drive a 60% drop-off rate, and each takes just a few dev hours to fix. Your roadmap should start with these quick wins while planning the bigger redesign. Plus, you can test hypotheses faster with smaller changes.
6. Implement changes to reduce drop-off rates
Whatever funnel drop-offs you address will depend on the issues you’ve found and prioritized, but the main goal is to push users toward all the end stages of the user journey.
Below are some more techniques that you can use.
Incentivize the completion of key events
Users often leave when they encounter complex setup steps because the effort seems higher than the immediate benefit. To solve this friction, you can incentivize the completion of key steps. For example, let users access premium features to give them a sense of advanced functionality.
To make the journey even more swift and encourage users to keep going forward, add progress bars showing the setup completion percentage.
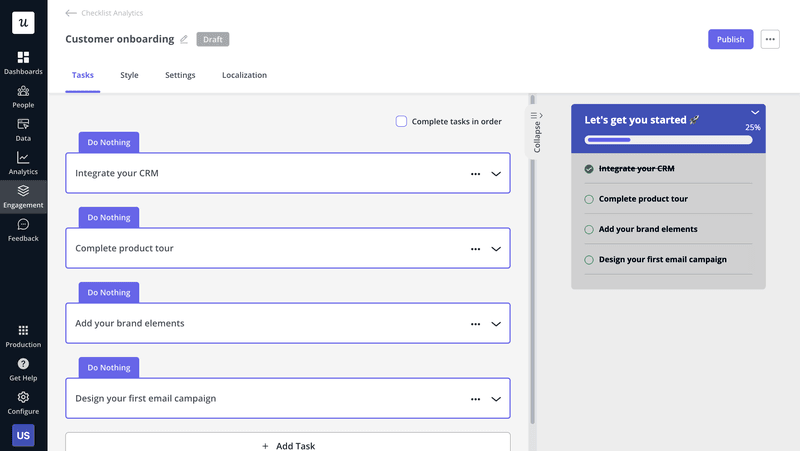
As you can see in the image, the combination of a progress bar and ordered checklist helps users track their advancement (25% complete) while knowing exactly what steps lie ahead.
Watch how power users navigate the app and replicate their flow
Monitor power user paths and watch their session replays to see their behavior and navigation patterns. These are users who have achieved success with your product and you should capitalize on that.
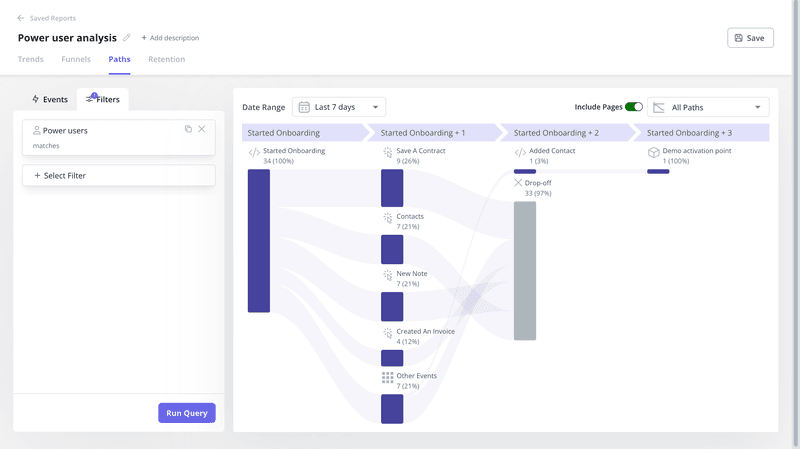
Study these proven user paths to replicate successful behaviors and increase funnel conversion rate. For instance, if power users typically set up integrations before customizing dashboards, adjust your onboarding to guide new users through integration setup first.
Personalize the experiences for different customers
Showing all features to everyone can confuse and overwhelm them. Even data supports this. 72% of B2B users expect personalized experiences while using a product.
Notion, for example, gives a personalized experience by customizing the interface based on user type.
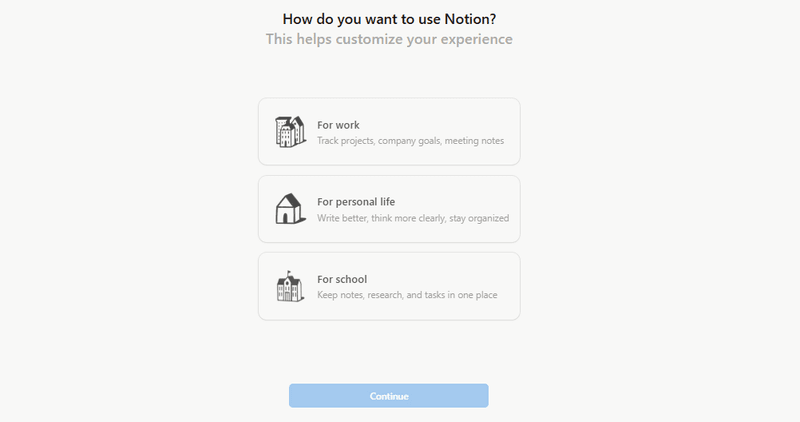
When someone signs up for personal life or school, they see a clean, simple UI. However, those clicking on work get a more detailed interface with ready-to-use templates, saving them the trouble of building everything from scratch.
RecruitNow is another excellent example. The recruitment company makes its product feel right at home for every user through Userpilot’s localization features.
When someone logs in from a non-English-speaking region like Germany or Austria, they see in-app resources automatically translated into their language, making the whole experience feel like it was built just for them.
7. Continuously improve the user experience to prevent drop-offs
Make both funnel performance analysis and session recordings a routine to spot new friction points.
As an extra measure, set up custom monitoring dashboards with key metrics like adoption rate and weekly retention.
This dashboard will serve as your early warning system, alerting you to potential friction points when metrics deviate from normal patterns.
Begin analyzing drop-offs with Userpilot
While basic funnel drop-off tracking might show you there’s a problem, only a comprehensive solution like Userpilot gives you the full context and tools to actually solve it. You get all the features you need to tackle drop-offs effectively:
- Funnel analysis to pinpoint drop-off points.
- Session recordings to show points of confusion and failed interactions.
- Real-time dashboards to track user behavior patterns and changes.
- Built-in UI tools for quick fixes.
To learn more about how Userpilot helps you achieve lower drop-off rates, book a demo today.
Start Analyzing User Drop-Offs with Userpilot Today!
FAQ
What is drop-off analysis?
Drop-off analysis is a data measurement technique that helps product teams identify exactly where users abandon user paths.
The analysis reveals funnel drops by measuring percentage decreases between sequential steps, allowing teams to identify friction points across user journeys and optimize stages with high abandonment rates.
How to calculate drop-off rates?
The drop-off rate is calculated by dividing the number of users who abandoned a step by the total number who started it, then multiplied by 100.
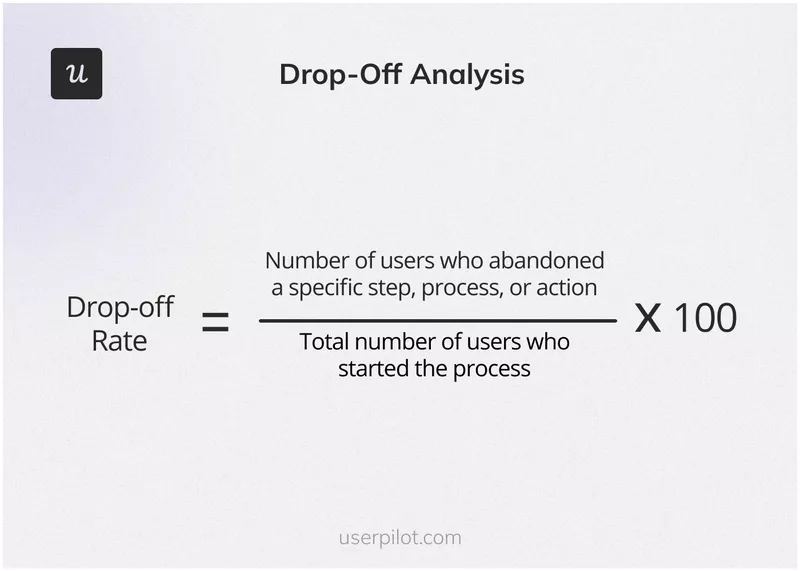
Let’s understand it with an example: Say 1,000 users start creating their first project dashboard in your SaaS, but 250 users abandon the process. Using the formula, the drop-off rate will be 25% [(250 ÷ 1,000) × 100].
What is a good drop-off rate?
Drop-off rates vary based on where users are in their journey. Let’s look at recent data to understand what’s considered “good” at different stages:
- For initial website-to-signup conversion, B2B SaaS businesses see drop-off rates between 97.7% and 99.1% – meaning only 0.9% to 2.3% of visitors convert.
- The average activation rate across SaaS products is around 37%. This means a 63% drop-off rate during the activation phase should be your baseline for improvement.
- For trial conversions, expect different drop-off rate benchmarks based on your model: opt-in free trials (no credit card) convert at 17-18%, while opt-out trials (with a credit card) perform better at 48%.
About the author