In-Depth Guide to Measuring and Increasing Feature Engagement


You spend months perfecting a new feature, only to see users ignore it like yesterday’s news. Sure, you believe the feature has value. But your adoption numbers tell a different story.
Why?
Because building the feature is only half the battle. Getting users to engage with it requires strategy, measurement, and a clear benchmark to determine what’s working and what’s not.
That’s why measuring feature engagement is not just a nice-to-have. It’s a north star for product managers. Without it, you cannot know if users are finding the value you worked so hard to create.
Why product teams should track feature engagement
Tracking feature engagement is more than a checkbox in your analytics setup. It’s a compass for product teams navigating the complex world of user behavior. Here’s why it’s indispensable:
Validate product hypotheses
Every product idea starts with a hypothesis: “Users need this feature to solve X problem.” However, without engagement data, how do you know you’re right? Feature engagement metrics act as your evidence.
For example, if you launch a new dashboard and only 15% of users interact with it, that’s a clear signal your assumption about its value might be off. Tracking these metrics allows you to iterate confidently, focusing on features that meet user needs.
That’s precisely why tracking engagement must go hand-in-hand with awareness campaigns. Monitoring usage can tell you if poor engagement stems from a lack of interest or visibility, which can help you adjust strategies accordingly.\\
Inform product development decisions
Engagement data tells you where to focus your resources.
For example, if users consistently engage with a collaboration tool but ignore a reporting feature, it’s a signal to invest more in enhancing collaboration capabilities. This data-driven approach ensures you’re building what users truly want, not what you think they want.
Feedback is valuable but often anecdotal and skewed. Engagement data provides the objective layer needed to complement qualitative input, giving a fuller picture of what users actually do versus what they say they want.
Estimate revenue impact of features
Imagine you’re deciding whether to improve Feature A or launch Feature B. By tracking engagement metrics and tying them to business outcomes (e.g., upsells, subscriptions), you can estimate their revenue impact.
For instance, if Feature A has 30% engagement and correlates with a 10% higher renewal rate, you have a concrete basis for prioritization.
User journey analysis can bridge this gap. Tracking how engaged users progress through their lifecycle can highlight features contributing to higher conversions, even if the relationship isn’t linear.
Is feature engagement equal to feature success?
There is a dangerous assumption among product teams that high feature engagement automatically signals success.
This misconception can lead product teams astray, optimizing for usage metrics while missing the bigger picture of true feature effectiveness.
Feature engagement and feature success, while related, tell fundamentally different stories about product performance. Engagement captures the quantitative aspects of user interaction: clicks, time spent, and usage frequency. Feature success is about its value realization.
Success asks the deeper, more challenging question: Does this feature effectively solve the problem it was designed to address? While high engagement might indicate user interest, only success metrics reveal whether the feature delivers meaningful results.
How to feature engagement metrics can lead to wrong conclusions when you improve retention
Imagine you’re part of the product team for “Taskflow,” a platform that helps teams manage their daily tasks and projects.
You launch a new “Workflow Automation” feature, useful for long-term users who’ve been active on Taskflow for at least 30 days. Users only leverage it once they’re more familiar with Taskflow’s capabilities.
Next quarter, the team launches a new feature called “QuickStart Templates” that resonates strongly with newcomers. You notice this feature streamlines early adoption by guiding new sign-ups step by step and, in turn, significantly boosts short-term retention.
However, this feature doesn’t really affect usage patterns for long-term users who are well past their first month in the app (the same group who would be using Workflow Automation).
After you launch QuickStart Templates, the number of new users who stick around increases, which means your total active user count increases. However, the actual number of people using Worklows is about the same. Because there are more active users overall, you might find that the percentage of people using Workflows decreases.
This can be confusing for your team. They might think QuickStart Templates are stealing users from their feature or that something has broken. In reality, the percentage dropped because there’s a surge of new users—people who aren’t ready for advanced workflows yet.
Relying only on percentages can be misleading, especially when new user retention improves. If you look at cohorts or lifetime usage, you’ll see the workflow feature is still fine. The total pool of active users just includes more beginners. Advanced workflows remain most relevant for those who’ve been around longer.
What is wrong with engagement metrics that have active users in the denominator?
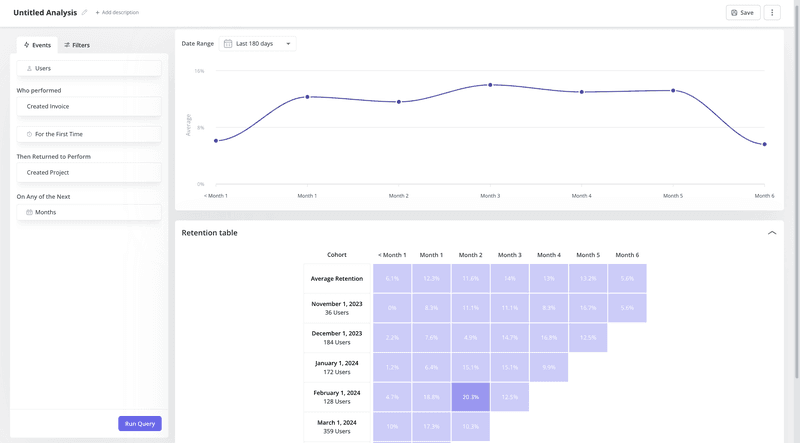
Let’s go back to our example: TaskFlow. When it launched in January, nearly everyone who used it was new. By June, however, the user base had expanded: Some customers had been using it for a few months, while others had just signed up. By November, TaskFlow boasted a larger proportion of “veteran” customers: teams using the platform for the better part of a year.
If you look at a metric like “Average Number of Tasks Completed per Active User,” where the denominator is all active users:
- January: The user base is almost entirely new. They’re still learning the software so that they may complete fewer tasks on average.
- June: A mix of new and returning users. Returning users are more familiar and more engaged, completing tasks at a higher rate.
- November: Mostly returning (and some advanced) users rely on TaskFlow daily. They likely complete many more tasks.
At first glance, you might conclude that engagement skyrocketed from January to November because users are completing more tasks per active user.
However, the real reason might be that the proportion of returning users has grown, and they tend to be more active by nature. It doesn’t necessarily mean TaskFlow has gotten better at retaining or engaging new users in the same period.
Other segments that can affect these metrics include:
- Subscription plans: Basic, Pro, and Enterprise customers often have different usage patterns or feature needs.
- Team sizes: Small teams might use fewer features or complete fewer tasks, whereas large teams might use TaskFlow more intensively.
- Industries: A marketing agency might work on short, task-heavy projects, while a consulting firm might have fewer, longer tasks.
When the balance of these segments shifts in your active user base, so will your denominator and engagement metrics. This can make month-to-month or quarter-to-quarter comparisons potentially misleading if you don’t account for how your users’ composition is changing.
Always break down your audience into meaningful user segments or cohorts to understand what’s really happening with your SaaS engagement.
How to track feature engagement the right way?
Getting feature engagement right is about avoiding missteps leading to wasted effort. Here’s a breakdown of principles and methods that turn raw data into actionable insights:
Use cohort-based analysis
Aggregate metrics are blunt instruments. They mix apples with oranges, hiding nuances. Cohort-based analysis groups users based on shared traits or actions, such as signup date or feature adoption timing, so that you can measure engagement trends over time.
Cohorts allow you to isolate patterns, like whether users who used the feature during feature announcement engage more or drop off.
If you launched a new reporting tool in January, compare retention and usage rates among users onboarded before and after its launch. You might find that users exposed to the feature from day one are more engaged overall.
Account for user lifecycle stage
Not all features serve every user equally. A newbie needs features that are different from those of a power user. Yet many tracking setups treat all users the same, muddying the insights.
You can segment metrics and compare how new users explore onboarding tools vs. power users leveraging advanced reporting.
Set benchmarks to define success at different stages. For instance, early users might complete an onboarding tutorial, while advanced users create custom dashboards.
Track these separately to prevent inflated metrics from distorting your conclusions.
Consider different narratives for different features
Engagement metrics vary by feature type. Daily-use tools like chat need constant interaction to succeed, while monthly-use tools like invoices don’t.
For a project management app, tracking the daily activity on task assignments doesn’t work the same as measuring the biweekly use of sprint retrospectives. Consider tracking metrics for each feature differently like this:
- Task Management: Daily active users (DAU) and completion rates.
- Retrospectives: Participation percentage and time-to-complete surveys.
Implement multi-dimensional analysis
Looking at single metrics, like frequency, only tell a part of the story. Dive deeper with multiple lenses:
- Frequency: How often is the feature used?
- Duration: How long do users spend on it?
- Depth: How fully do they explore its capabilities?
- Success Rate: How often do they achieve their goal?
Track leading metrics and indicators
Lagging metrics, like churn, tell you what happened too late to act, while leading metrics hint at future behavior.
- Time to First Use: How quickly do users try the feature after discovering it? A slow start suggests onboarding issues.
- Return Usage Patterns: Retention tables reveal whether users return after an initial session.
- Feature-Specific Feedback: To capture relevant feedback while it’s fresh, trigger surveys (e.g., NPS or CSAT) right after using a feature.
Effectively tracking feature engagement isn’t just about counting clicks. It’s about asking the right questions tailored to specific features and user segments.
7 Tips on how to increase feature engagement
Boosting feature engagement is not about adding more features; it’s about creating meaningful user interactions that solve their problems effortlessly.
Here are seven proven strategies to increase feature engagement:
1. Design for engagement from the start
From the onboarding phase, identify the features that matter most for your customers’ jobs-to-be-done (JTBD). Segment users based on their goals and guide them through custom onboarding flows that showcase the right features at the right time.
2. Provide relevant resources + use cases to increase feature engagement
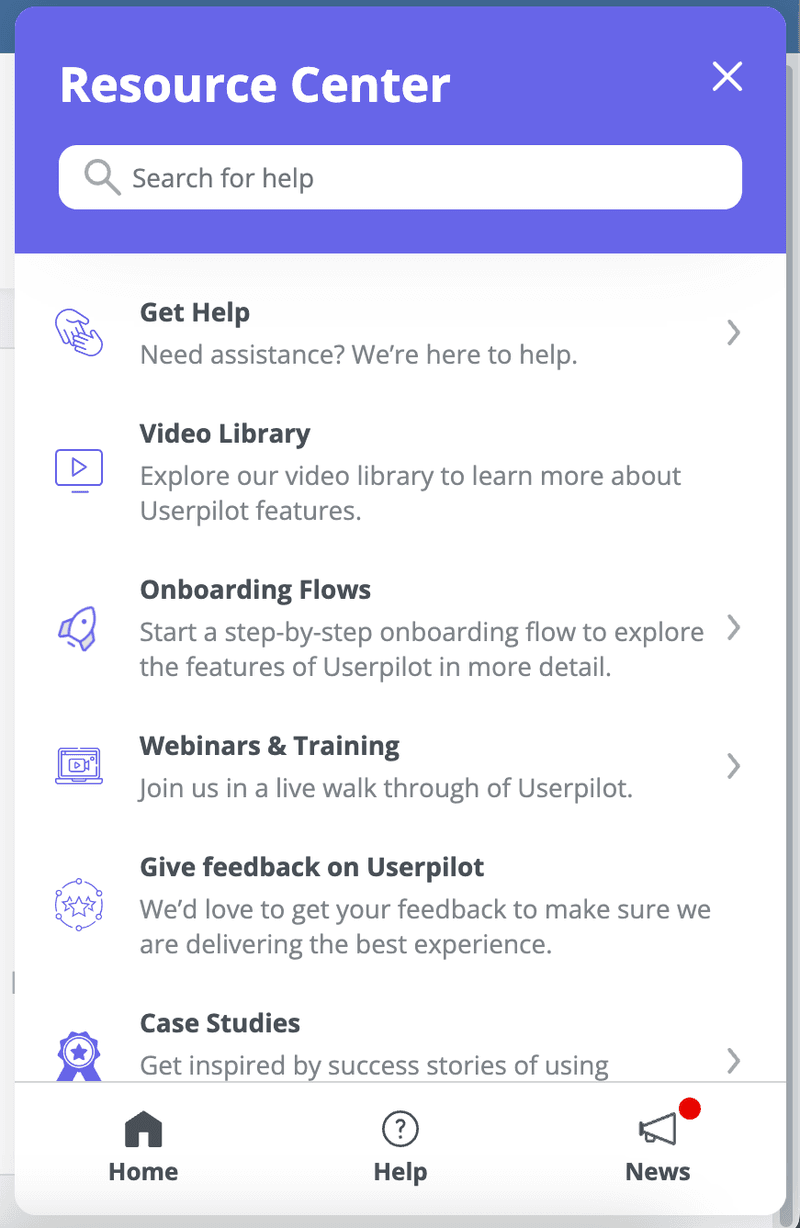
Users won’t engage with features they don’t understand. Provide real-world use cases and easily accessible resources in a help center or as embedded walkthroughs to help them adopt those features faster. Make a feature’s “how” and “why” crystal clear.
3. Provide situational micro-learnings with tooltips
Contextual tooltips deliver situational guidance when users interact with a feature. These micro-learnings reduce the cognitive load and help users adopt features with minimal friction.
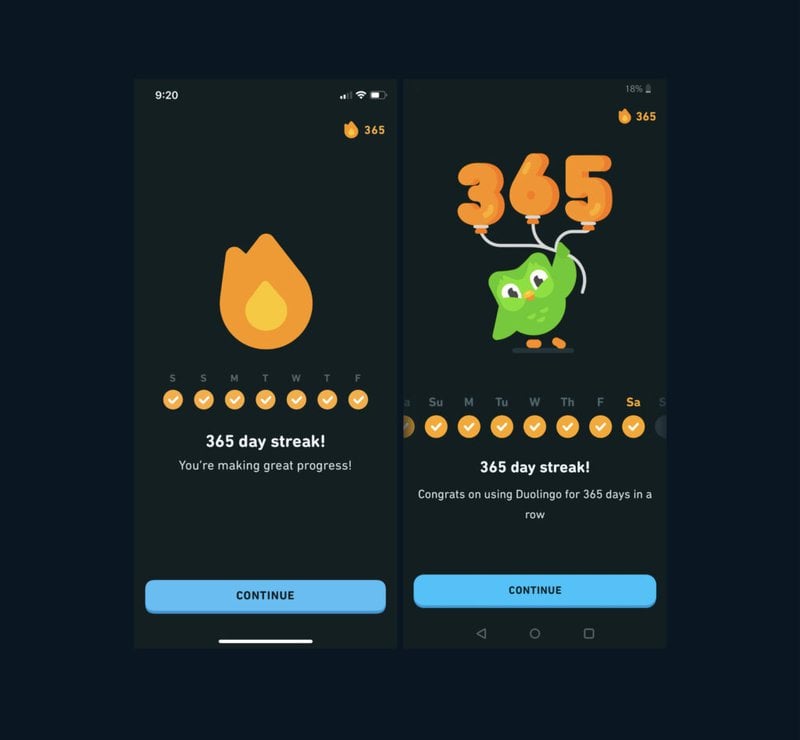
4. Create gamification elements such as feature mastery
Reward users for completing actions or exploring features to turn feature adoption into a game. Gamification taps into intrinsic motivation and keeps users engaged.
Duolingo’s streaks and mastery badges encourage learners to use the platform daily while subtly introducing new features, such as speaking exercises.
5. Implement growth loops to encourage usage
Use growth loops to drive organic engagement. For example, features encouraging users to invite others naturally expand adoption and engagement.
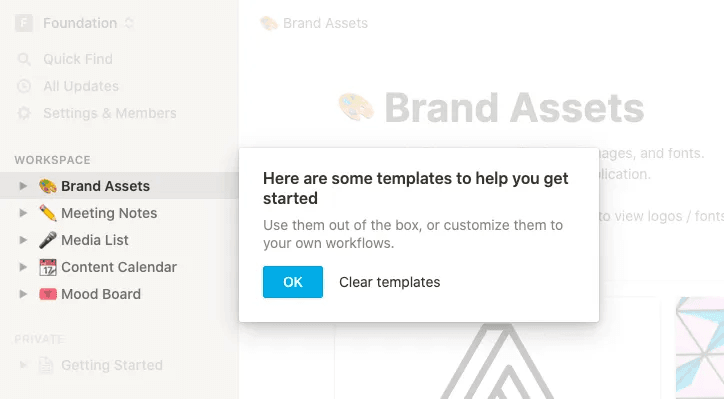
Notion’s team templates prompt users to collaborate by immediately making the feature’s value visible.
6. Remove friction points in feature usage
Session replays are your best friend when identifying areas where users struggle. Whether it’s an unintuitive interface or unclear next steps, eliminating friction reduces drop-off and improves feature engagement.
Userpilot’s session replay feature helps spot bottlenecks, like users hovering over unclickable elements, which can inform UI tweaks.
7. Design smart re-engagement prompts
Use in-app messaging to encourage users to try new features or highlight underutilized ones. Re-engage inactive users with prompts based on their inactivity or incomplete actions.
How to track and increase feature engagement with Userpilot
Let’s return to our previous example: TaskFlow. They recently launched a new AI-powered task automation feature. TaskFlow wants to ensure users discover, engage with, and effectively use this feature. Here’s how Userpilot can help them.
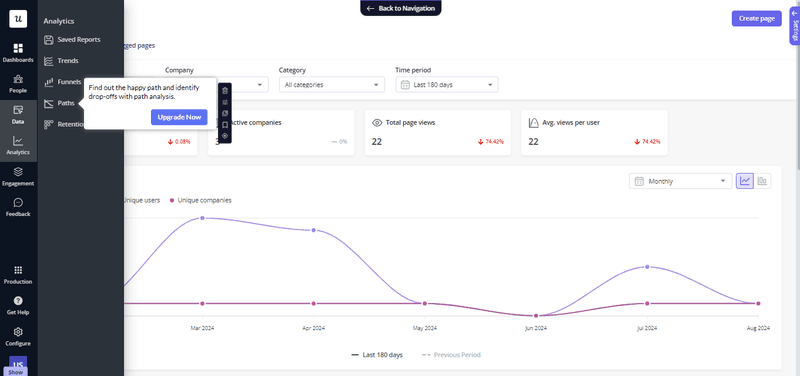
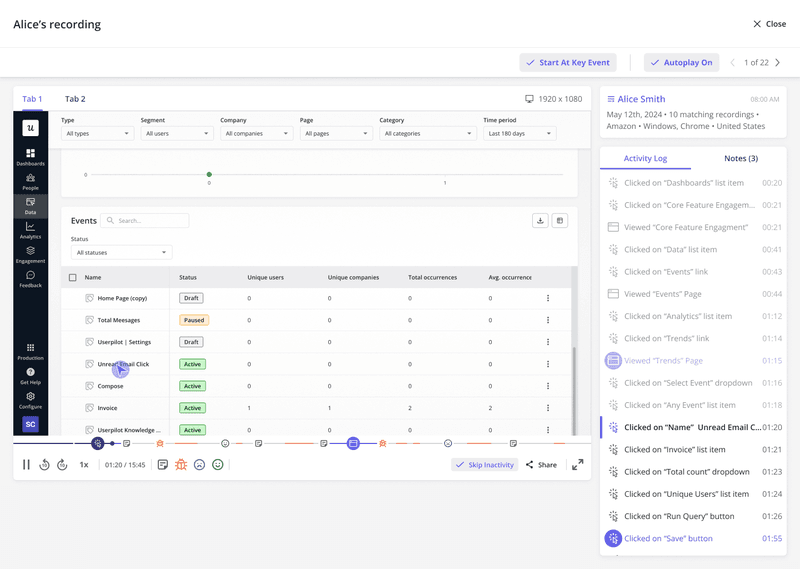
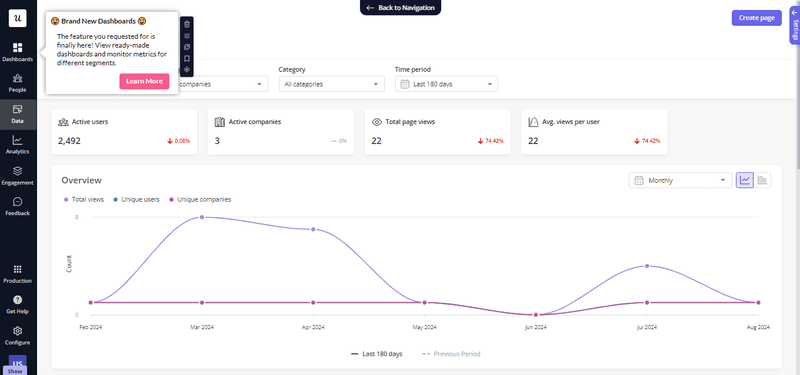
Userpilot provides analytics dashboards that show how users interact with features. For TaskFlow, this means:
- Seeing how many users enable AI task automation.
- Measuring how often it’s used per session.
- Identifying drop-off points: do users enable it but not complete the setup?
By visualizing trends, TaskFlow’s product team quickly spots if engagement is growing or adjustments are needed.
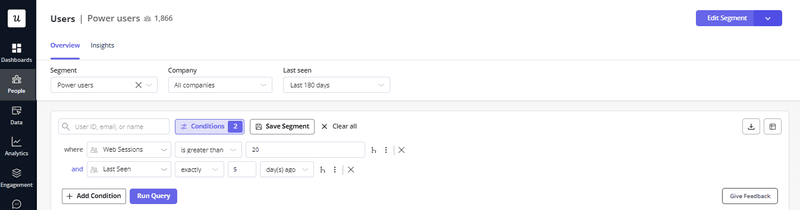
However, engagement varies among users, so lumping everyone together makes it harder to act on insights. Userpilot allows segmentation based on:
- User actions: Who has enabled AI automation but hasn’t used it?
- Lifecycle stage: Are new users adopting it faster than long-time users?
- Needs: Are power users engaging differently than casual users?

TaskFlow can target users who enabled the feature but never set up a workflow, nudging them with personalized in-app messages.
Userpilot also helps connect the dots between data sources:
- Quantitative: Engagement metrics (clicks, time spent, activation rates).
- Qualitative: User feedback through surveys.
- Visual Context: Session replays to watch how users interact with AI automation.
If TaskFlow sees that many users enable automation but don’t configure workflows, session replays might reveal confusion in the setup process. They can send a survey to confirm this and make UI improvements accordingly.
TaskFlow can also use Userpilot’s no-code tools to:
- Add modals introducing AI automation the first time a user logs in.
- Place tooltips next to key buttons, explaining their function.
- Set up a resource center with how-to videos and troubleshooting guides.
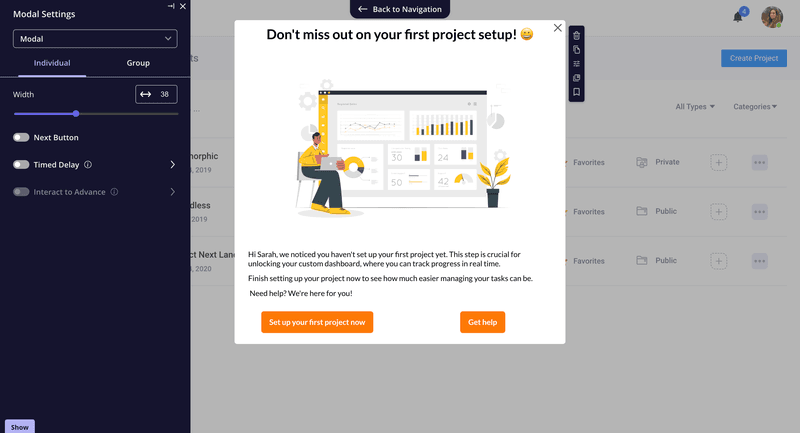
Since no coding is needed, TaskFlow’s product team can test different in-app prompts without waiting on developers.
Book a demo today to discover how Userpilot can help you improve feature engagement and customer experience like never before.
FAQ
What is feature engagement?
Feature engagement measures how active users interact with a product’s functionalities, reflecting genuine adoption and satisfaction. By evaluating feature usage based on frequency, depth, and relevance of use, product teams can optimize user experiences.
What are the 4 P’s of engagement?
Product, People, Processes, and Performance form the 4 P’s of engagement. Each element enhances user satisfaction, drives consistent usage, nurtures brand loyalty, and fosters meaningful, long-term product relationships.
How to measure engagement in a product?
Use KPIs like monthly active users, session duration, and feature usage frequency. Combine quantitative analytics with qualitative feedback to identify pain points, gauge value delivery, and refine product strategies.
What is the role of product engagement?
Product engagement is a critical indicator of user satisfaction, retention, and feature adoption. Higher user engagement signifies deeper connections with features, fueling improvements, brand loyalty, and increased revenue opportunities for product-driven businesses.
About the author
![What are Release Notes? Definition, Best Practices & Examples [+ Release Note Template] cover](https://blog-static.userpilot.com/blog/wp-content/uploads/2026/02/what-are-release-notes-definition-best-practices-examples-release-note-template_1b727da8d60969c39acdb09f617eb616_2000-1024x670.png)