
Performance reporting is essential for product and project managers to make data-driven decisions.
In this article, we explore:
- What performance reporting is.
- Why it is important.
- What to include in a performance report.
- How to create performance reports.
- The best analytics tools for performance reporting.
Let’s get right to it!
Try Userpilot Now
See Why 1,000+ Teams Choose Userpilot

Performance reporting summary
- Performance reporting is the process of collecting, analyzing, and presenting data on product or project performance.
- It allows teams to identify areas for improvement and make data-driven decisions.
- By pinpointing inefficiencies and delays, performance reports can help you bring the project back on track.
- Performance reports are also a chance to demonstrate your effectiveness and the value that you’re delivering and promote continuous improvement habits across the organization.
- Project status reports offer a snapshot of such project aspects as budget, timeline, and completed tasks.
- Progress reports focus on what has been achieved since the last review and include recommendations for future steps.
- Earned value and variance reports compare the actual project performance against its forecast performance.
- Trends reports focus on the performance of chosen metrics over time.
- Forecasting reports aim to predict how the project will perform in the future and how to proactively address obstacles that may appear.
- Your performance report should include an executive summary and information on KPIs, milestones, cost and schedule performance, resource utilization, and future outlook.
- Start creating the report by identifying your target audience and their needs and expectations.
- Next, identify the relevant metrics to report on and collect data via appropriate methods.
- When you have the data, compile your report in the format most suitable for your audience.
- Choose the most appropriate way to share your report, for example, via email or deliver it in person.
- Regularly reflect on your reports and act on the feedback from stakeholders to make them more thorough and informative.
- PM and analytics tools enable managers to automate data collection and reporting, especially in the SaaS space.
What is performance reporting?
Performance reporting is the process of gathering, analyzing, and presenting information on product or project performance. The information could include KPIs such as retention or revenue as well as customer feedback and product usage data.
The aim of performance reporting is to assess how well the product is performing against initial predictions and goals and identify areas for improvement.
It helps product teams make better-informed decisions regarding product development, marketing, and other strategic initiatives.
Why is performance reporting important?
Performance reporting is essential for successful project delivery or product development.
Let’s look at some of the key benefits.
Enable data-driven decision-making to improve business performance
Performance reporting helps teams identify areas of improvement and opportunities for growth.
For example, you may use performance reporting to identify the features that deliver the most value to specific user segments as well as those that are underutilized.
You can use the insights to highlight the relevant features to the right users in your marketing resources while optimizing your onboarding to improve the discovery of the least popular features.
Identify areas of inefficiencies and delays
Performance reporting can also help organizations pinpoint the areas where their processes are inefficient and cause delays.
For instance, if a feature is taking longer to develop or a project is running over the budget, performance reporting can help you identify the causes, like inaccurate estimates or inadequate resources.
By addressing such challenges, you can get the initiatives back on track and avoid such issues in the future.
Foster a culture of continuous improvement
Regular performance reporting can also promote a culture of continuous improvement.
When asked to reflect on product performance on a regular basis, team members develop the habit of constantly analyzing their processes, tracking key metrics, and looking for ways to improve them.
However, for this to happen, you need to create a supportive environment without blame games or scapegoating. Otherwise, the performance reports won’t be accurate and people will dread their reviews.
Demonstrate value to management and key stakeholders
Performance reporting is often required by senior leadership and key stakeholders who want to ensure that their money is well-spent.
As such, they’re a great opportunity for product managers to demonstrate your progress and the value that you’re bringing to the organization. This is essential to establish your authority and secure the leadership buy-in for new product initiatives.
Different types of performance reports for project managers
What your performance report looks like depends on its purpose and your role. Let’s look at a few common types of reports that project and product managers may need to deliver.
Project status report
Project status reports provide an overview of where a project stands at a specific point in time.
They give stakeholders a snapshot of key elements like budget, timelines, completed tasks, and upcoming milestones.
Status reports can be used to highlight any issues or risks that may impact the project, making them vital for decision-making and risk management.
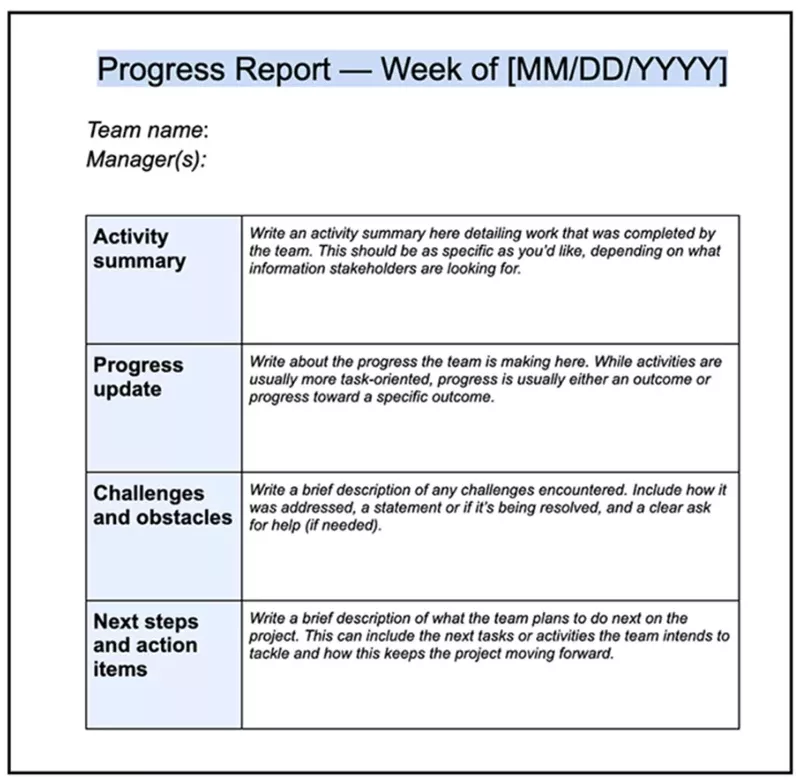
Progress report
While status reports emphasize the current state of the project, progress reports focus on what has been achieved during a defined reporting period.
These reports detail the tasks completed, the resources used, and the progress made toward the project’s objectives. They may also provide information about what needs to be done and necessary adjustments to the project plan.
They are usually more detailed and dynamic than status reports and offer an ongoing account of the project’s evolution.
Earned value report
An earned value report is a kind of progress/status report that uses quantitative data to measure the actual project performance against its planned performance.
In short, you start by estimating how much work should be completed at different stages of the project and express it in monetary terms.
For example, if your project is meant to cost $1,000,000 and last 100 days, on day 21 you should have completed $210,000 worth of work.
However, if you’ve only achieved $150,000 worth of total, it means you’re 6 days behind the schedule. And if you’ve achieved $210,000 but it actually costs $260,000, you’re 50k over the budget.
By extrapolating the differences in actual and predicted work data, you can predict how much it will actually cost and how long it will take.
Earned value management techniques are fairly complex so give spreadsheets a miss and use a tool like MS Project instead.
Trend report
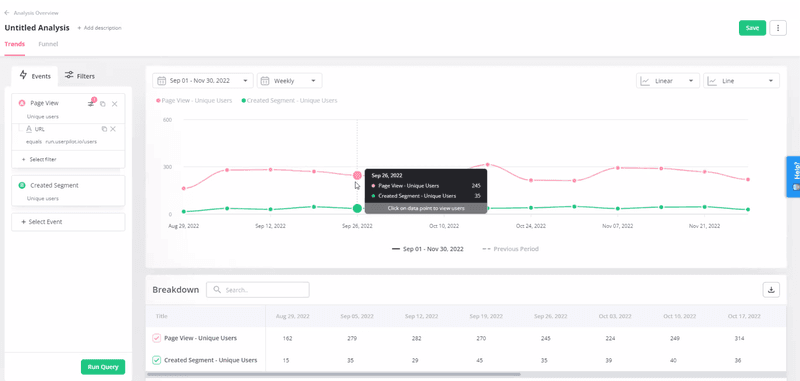
Trend reports provide information on the performance of chosen metrics over time.
By analyzing this data, you can identify patterns and trends, pinpoint the key change drivers, and forecast future performance based on historical trends.
For example, a product manager could track data on customer retention and the usage of a feature. By visualizing the data, you can see if the two are correlated. The lack of such a correlation could indicate that the feature has no direct impact on retention.
Forecasting report
The aim of forecasting reports is to predict future performance outcomes.
For example, a forecasting report can take into account past user behavior patterns linked to customer retention to predict future retention data.
With such insights, you can develop proactive strategies to address issues that could negatively affect product or project performance.
Forecasting reports can also help you allocate your resources adequately so that you’re able to deal with challenges that arise effectively and take advantage of new opportunities.
Variance report
Variance reports analyze the differences between actual and planned project performance, just like earned value reports.
By comparing the actual performance metrics to the planned ones, you’re able to identify important variances that require your attention.
For example, if you’re development team is running behind schedule, you may need to assign additional resources to help them complete the work on time.
Elements of effective project performance reports
The exact contents of the reports vary from project to project and organization to organization.
However, there are some common elements that you should include in all of them:
- Executive summary – a brief overview of the project’s current status, highlighting key achievements, challenges, and upcoming milestones for busy stakeholders who may not have the time to review the entire report.
- Project objectives and scope – clearly stating the project’s objectives and scope provides context for the reported performance metrics and helps stakeholders understand the project’s purpose and goals.
- Key Performance Indicators (KPIs) – metrics relevant to project goals and objectives, necessary for stakeholders to assess project health and identify areas that may require attention.
- Milestones achieved – highlighting completed milestones and their impact on the project timeline offers a sense of progress and achievement.
- Budget and cost performance – details the project’s financial status, including budget allocation, expenditures, and any variance from the budget, essential for stakeholders to assess the financial health of the project.
- Schedule performance – data on project timelines, deadlines, and any deviations from the original schedule help stakeholders understand if the project is on track.
- Risks and issues – current and potential risks and issues that may impact project delivery necessary to work out effective mitigation strategies and contingency plans.
- Resource utilization – details on how resources are being allocated and utilized, necessary to optimize resource management and identify areas for improvement.
- Future outlook – a forward-looking perspective on upcoming activities, potential challenges, and adjustments to the project plan that helps stakeholders prepare for future developments.
How to create performance reports?
Having covered the why’s and what’s of performance reporting, let’s look at the how.
Here’s a step-by-step guide to the performance reporting process.
1. Determine the target audience for the performance report
Start working on the performance report by identifying your target audience.
This is important for a number of reasons.
First, it allows you to define what particular readers are interested in.
For example, the project sponsors or investors may be interested in the financial performance of the project and whether it still has a strong business case, while the Head of Engineering at your organization may focus on technical and quality parameters.
Second, it allows you to choose the right language and presentation method that will best resonate with your audience. For instance, senior leadership may not be able to use highly technical jargon.
2. Identify goals and key performance indicators
Next, go over the project goals and key performance indicators relevant to the report and your target audience. This will give your performance report the right focus.
Identifying these shouldn’t be difficult – they are normally available in the project plan or charter.
It’s a good idea to review previous performance reports for any changes.
3. Collect data for performance assessment
Once you identify the necessary metrics, collect the data.
This could come from various sources.
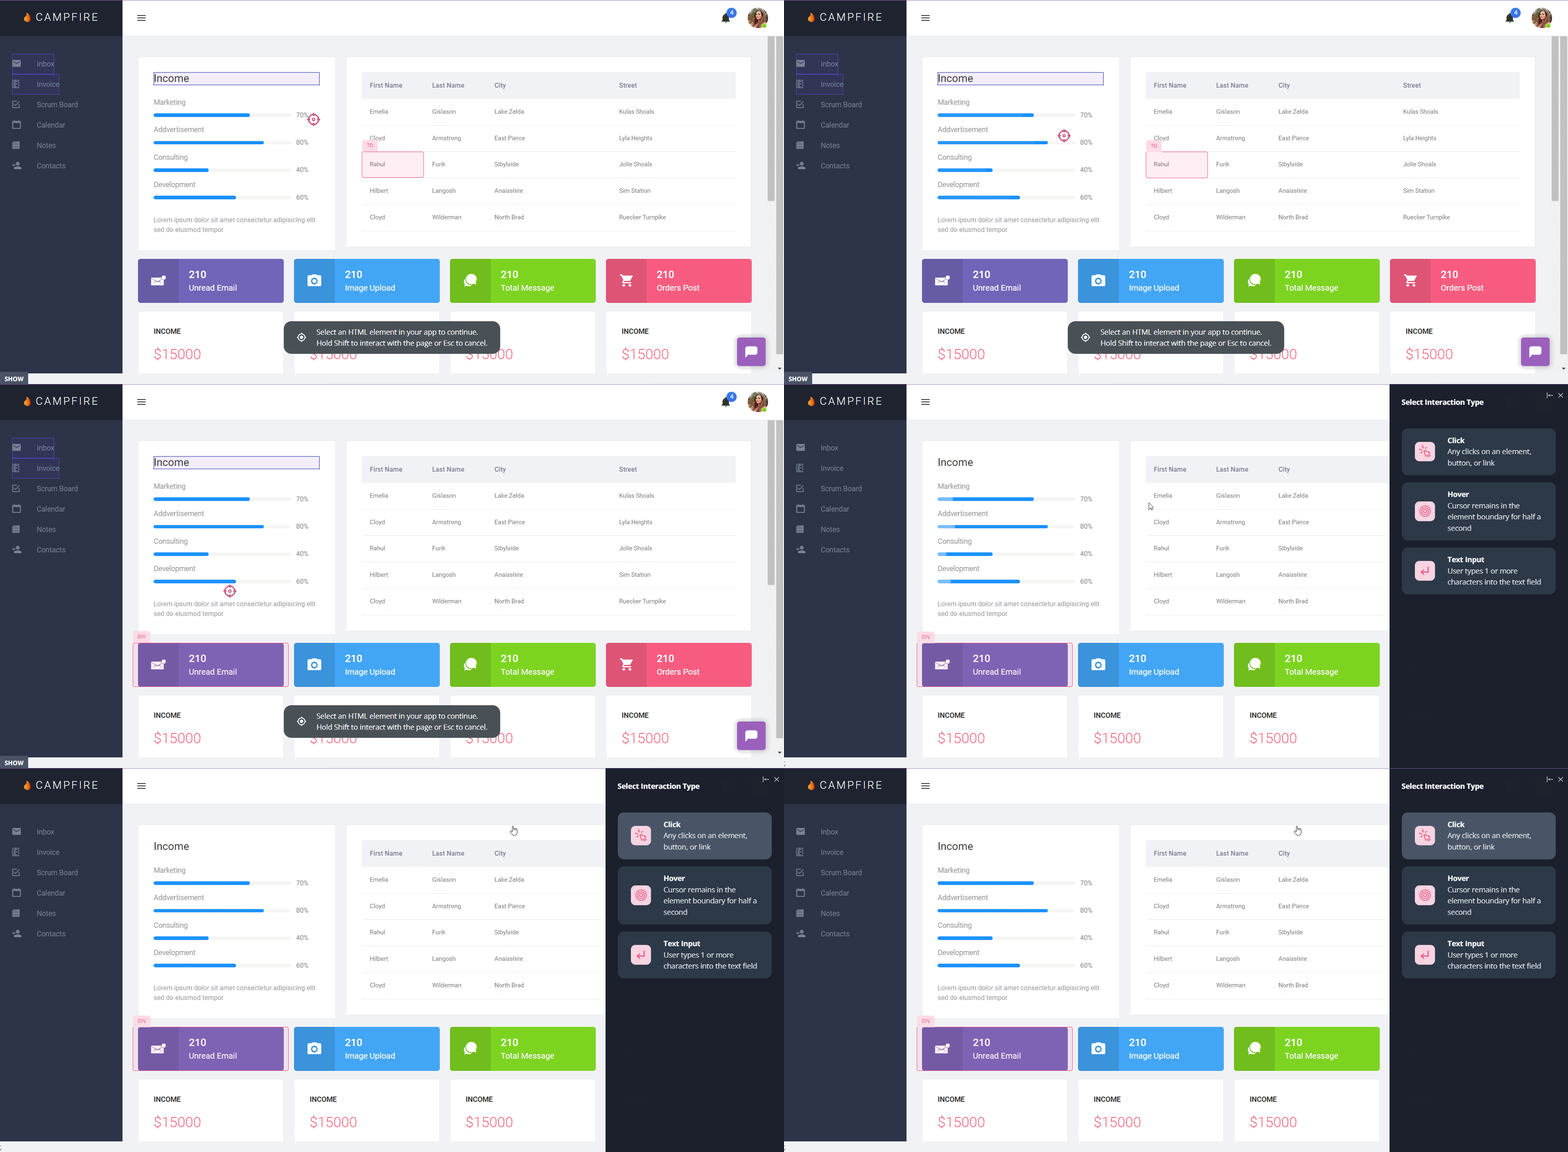
For example, when you’re reporting on the performance of a new product you’ve just launched, you could use customer feedback collected via in-app surveys and from customer-facing teams, and back it up with product usage data from an analytics tool.
If you’re building new software, the data could come from the development team updates, and for a construction project, you may choose earned value data.
4. Create the performance report to share the project’s progress
Having collected the data, generate the performance report.
This could be as simple as running a query or creating a custom dashboard in your analytics tool.
However, it’s not uncommon for product or project managers to collate various kinds of data from different sources.
In this case, you could leverage integrations between your tools or a customer data platform like Segment to consolidate the data. With such tools around, there’s really no need to faff around with spreadsheets anymore.
5. Share the performance report and discuss its findings
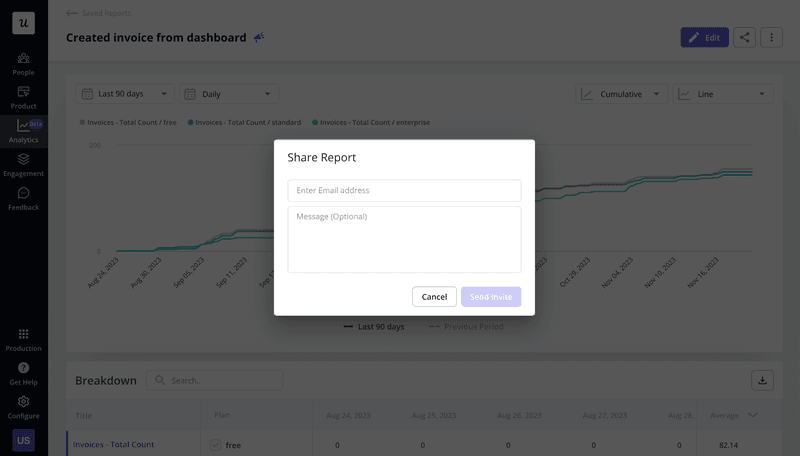
When the report is ready, you need to share it. How you do it depends on who the report is for and its purpose.
For internal reports, for example, to bring your team members up-to-date, sharing a link to the report link will be perfect enough.
For important stakeholders, you may need to write a more formal report, but if they are only mildly interested in the project, sending it by email will do just fine.
However, if they’re actively engaged in the project, like project sponsors, you may also need to back it up with a formal presentation.
6. Review and improve project performance reporting
Even if you’re a proper performance report ninja, there may still be things to improve.
This could be how you collect or analyze your data, or how you deliver the reports.
To make improvements, have a quick review after each performance report. Write down what went well and what was inadequate. Listen to the stakeholder feedback for ideas.
Some questions to ask at this stage are:
- Is the report actionable?
- Is the report accurate and reliable?
- Does the report reflect our project goals and objectives?
- Are the right performance indicators being used?
- Is the report visually engaging and easy to understand?
- Is it tailored to your target audience?
If you come up with any ideas for improvement, implement them and see if they make any difference.
What are the best practices for performance reporting?
If you want your performance reports to stand out, here are a few things you could do:
- Focus on key information – highlight the most critical information without overwhelming stakeholders with unnecessary details.
- Be transparent – provide honest and transparent information, even when the news is not positive. This builds trust and allows stakeholders to make informed decisions.
- Provide context – compare the data to benchmarks, targets, and historical performance.
- Suggest solutions and mitigation strategies – when reporting challenges or issues, also present potential solutions and mitigation strategies to demonstrate your proactive problem-solving skills and a commitment to overcoming obstacles.
- Use visualizations – incorporating visual aids such as charts, graphs, and dashboards will make complex information more understandable and memorable.
- Standardize reporting formats – create standardized reporting templates to ensure consistency across different reporting periods to make it easier for stakeholders to compare information over time.
- Use technology – leverage project management tools and analytics software to automate data collection and reporting. Such tools can streamline the reporting process and reduce the risk of errors.
The best tools for creating performance reports
Using the right tools can make creating performance reports considerably easier. More importantly, though, it can make them more valuable to stakeholders.
This is particularly true for SaaS product and project managers because all user interactions with the product happen in the digital space and there’s no other way to track them.
So what are your options?
Here are a few.
Userpilot for collecting and reporting user behavior data
Userpilot is a product growth platform.
It enables product teams to collect customer feedback via in-app surveys and track their in-app behavior with a range of state-of-the-art analytics features, including:
- Advanced user segmentation
- Code-free feature tagging
- (Custom) event tracking
- Funnel analysis (for tracking user progress along customer journey)
- Retention cohort analysis
- Trends analysis
- Path analytics (coming soon)
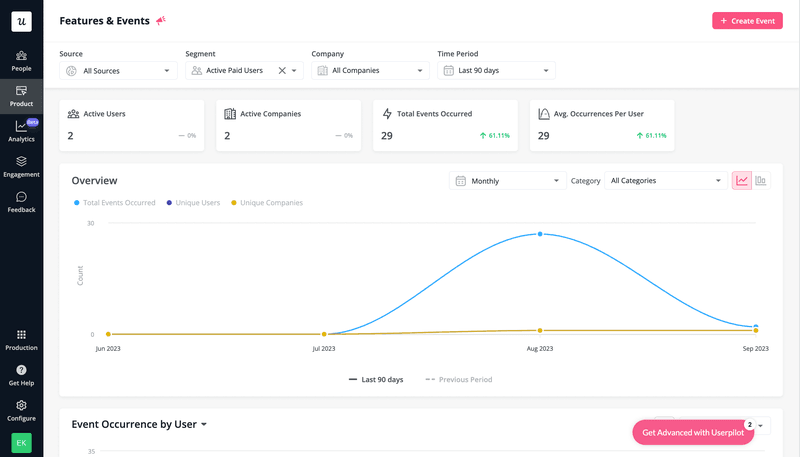
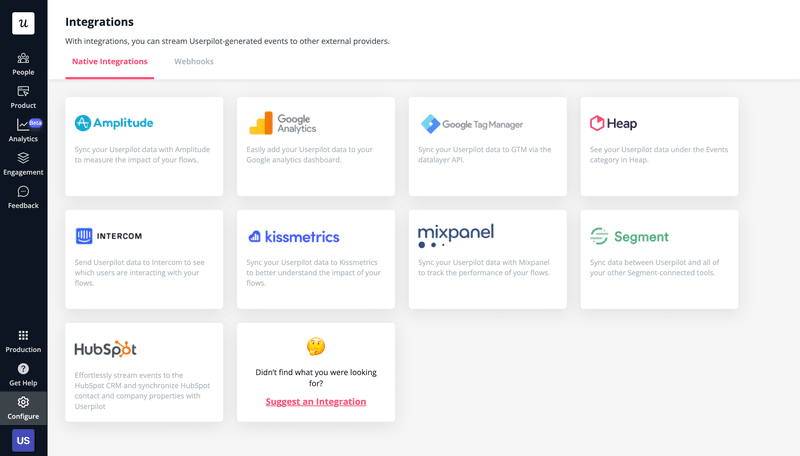
It also offers a number of integrations with leading analytics and CRM tools like Google Analytics, Amplitude, or HubSpot, so you can easily consolidate the report data from various sources.
Finally, it allows you to build in-app onboarding experiences so that you can improve on the KPIs you’ve identified in your performance reports.
For example, you could trigger tooltips and hotspots to help users discover new features and boost their adoption.
Hotjar for gathering qualitative data
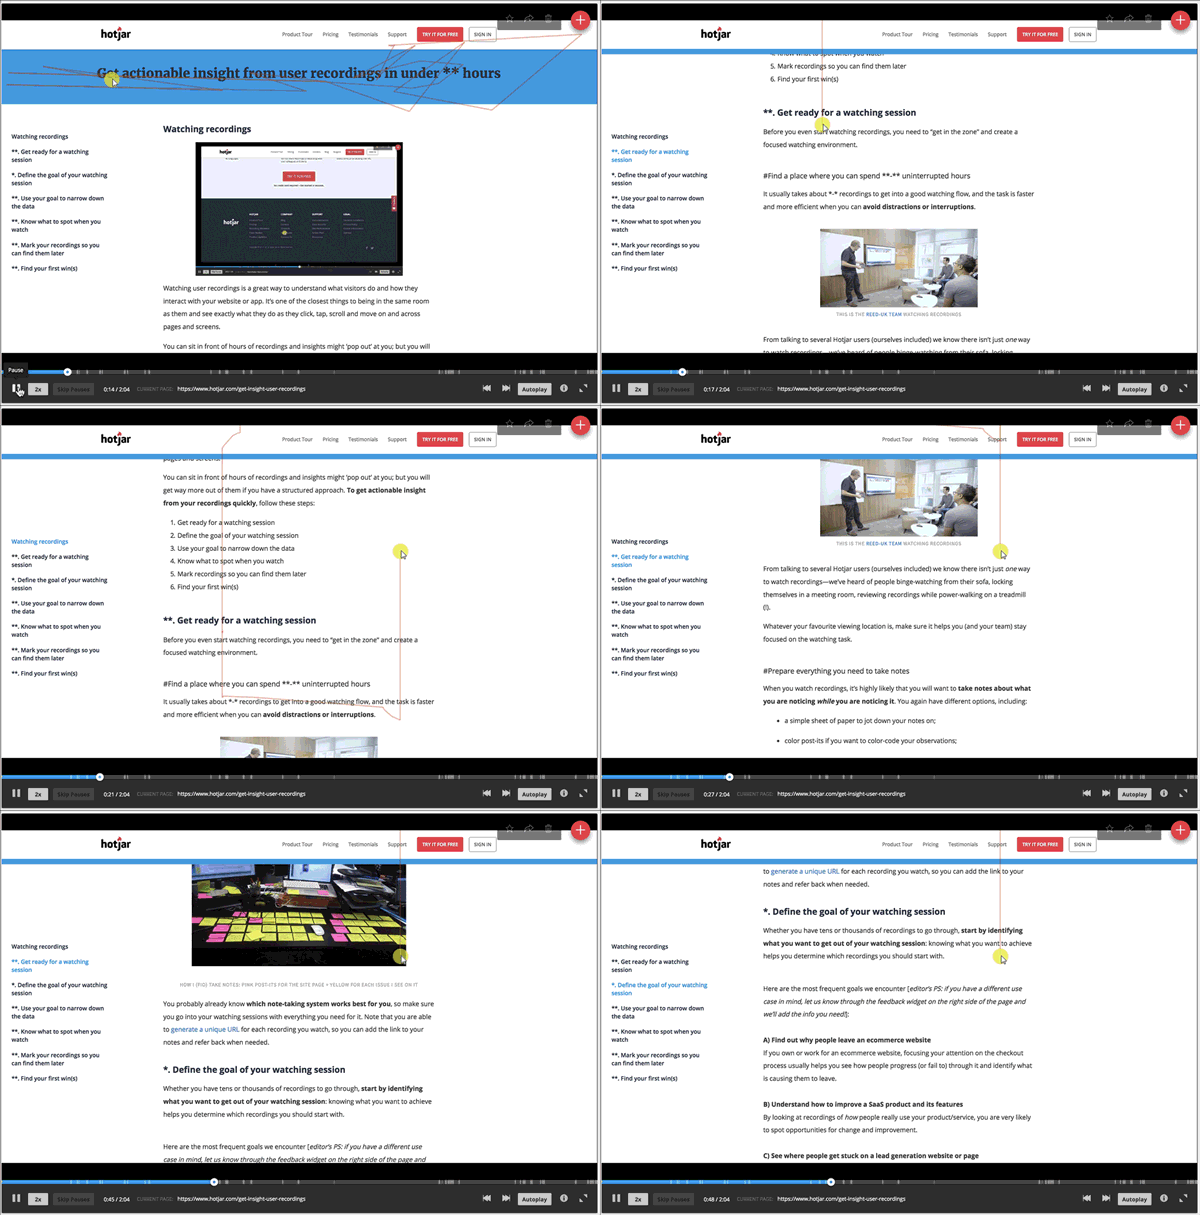
Hotjar is a UX experience analytics tool that allows you to collect granular qualitative data on user interactions with your product.
How granular?
With session recording, you can literally see every single cursor move, scroll, hover, click, and tap that the user makes. Back it up with heatmaps, and you get a comprehensive view of user engagement.
With Hotjar, you can also automate the process of scheduling interviews and usability testing sessions and run in-app surveys.
Databox for visualizing performance data
Databox is a business analytics platform.
It pulls all the data from various sources into one place so you can track performance and discover insights in real time.
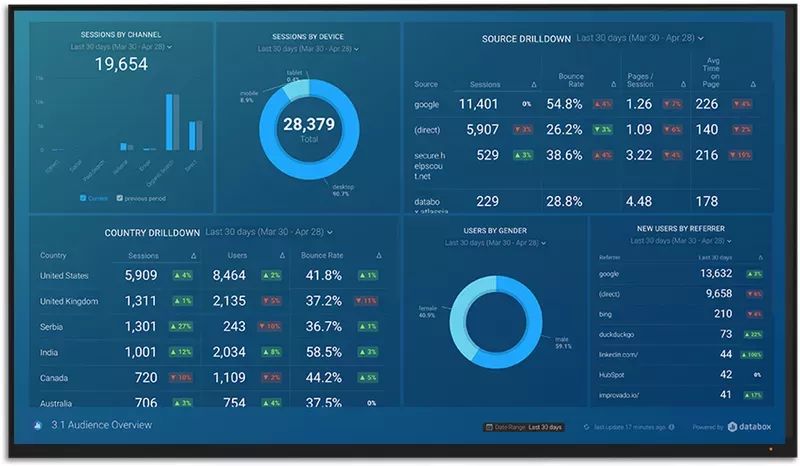
Databox allows businesses to connect their cloud services, spreadsheets, databases, and social media accounts to track their KPIs on a single customizable dashboard called Databoard.
It also offers pre-built dashboards, data snapshots, scorecards, alerts, and integrations.
This doesn’t require any coding and comes with a user-friendly interface.
For easy sharing, you can broadcast the dashboards to TVs around your offices and create performance report presentation decks you can send by email or deliver in person.
Conclusion
Effective performance reporting enables product and project teams to keep a pulse on the status of their projects and identify strategies necessary for their smooth delivery.
Book the Userpilot demo to see how it can help you streamline the performance reporting process and make data-driven product decisions!


