Funnel Analysis Examples and How AI Changes Everything in 2026


Building a solid product that meets user needs starts with understanding the customer journey, and funnel analysis is one of the most reliable strategies for tracking it. Every time a user signs up, triggers an onboarding flow, or reaches an upgrade screen, they’re leaving a measurable trail. Funnel analysis helps you figure out where they get stuck and why they leave.
In 2024, that trail was clear enough: users clicked, browsed, and hovered, and analytics tools captured all of it. But in 2026, a growing share of the activity moving through SaaS products isn’t human at all. AI agents access software via APIs and MCP tools, execute tasks without opening browser sessions, and generate none of the behavioral signals that traditional funnel reports are built around.
For most products right now, agentic traffic is still a small share of total interactions.
But that share is growing fast, and the products getting ahead of it are already running a two-pronged approach: standard funnel analysis for human users, and a separate tracking layer for agent interactions.
This post covers five funnel analysis examples that matter most for SaaS products, along with the process for running them and the tools that make it possible.

What funnel analysis is and why it still matters
Funnel analysis is the process of tracking how users move through a defined sequence of steps toward a conversion goal. The funnel shape comes from the reality that users drop off at each stage: 100 users might start a free trial, 60 complete onboarding, 25 reach an activation event, and only 10 upgrade to a paid plan. Each drop-off is a question the funnel report is asking you to answer.
For product managers, the value extends beyond catching drop-offs. Funnel data gives you a basis for data-driven product roadmaps: you’re prioritizing fixes based on where users are actually getting stuck, not based on intuition or the loudest voice in the room. It also lets you measure the impact of changes: if you redesign an onboarding flow, does the activation funnel improve in the weeks after launch?
Conversion funnels look different depending on your product and industry. A B2B SaaS funnel tracking trial-to-paid conversion looks nothing like a consumer app funnel tracking a checkout flow. Likewise, an e-learning platform’s onboarding flow has different stages and drop-off patterns than a project management tool.
5 Funnel analysis examples (and what they actually reveal)
You have to track multiple types of customer journeys, from marketing to reviews. Each of these needs a different funnel to track how users flow through them and identify friction points. Here are the most prominent ones.
1. Marketing funnel analysis example
Marketing funnels track how website visitors and potential customers discover your product and eventually sign up. Improving this funnel is the key to boosting new user acquisition while reducing your average customer acquisition cost, making it the first funnel most growth teams want instrumented.
The standard marketing funnel for SaaS has four stages worth tracking in your funnel analytics:
- Awareness: Potential customers recognize a problem your product could solve. They arrive from search, a referral link, or a social post.
- Interest: They start researching. They visit your website, read blog posts, and check review platforms to understand what you offer.
- Consideration: They compare you against alternatives, typically landing on pricing pages and comparison pages. This is where most of the friction concentrates.
- Sign-up: They take action, such as subscribing to a newsletter, booking a demo, or starting a free trial, indicating direct intent to engage.
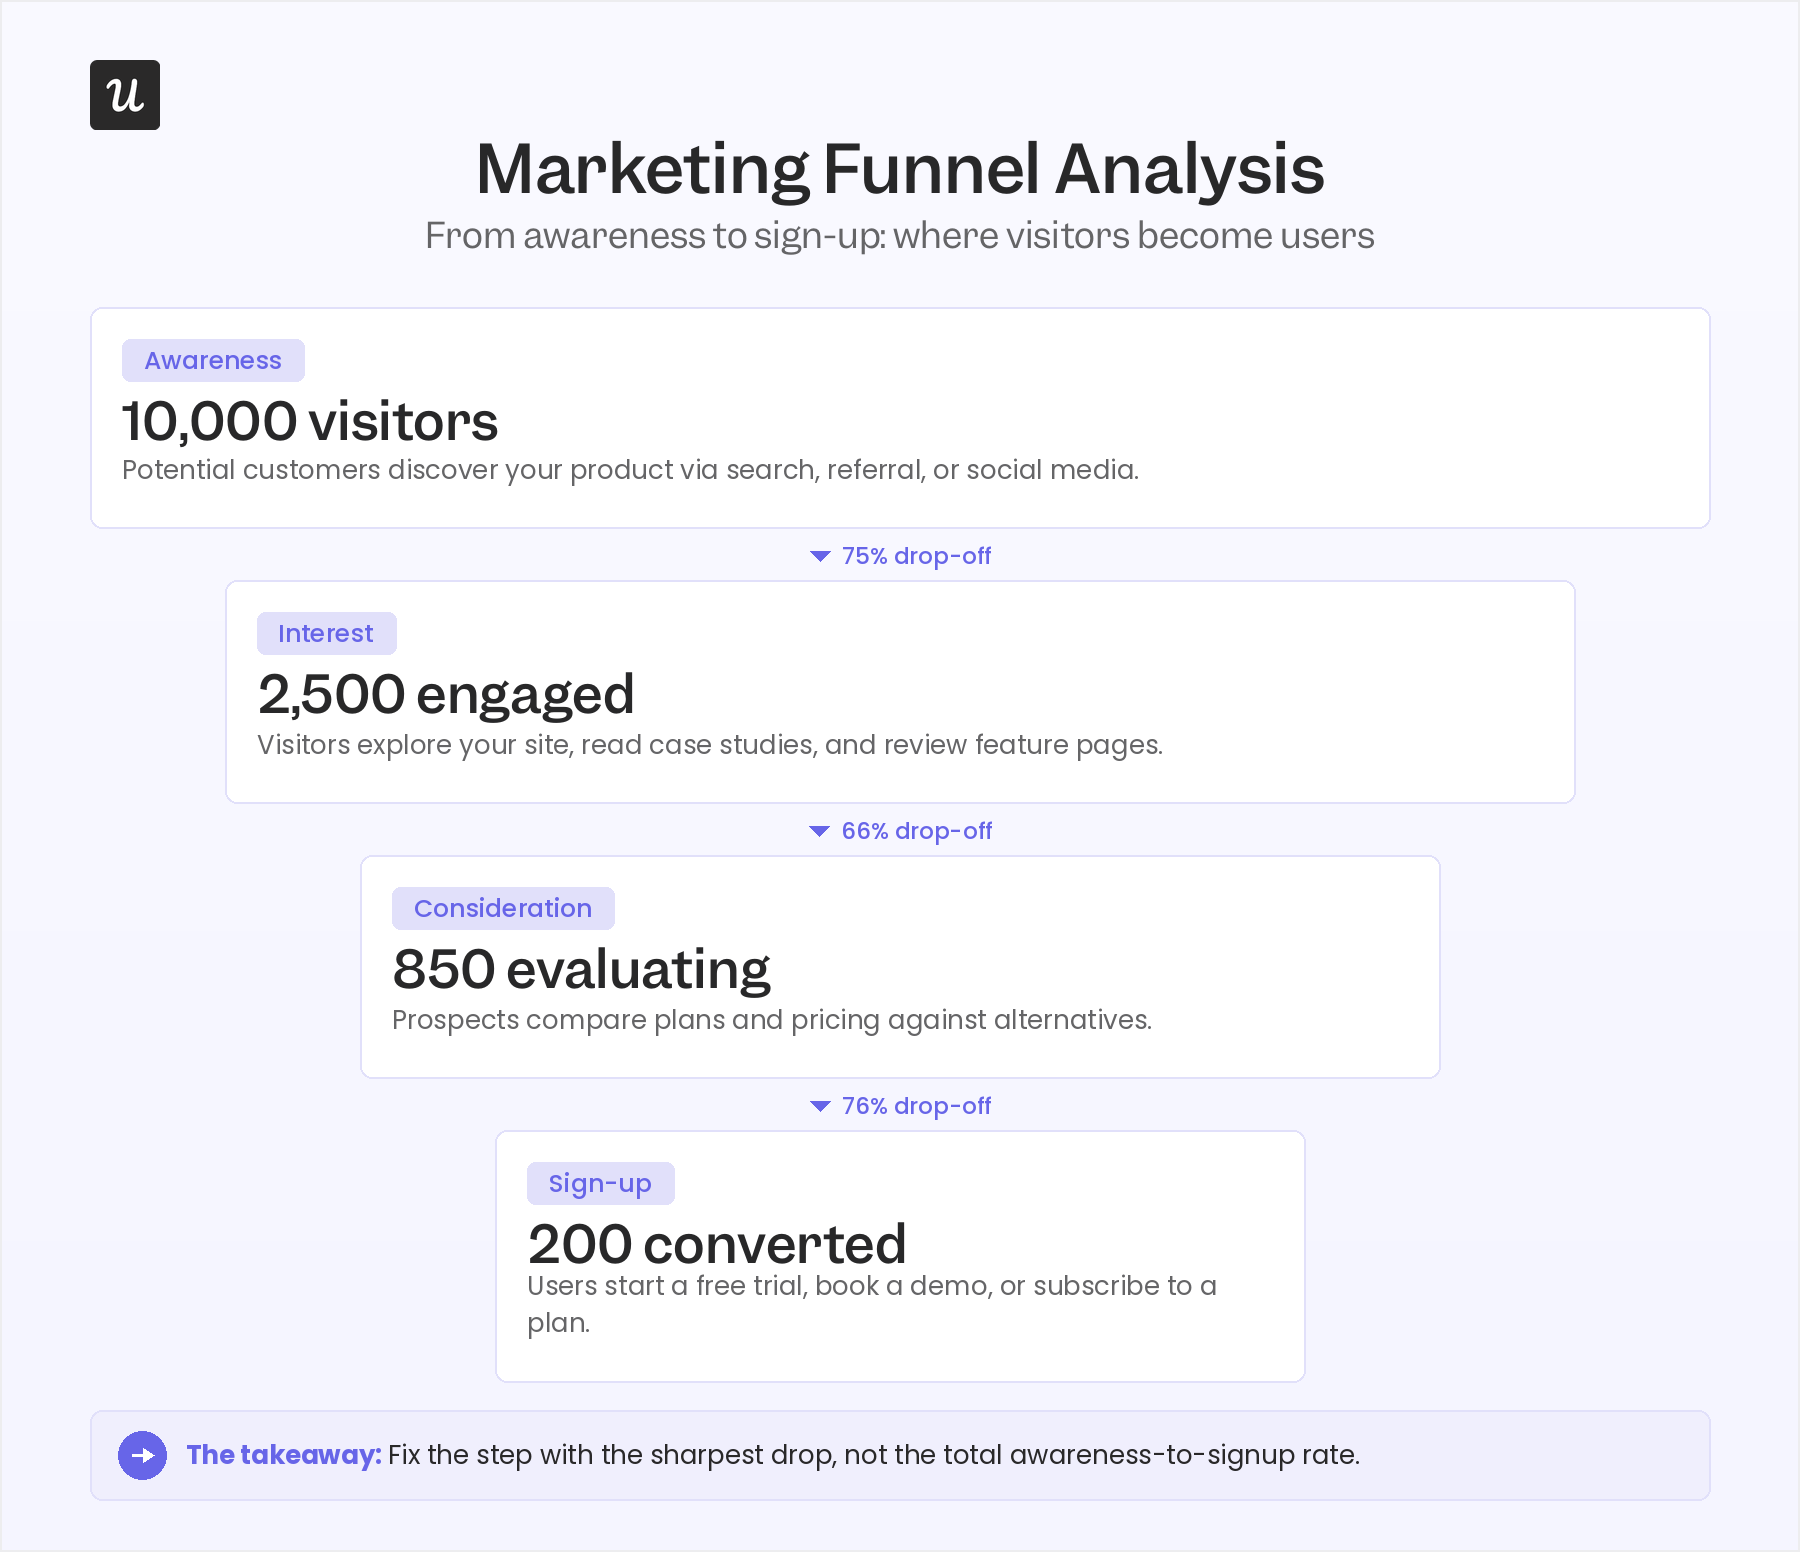
The most useful insight from a marketing funnel is finding which specific step loses the most users, and whether that varies by traffic source. Users arriving from a competitor comparison post might drop off at a different stage than those arriving from a G2 listing. Treating those segments separately can help you figure out what needs fixing.
2. Onboarding process funnel analysis example
Onboarding funnels track how new users move through each step of your customer onboarding process, showing where engagement is highest and where users start dropping before they reach value. Measuring time-to-convert within the funnel tells you whether your onboarding user flow is moving users toward value quickly or letting them stall at a specific step.
Here’s a sample onboarding funnel for a project management tool:
- User starts the onboarding flow: The user initiates the onboarding process through sign-up or first login, marking the start of their guided experience.
- Creates a project: The user follows the first instruction to create a new project where they’ll collaborate with their team.
- Adds a user: The onboarding flow explains how to invite a team member.
- Assigns the first task: The user creates a task and assigns it to someone, completing the core workflow.
- Finishes onboarding: The flow completes, typically with a confirmation screen or thank-you message.
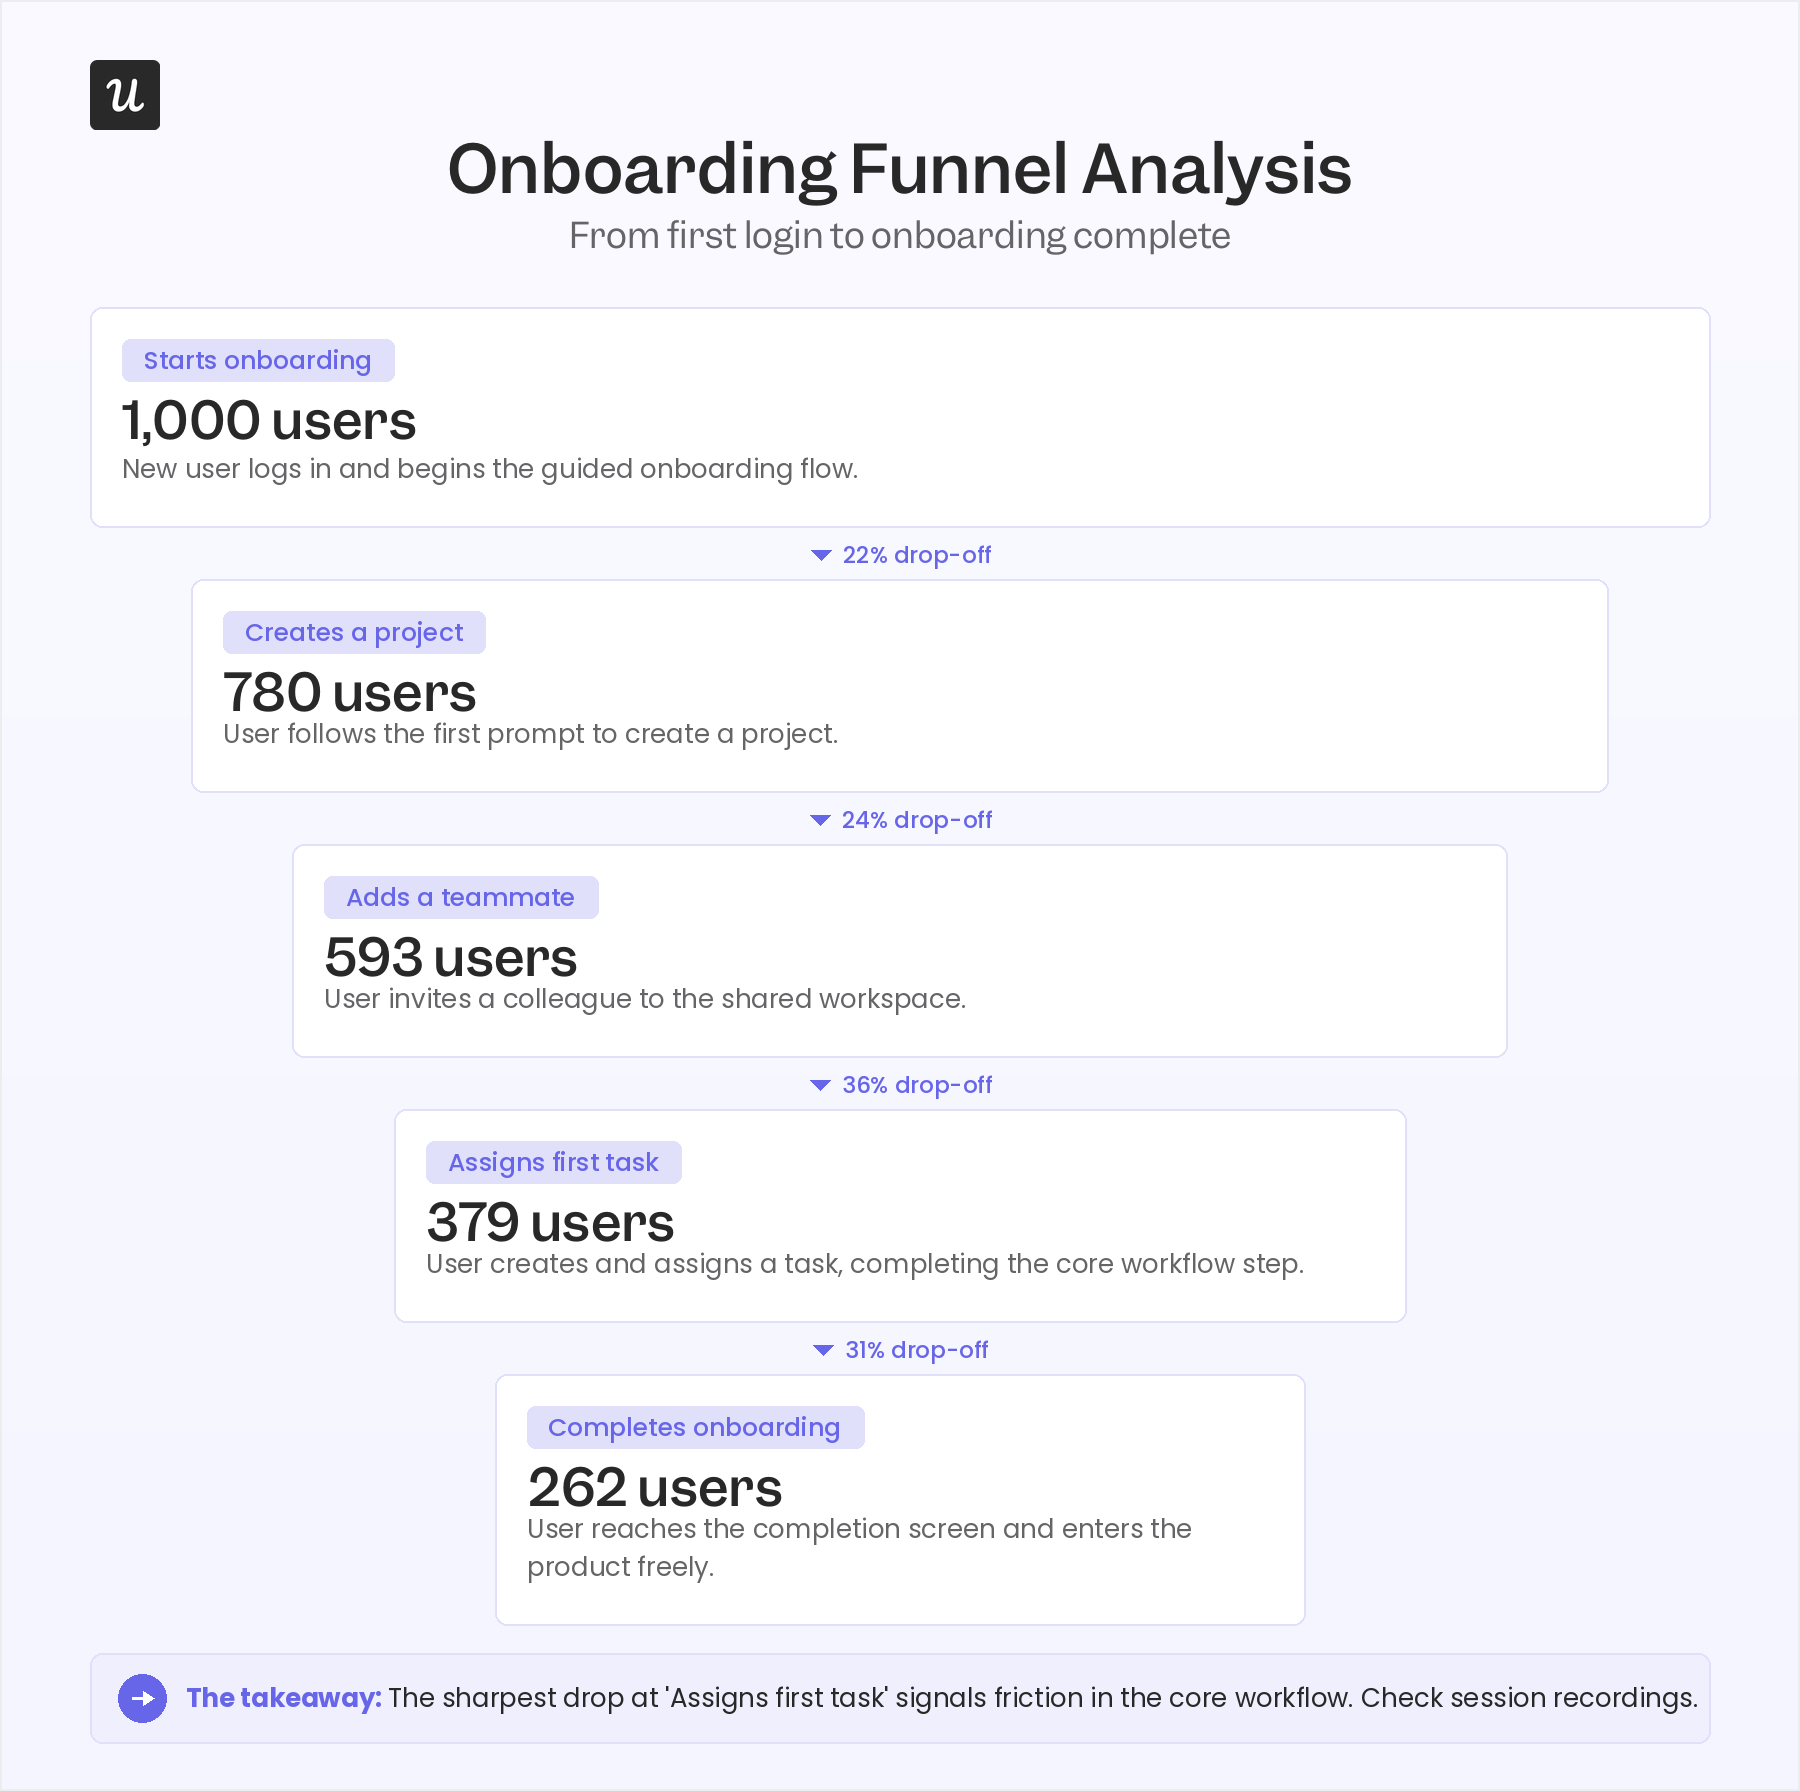
Proper guidance through the onboarding stages helps new users get started with your tool and boosts activations. And funnel analysis helps you find and fix friction points that could be hindering this product adoption.
Kommunicate, a customer support tool, struggled to get new users to adopt key features. They were able to bring about a 37.5% increase in feature adoption rate and + 3% in expansion MRR within seven months, all with a guided product walkthrough, as documented in the Kommunicate case study.
3. Activation funnel analysis example
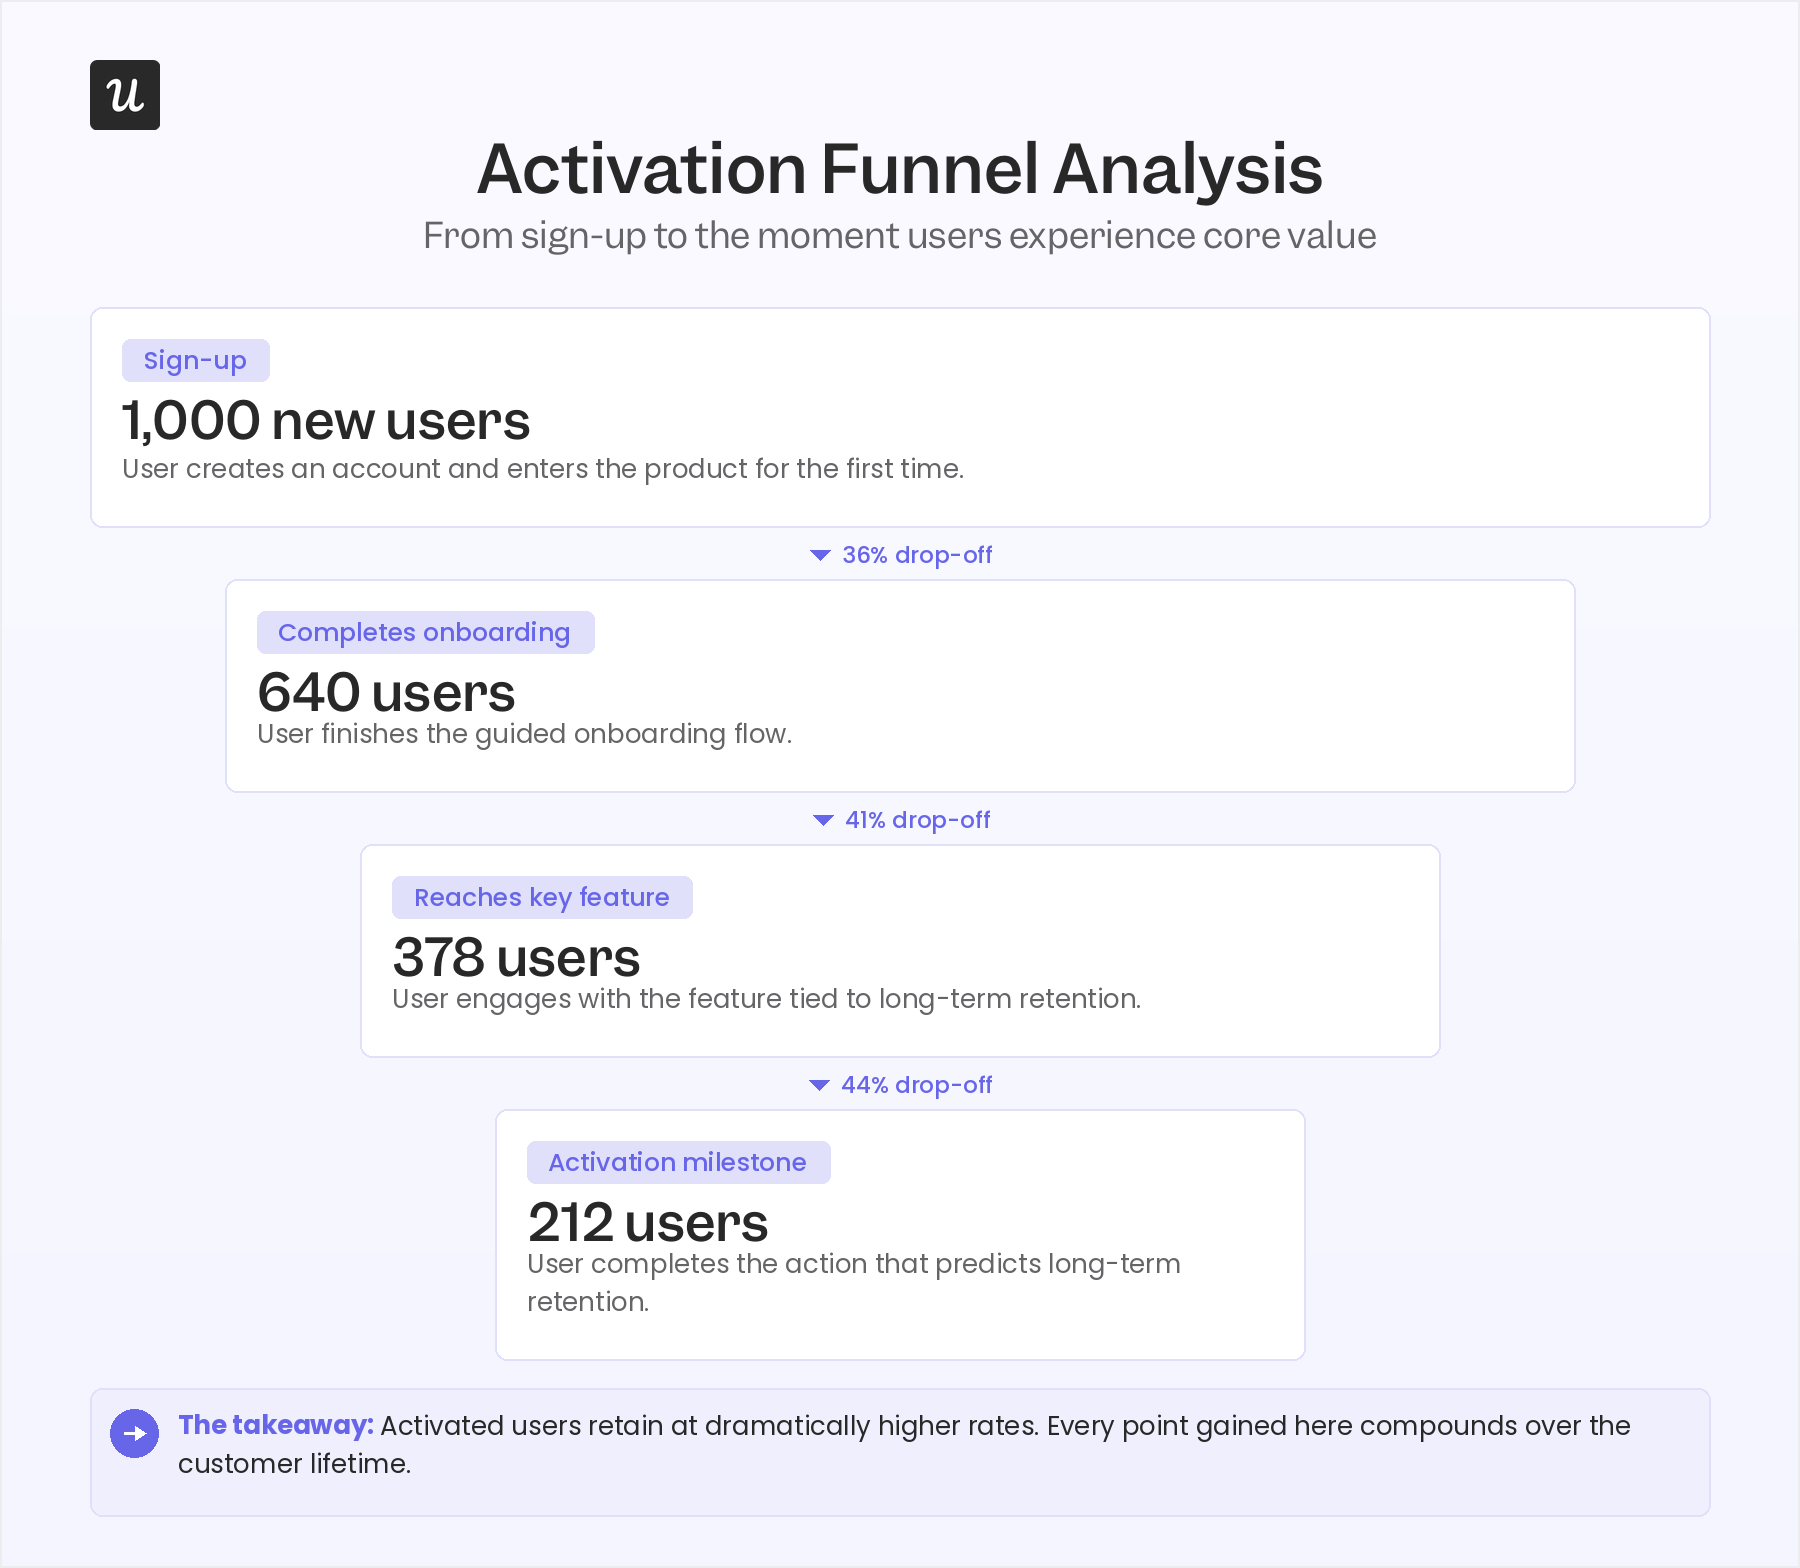
SaaS activation is the moment when a new user experiences enough value from your product to decide to keep using it. The activation funnel tracks users from sign-up through the onboarding experience until they hit that moment, and getting this funnel right is one of the highest-return investments a product team can make. Activated users retain at dramatically higher rates than users who sign up and never fully engage with the product.
Activation funnel stages vary by product, but the funnel always begins at sign-up and ends at whatever action your data shows predicts long-term user retention. For some products, that’s completing a specific workflow; for others, it’s reaching a certain usage threshold within the first week.
Beable Education, an e-learning platform for K-12 students, used Userpilot’s funnel reports to track content engagement across their student base. One of their activation funnels tracked a specific sequence: a student clicks on a spotlight, watches a video, sees a survey, and completes it. Breaking down that funnel by customer site helped Beable identify which school districts drove the most engagement. As the Beable case study details, it led to 2,274 out of 2,969 students completing the linked survey (76.59%), a strong result for a survey-tied activation funnel.
4. Free trial to paid conversion funnel analysis example
The free trial to paid conversion funnel tracks the steps trial users take to become paying customers. It’s the most porous funnel in SaaS: users drop off at every stage for different reasons, and a funnel report is the fastest way to find out where you’re losing maximum users before spending time optimizing the wrong thing.
The typical failure modes in this funnel are predictable:
- Users drop between acquisition and activation when they hit a value gap. (Learn more about activation vs adoption.)
- They drop during trial if onboarding doesn’t help them reach value fast enough.
- They drop at conversion if pricing or the upgrade flow creates friction.
Running conversion funnel analysis across these stages and segmenting by plan, company size, or acquisition channel, turns a single conversion rate number into specific, actionable optimization targets.
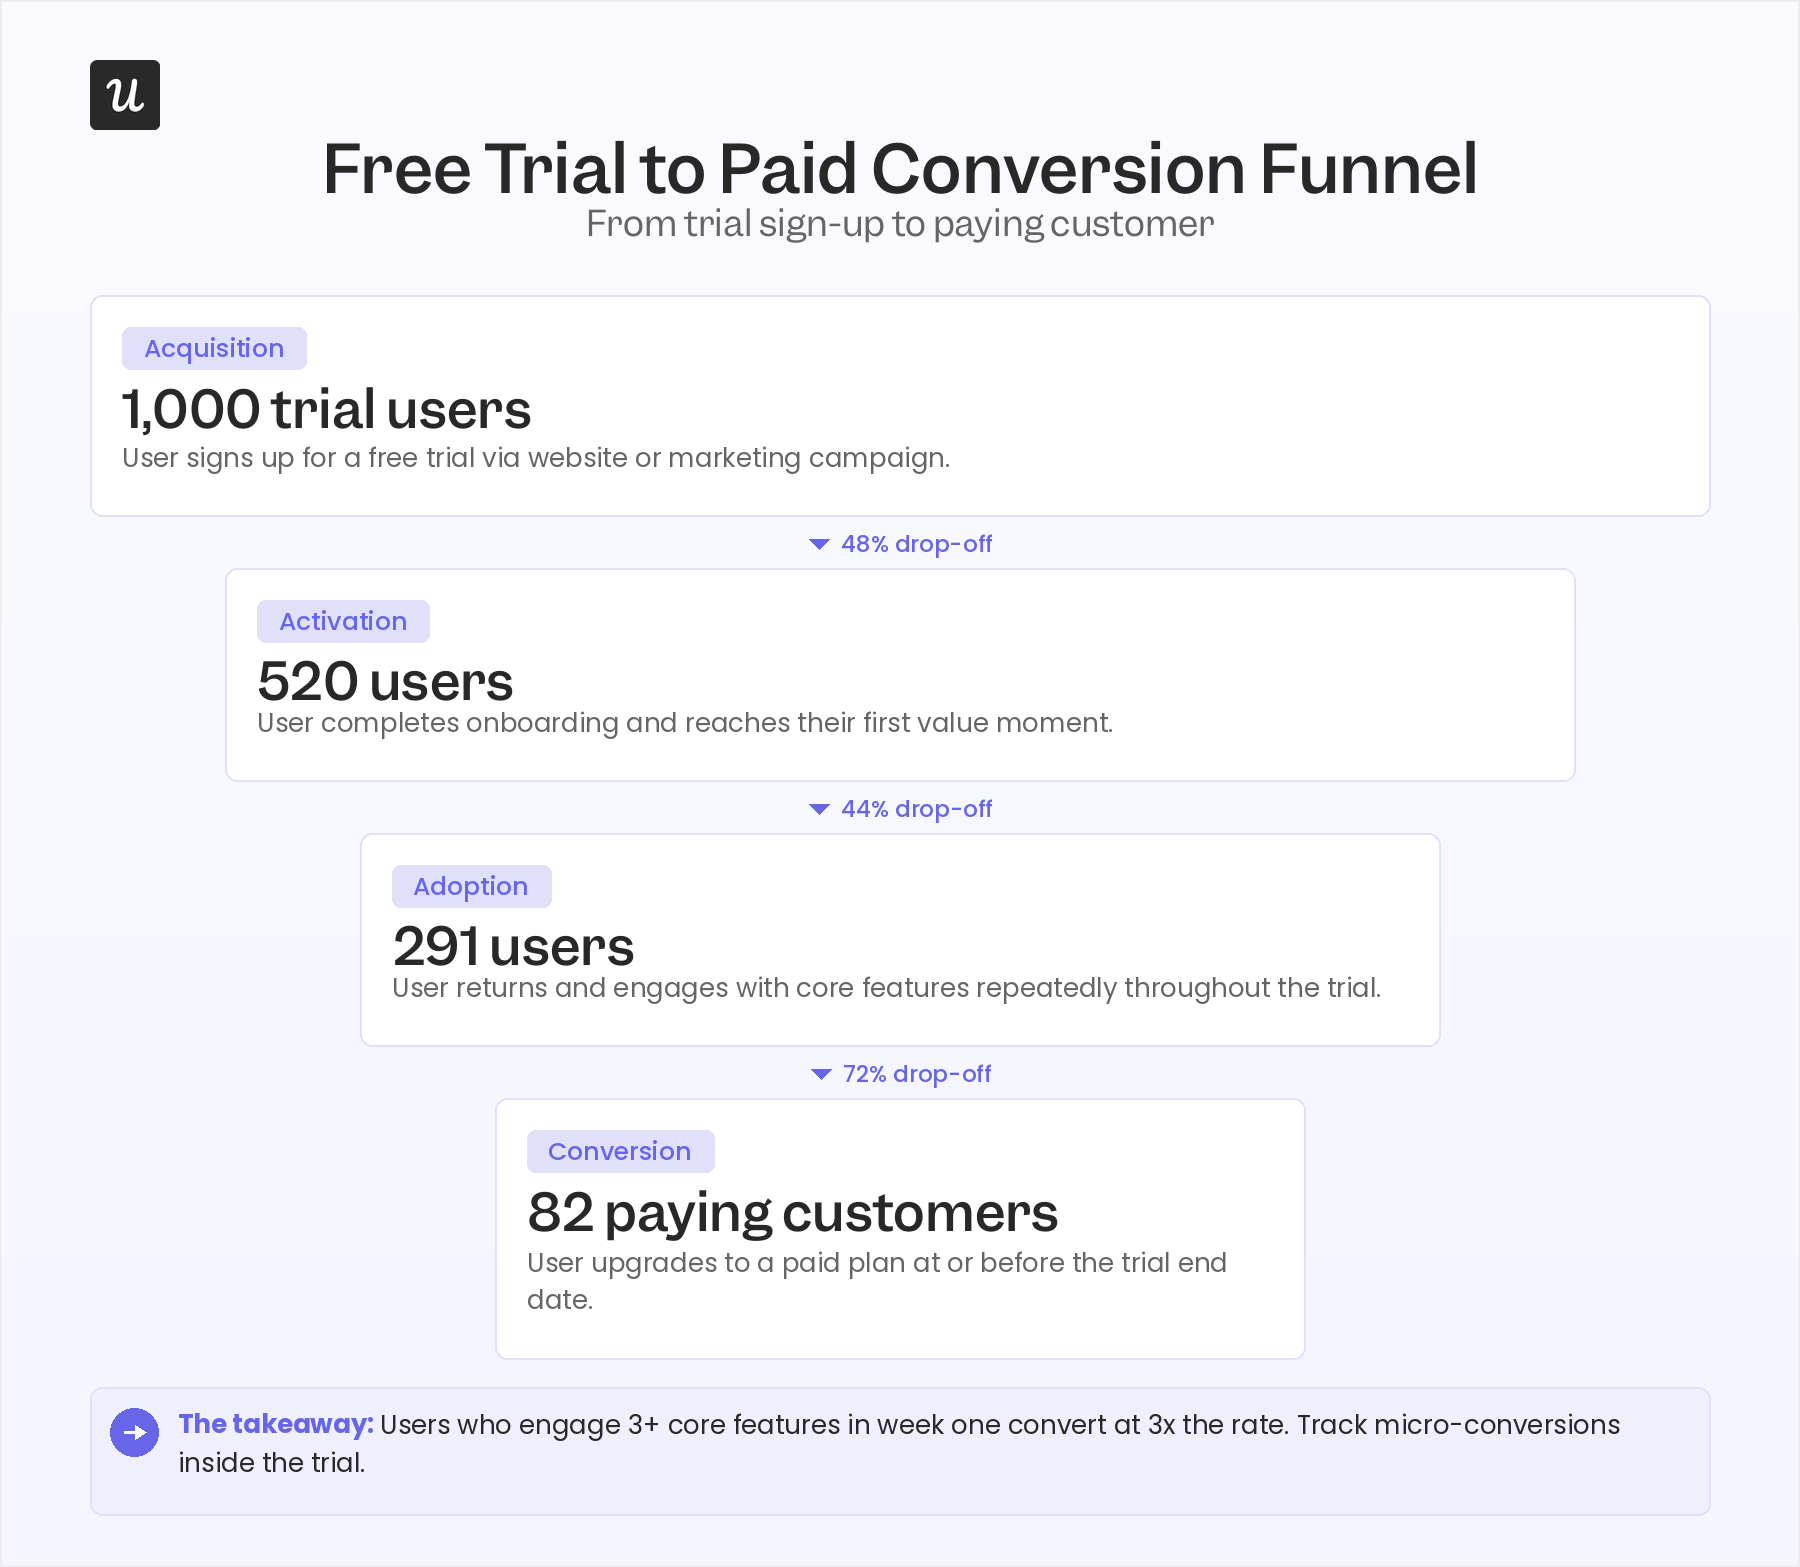
Micro-conversions during free trials are often better predictors of final conversion than the trial length itself. A user who engages with three core features in their first week is significantly more likely to convert than a user who logs in twice and stalls at setup. Tracking those micro-conversion events as individual funnel steps inside the trial period gives you an early warning system for accounts heading toward customer churn rather than upgrade, while there’s still time to intervene.
5. Review funnel analysis example
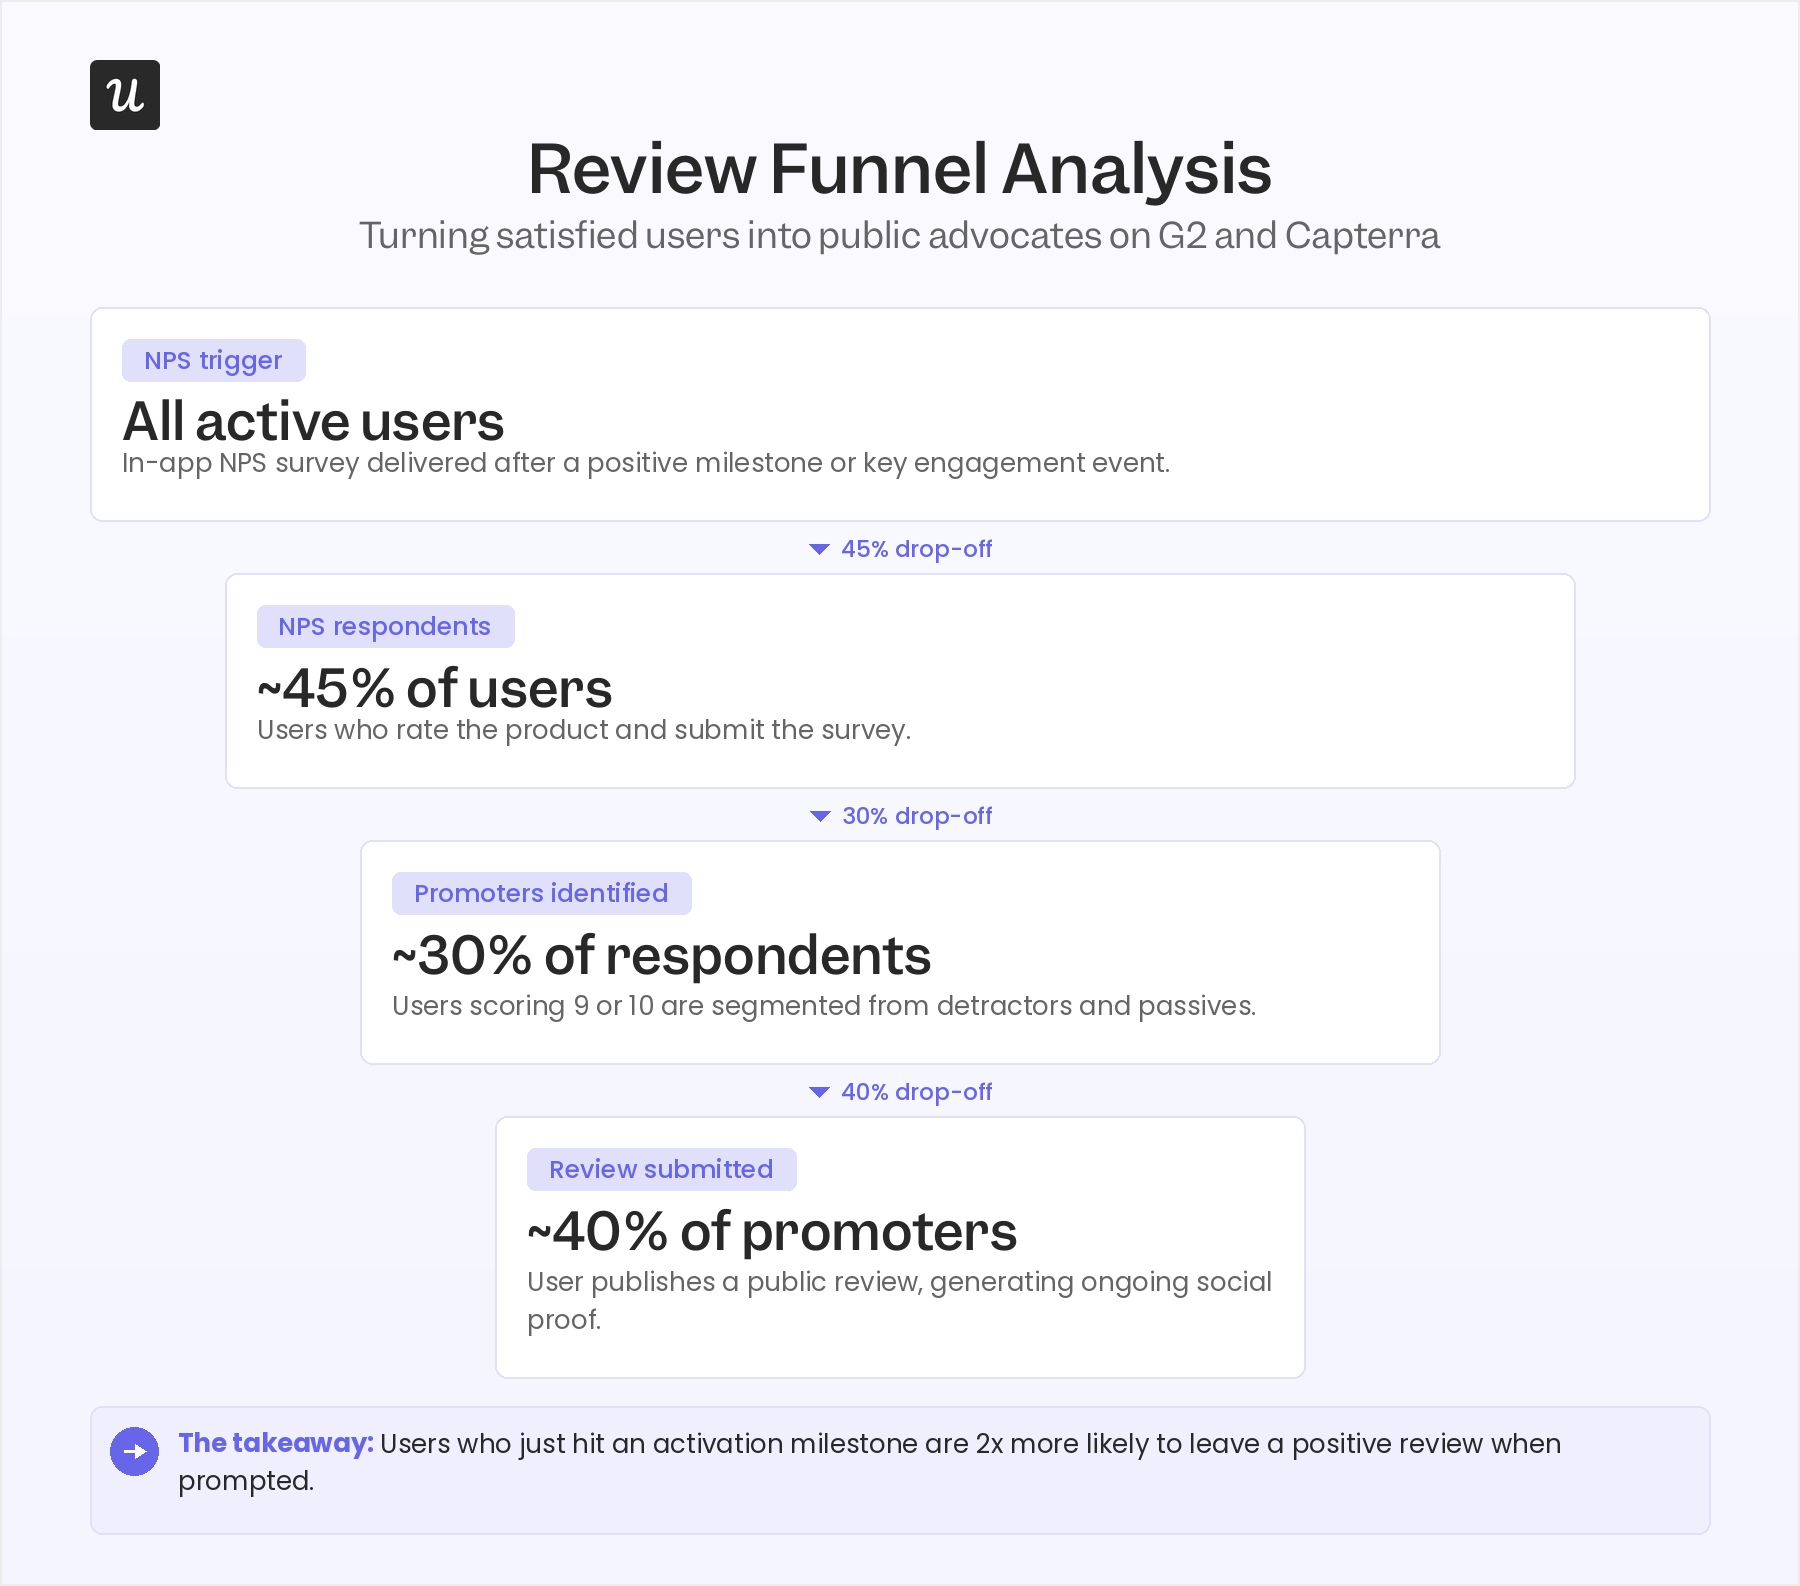
A review funnel is a process to guide your most satisfied customers through the steps of leaving a positive review on platforms like G2 or Capterra. It’s worth building and tracking because social proof has a measurable impact on your customer acquisition strategies, and most satisfied customers won’t leave a review without a well-timed prompt.
A review funnel for SaaS typically works in three steps:
- Trigger an in-app NPS survey, asking users how likely they are to recommend your product on a scale of 0 to 10.
- Segment the promoters (those who score you a 9 or 10). Detractors and passives drop off here, as they’re not the right audience for a review request.
- Ask promoters to leave a public review on your chosen platform.
How to perform funnel analysis for your product
Let’s now understand how you can perform the above types of funnel analysis for your product. Here’s a step-by-step guide.
-
Create your user personas: Build a realistic representation of your target user persona based on their goals and friction points to accurately define which events and conversion metrics to track.
-
Map out each stage in the customer journey: List every single customer journey touchpoint from initial contact to final conversion, ensuring you include often-overlooked steps like email verification or profile setup.
-
Visualize the journey with a funnel analysis chart: Use a product analytics tool to order your journey’s events and generate the data analytics charts that make the sharpest user drop-offs immediately apparent.
-
Identify drop-off points and use Lia to diagnose them: Pinpoint where friction causes users to leave, and leverage Userpilot’s AI agent, Lia, to instantly analyze reports, recordings, and surveys to find the root cause.
-
Pair funnel data with other reports to understand user behavior: Combine funnel reports (which show where users leave) with session recordings and surveys (which show why) to ship targeted UI fixes instead of generic redesigns.
AI agents: The blind spot in your funnel analysis
Every funnel example above assumes the user is human. They click, browse, and interact with UI elements, leaving behavioral traces that user behavior analytics tools capture as page views, click events, and session recordings.
But AI agents interact with software entirely differently from human users.
Rather than opening browser sessions and clicking through interfaces, they call API endpoints and MCP tools, executing tasks programmatically and leaving no trace in the browser-event data your funnel reports depend on. The result is a genuine measurement gap: users drop off your radar the moment they start delegating tasks to agents, even when those agents are actively using your product.
According to Forrester, 89% of B2B buyers now use AI in their buying process. Even for buyers who are ultimately human decision-makers, the early stages of their journey increasingly happen inside an AI assistant rather than on your website, which means the awareness and interest stages of your marketing funnel are capturing a smaller share of the actual decision-making journey.
Two distinct problems emerge from this gap. One is invisible traffic: agentic interactions moving through your product that register nowhere in your funnel tracking system. The other is misread data, where a spike in direct traffic, a drop in session duration, or an unusual bounce pattern might reflect agent behavior rather than a product quality problem. Treating it as the latter wastes significant optimization effort.
Tracking agentic traffic requires a different approach because traditional analytics tools weren’t built for it.
Contentsquare launched dedicated LLM and agent analytics in March 2026, giving teams visibility into which visitors and interactions are AI-driven versus human.
The two-pronged approach I’d recommend is to keep running your existing human-behavioral funnel reports as they are and add a separate tracking layer for agent interactions.
Best funnel analytics tools in 2026
Customer analytics platforms make it possible to visualize user funnels and identify friction points in the customer journey without writing SQL. Here are three worth evaluating, depending on what you’re tracking.
Google Analytics: Best for tracking website conversion funnels
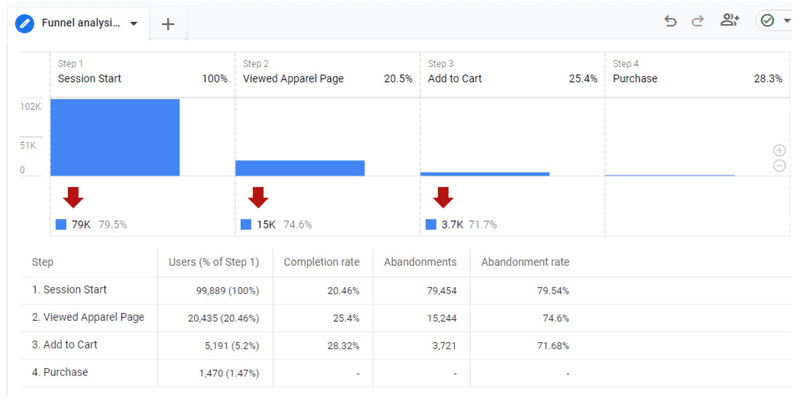
Google Analytics is a website analytics platform that tracks and reports user behavior across websites and apps. You can use it to track marketing metrics (page views, traffic sources, bounce rate, time on site, and conversion rates) and set up goals and funnel reports to visualize how users progress through specific steps toward conversion.
GA4’s funnel exploration tool lets you define any sequence of pages or events and see the drop-off rates between each step. Its free tier covers most marketing funnel needs for SaaS teams, while Google Analytics 360 (the paid version) is designed for enterprise-level analysis with higher data volumes and more complex segmentation requirements.
Userpilot: Best for in-product funnel analysis with AI-assisted diagnostics
Userpilot is a product growth platform that combines funnel analytics with in-app engagement tools, so you can not only identify where users drop off but immediately build the guidance that helps them get through. The funnel feature lets you create custom events for any user journey and generate reports showing how many users completed each step, with breakdowns by user properties like device type, location, sign-up date, plan, and segment.
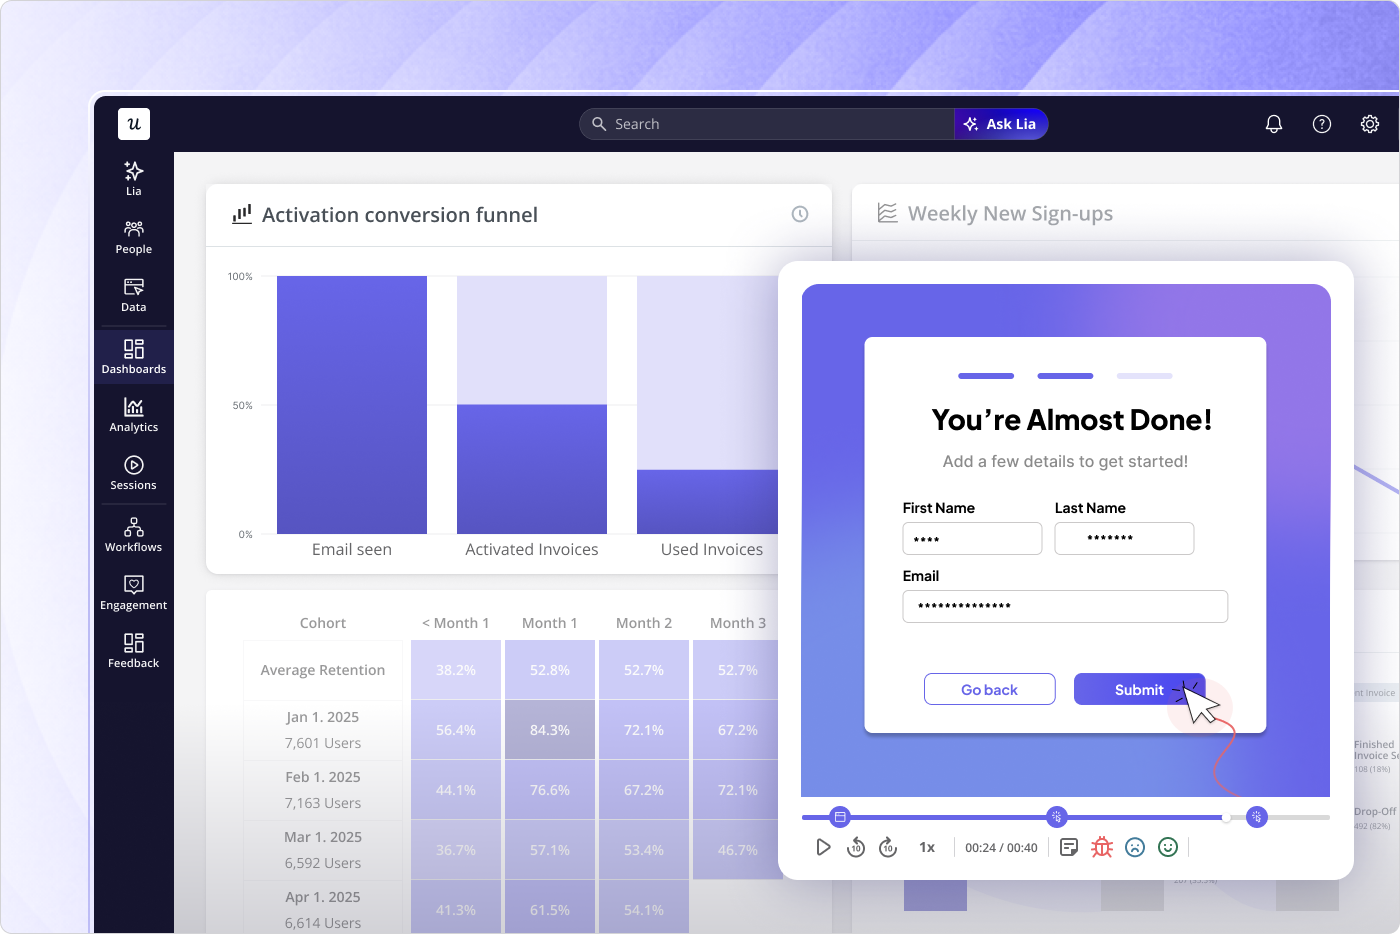
The 2026 addition that changes the workflow is Lia, Userpilot’s AI agent. You can ask Lia directly about your funnel data: “Where is the biggest drop-off in our trial activation funnel this month?” and get a diagnostic response that draws from funnel reports, session recordings, and survey data simultaneously. Lia also monitors funnels continuously, alerting you when conversion rates shift outside normal variance. You also get an MCP Server that makes your product usage metrics accessible to AI agents and LLM-powered tools.
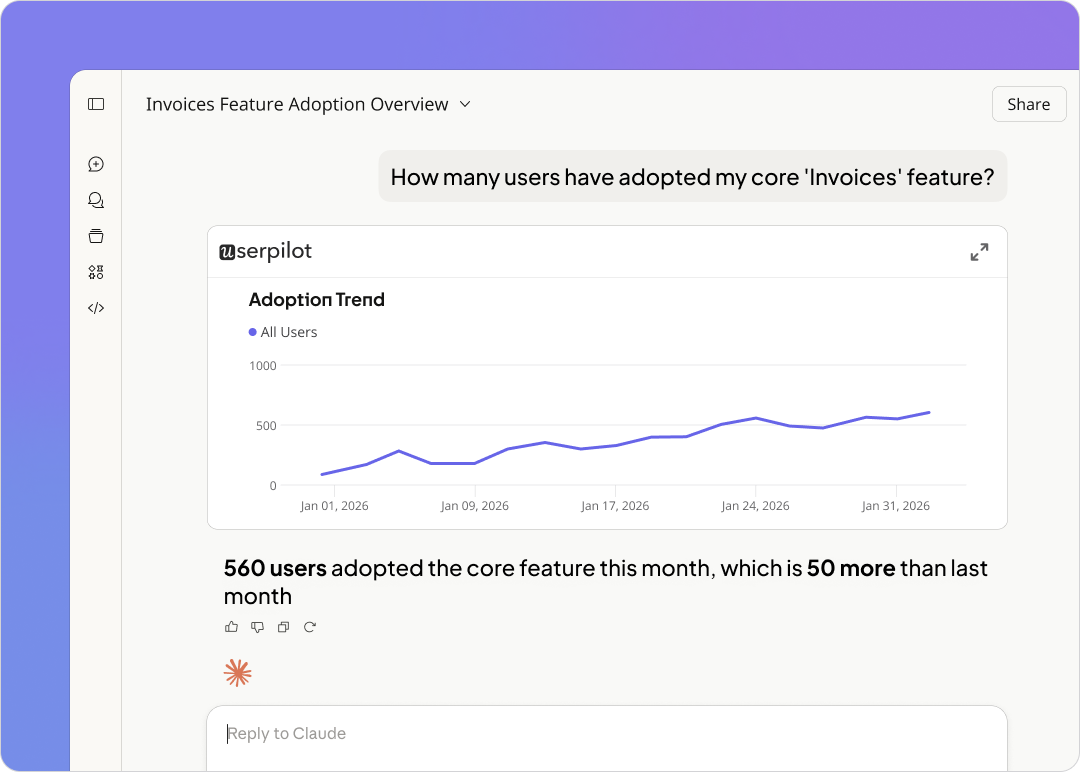
Userpilot’s broader product analytics suite also includes path analysis, trend analysis, feature usage reports, and a customizable feature engagement dashboard, making it possible to investigate the “why” behind any funnel drop without switching between tools.
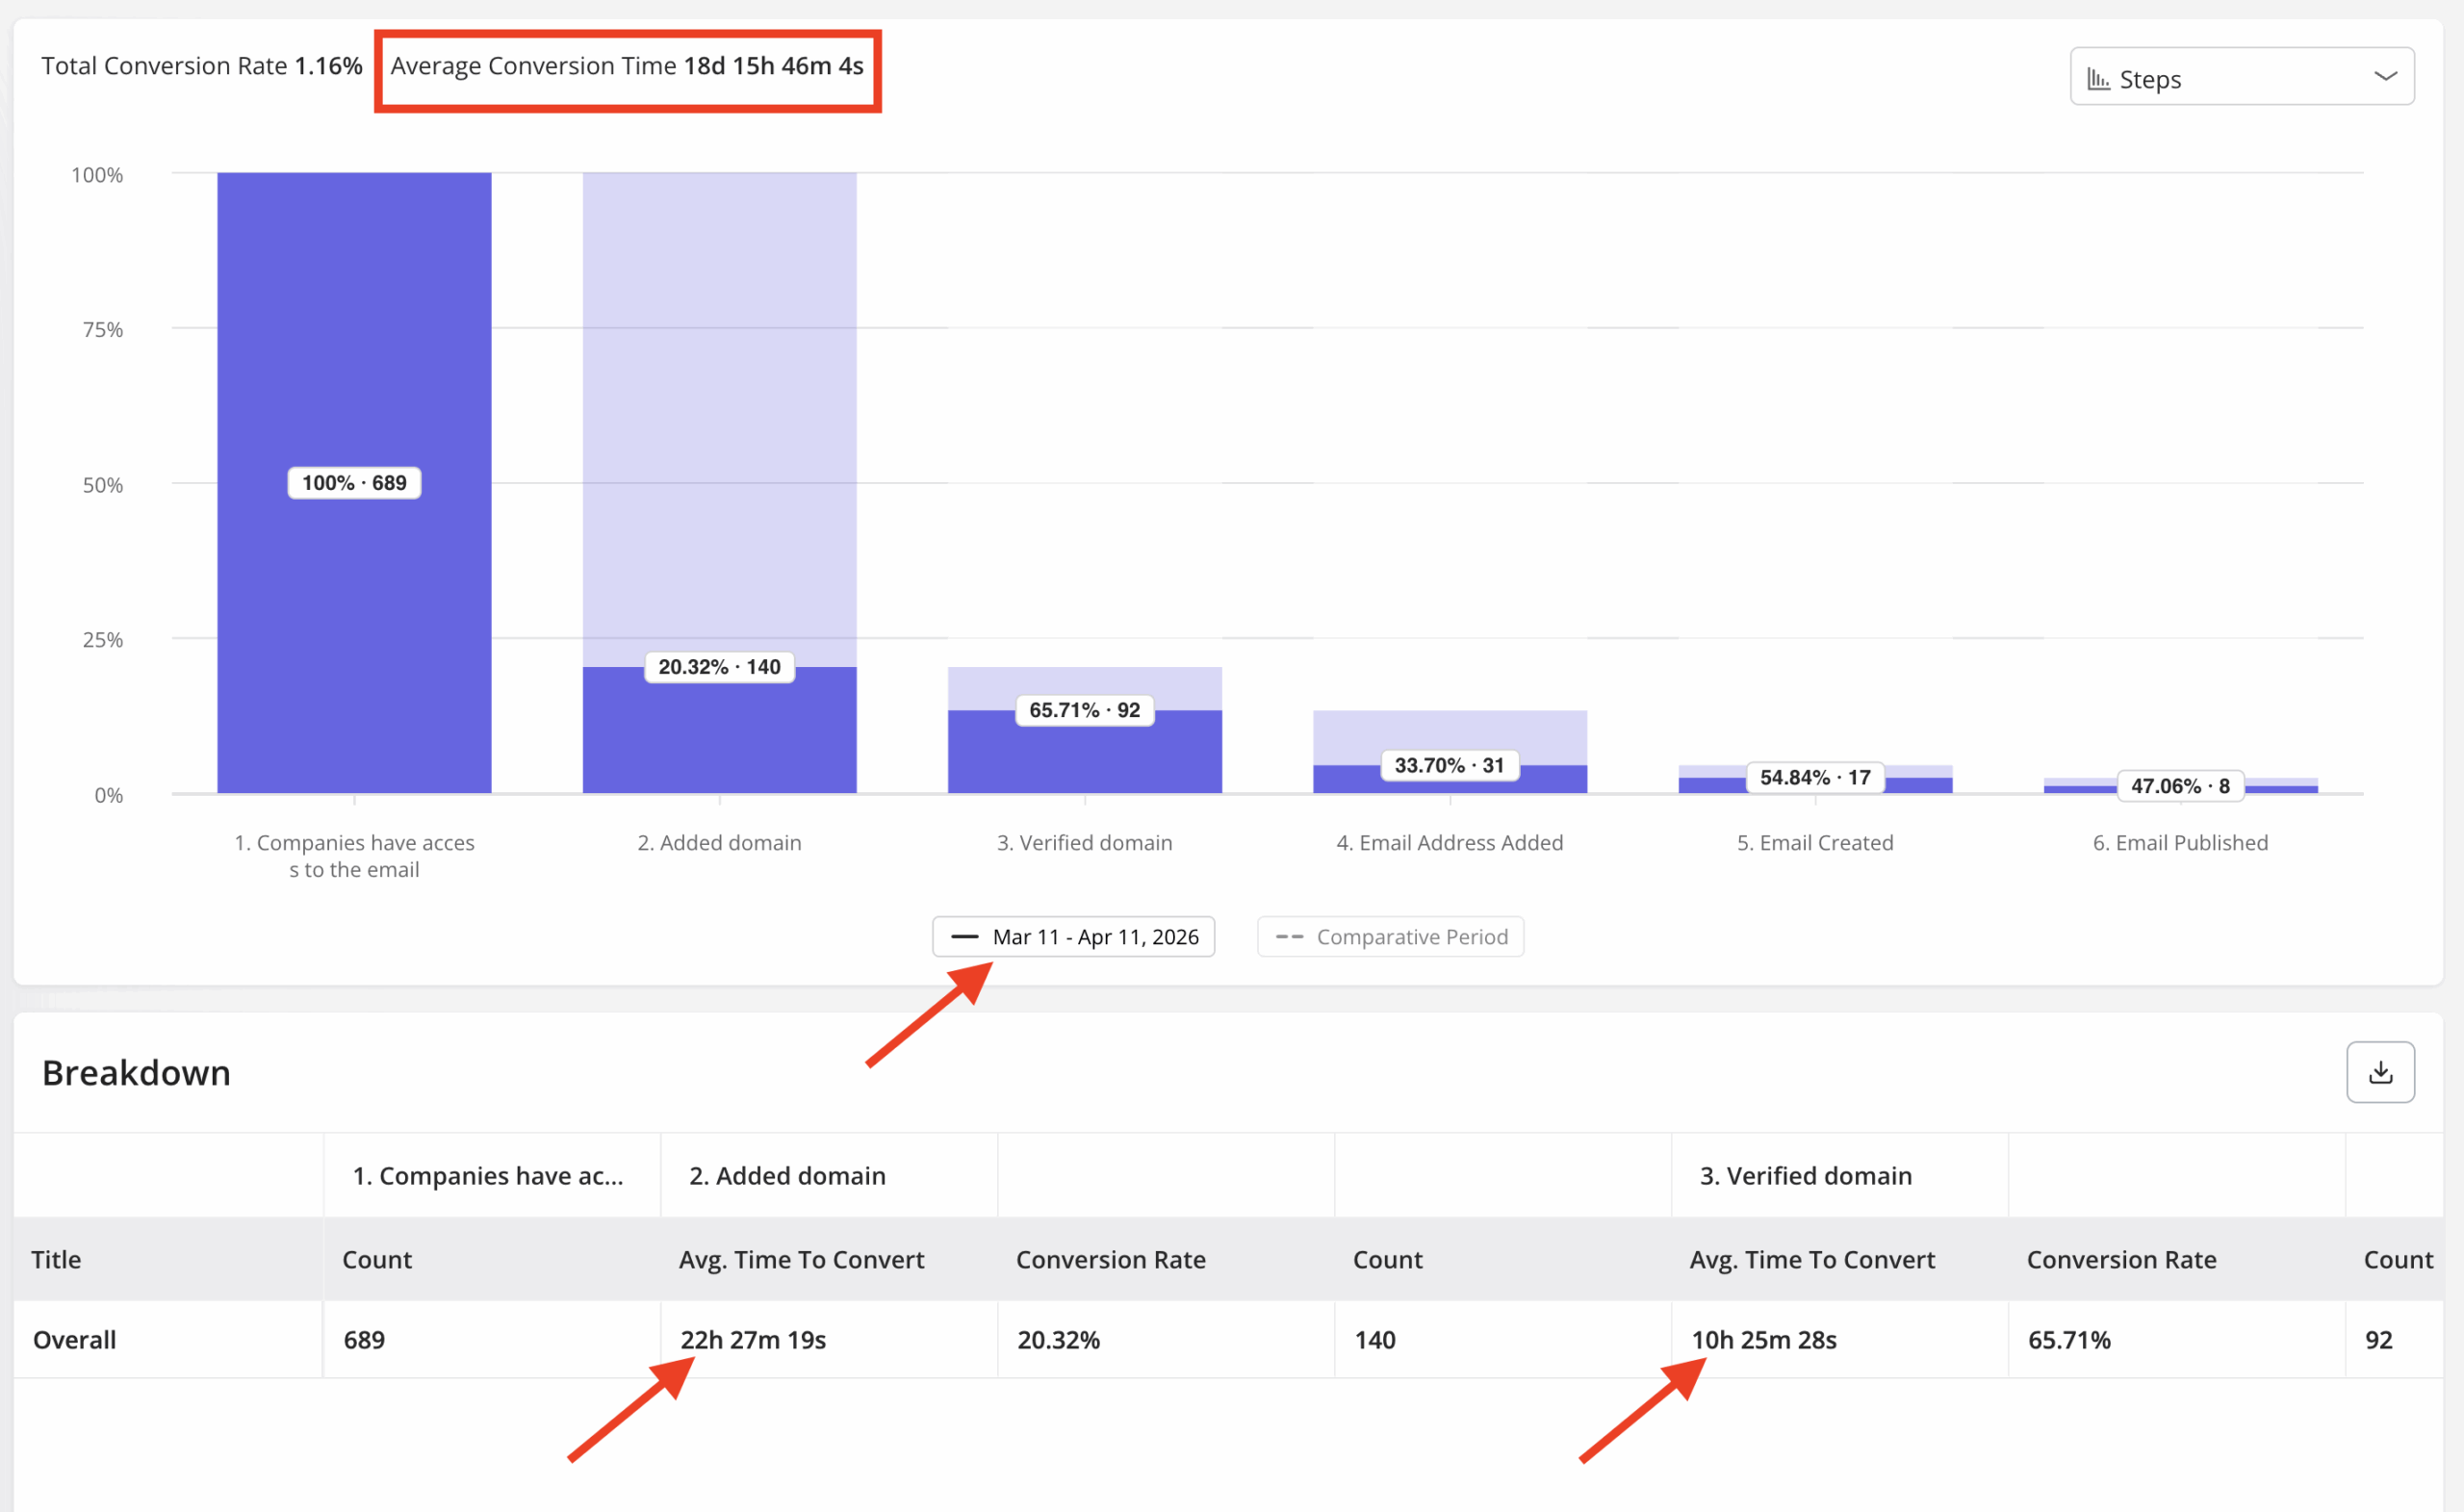
When we launched Userpilot’s email feature, funnel analysis showed a sharp drop-off at the verification step. Having built-in in-app engagement features helped here.
“Within a few hours, I built a targeting tooltip and checklist inside Userpilot highlighting the correct steps, with no engineering ticket required. The drop-off closed within days, and I wouldn’t have caught it without watching activation at that level of granularity.”
Contentsquare: Best for experience analytics including AI and LLM traffic
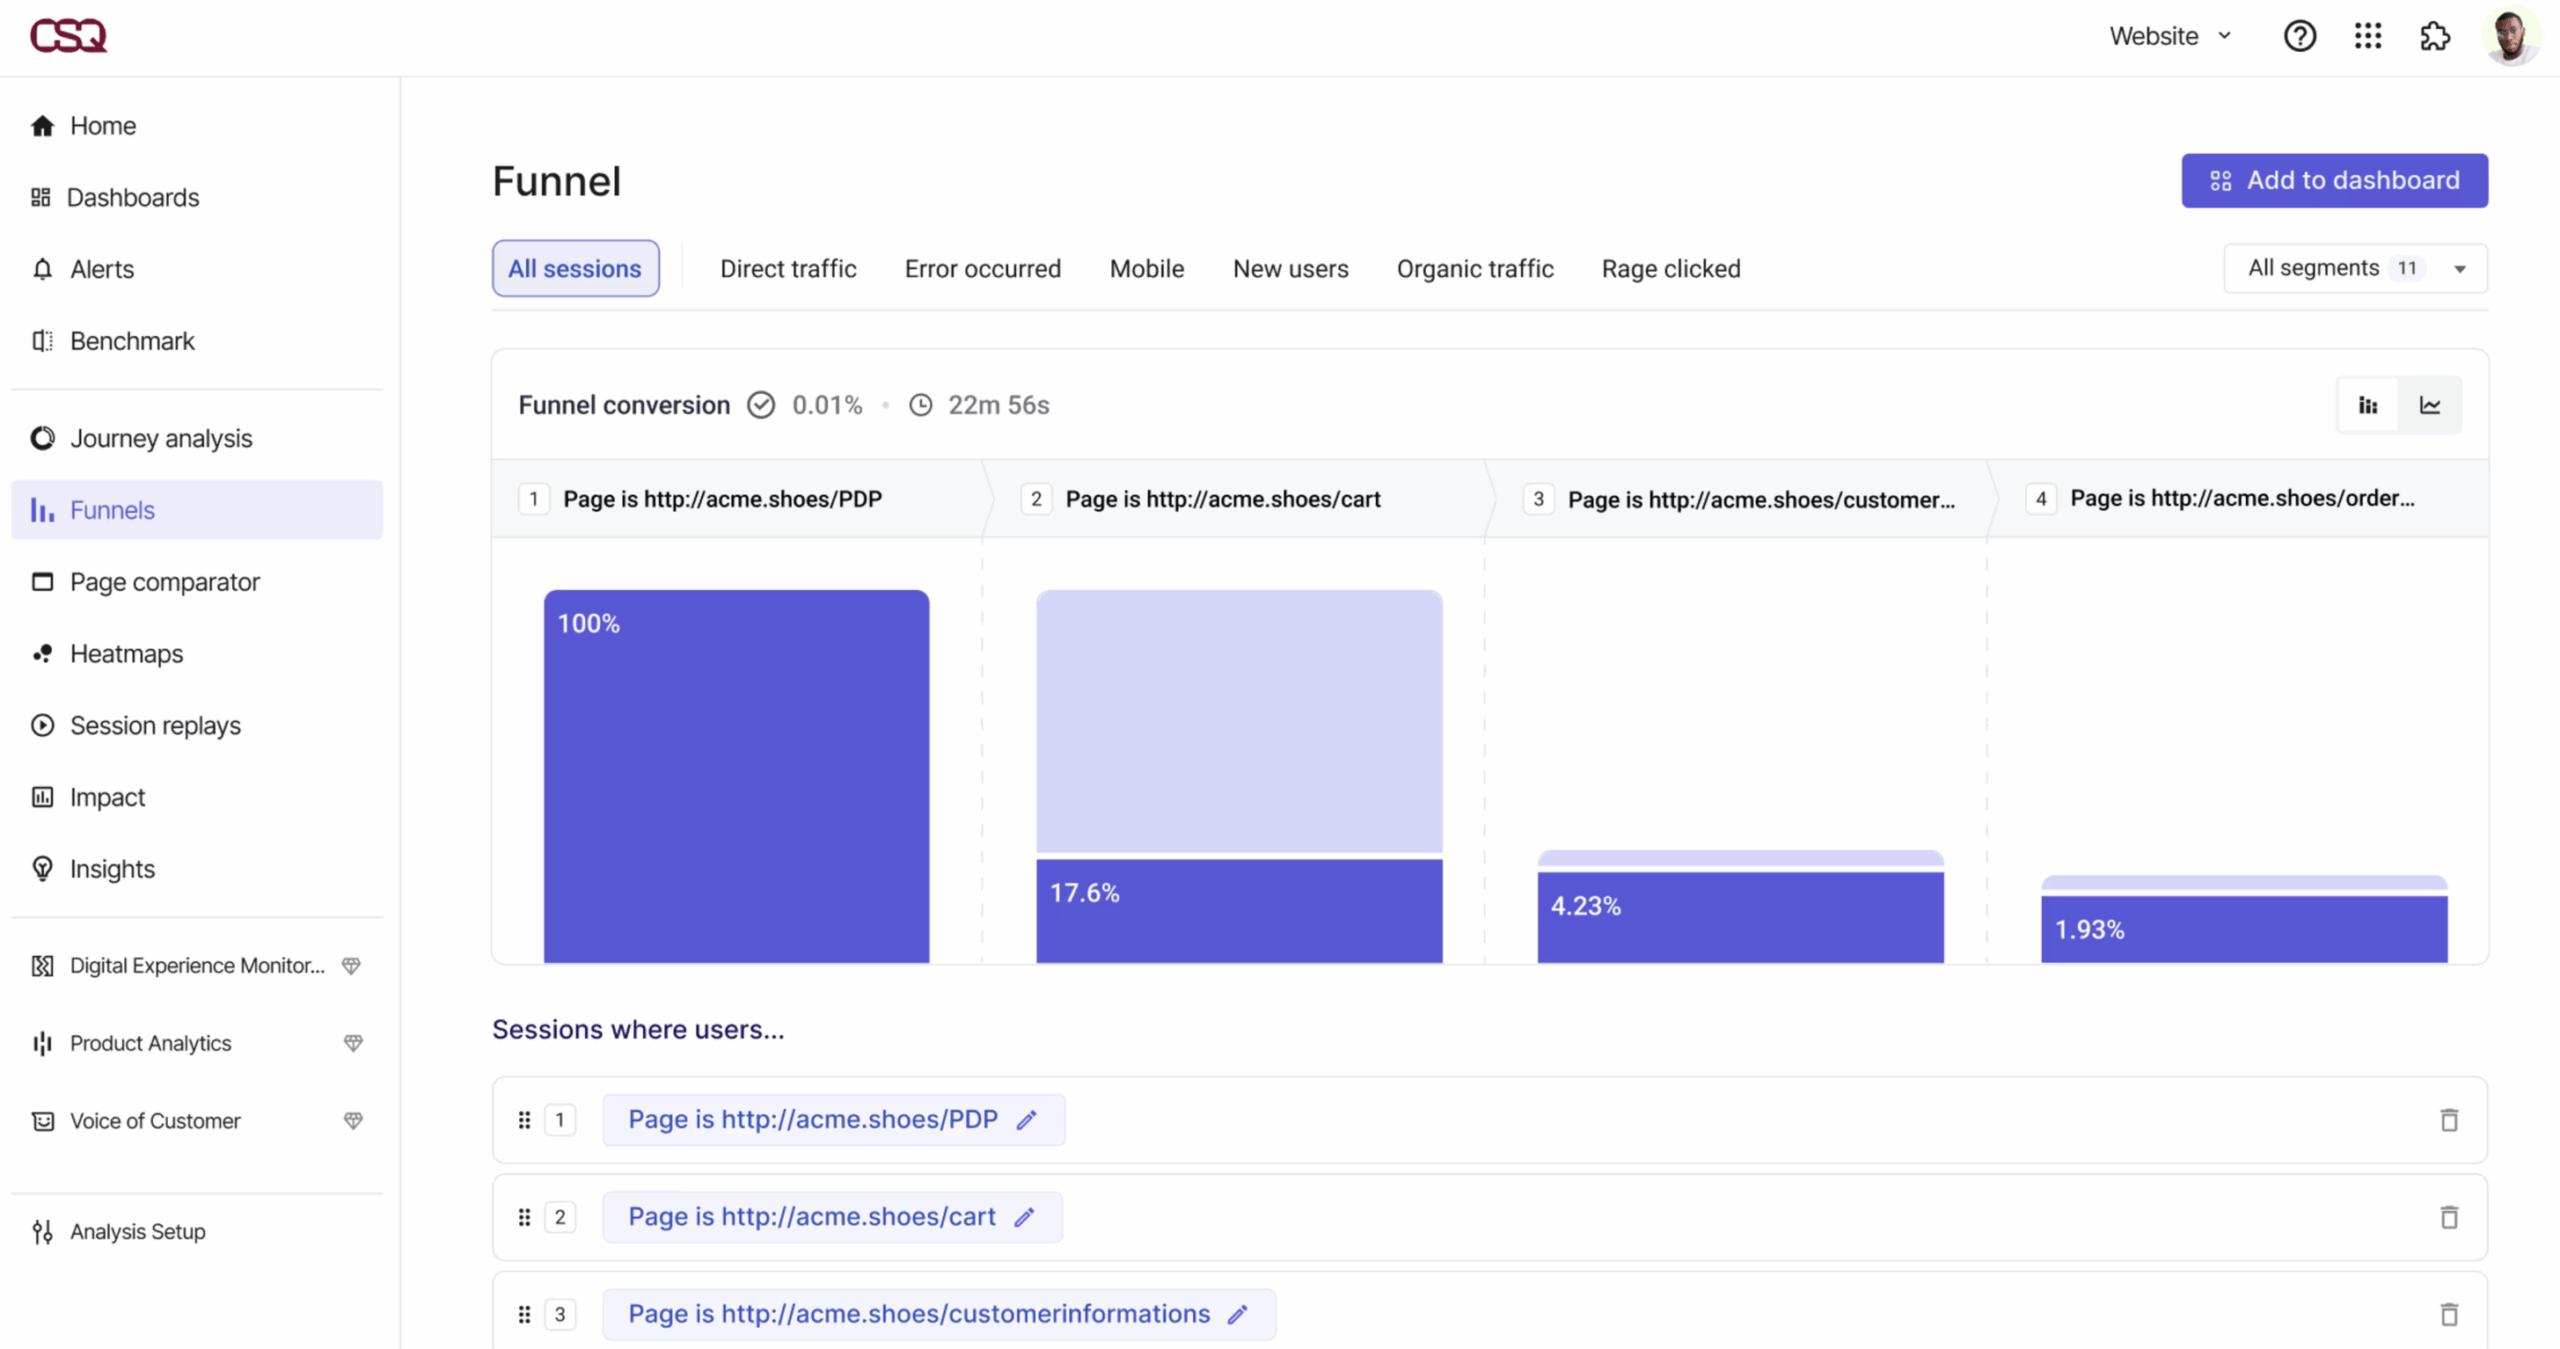
Contentsquare is a digital experience analytics platform that acquired Hotjar in 2021, bringing together heat map analysis, session replay, journey analysis, and voice-of-customer tools for teams of all sizes. Its dedicated AI agent and LLM analytics capabilities make it one of the few tools that can show you what both your human users and AI-driven traffic are doing across the same digital properties.
The AI traffic analytics break down your visitor traffic by LLM source (ChatGPT, Perplexity, Gemini, Copilot, and others), so you can understand whether visitors from AI assistants are landing on the right pages and converting. Contentsquare also has a funnel analysis feature inside its product analytics module for tracking in-product user journeys alongside its experience analytics data.
Conclusion
Funnel analysis can be the key to improving your product experience. It can help you spot and fix friction spots that could be hindering product adoption, conversions, reviews, and onboarding. And with a tool like Userpilot, you can ship the in-app experience fix without having to involve the engineering team.
Book a demo with our team and see how Userpilot can help.
FAQ
What is the difference between funnel analysis and a user journey map?
A user journey map is a qualitative visualization of a user’s experience with your product from first touch through long-term use, capturing emotions, motivations, and pain points at each stage from user research. Funnel analysis is quantitative: it shows you exactly how many users completed each step of a specific journey and where the drop-offs occurred. The two complement each other, with journey maps capturing what users feel and funnel analysis revealing what they actually do.
How do AI agents affect funnel conversion rates in SaaS?
AI agents interacting with your product don’t generate the browser events, page views, or session data that traditional funnel analysis relies on. This means agentic traffic passes through your product without showing up in standard funnel reports, causing your reported conversion rates to drift away from your actual conversion rates as agent traffic grows. If a meaningful share of your traffic is agentic, you need a separate tracking approach running in parallel with your standard human-behavioral funnel reports.
How often should you run funnel analysis for your product?
For most SaaS products, a weekly review of key funnel metrics is the right baseline. It’s frequent enough to catch significant conversion rate changes before they compound. After any major product change (redesigned onboarding flow, new pricing page, updated checkout), it’s worth reviewing funnel data daily for the first 7 to 14 days to catch regressions quickly. AI-assisted monitoring tools like Lia handle the continuous watch automatically, so you only need to investigate manually when something actually changes rather than checking on a fixed schedule.
About the author