AI Can Build Your Churn Prediction Model. Here’s the Part It Still Can’t Do


I recently saw a LinkedIn post where someone shared a Python script that built a model for churn prevention with up to 72% accuracy. And SaaS companies are moving fast in the same direction: 77% of B2B SaaS teams have already deployed AI or integrated it into their workflows.
And the shift makes sense, especially as 76% of customers gravitate toward AI-native products and experiences.
Yet churn is still stubbornly high. Recurly’s analysis of 1,200+ subscription companies puts median annual SaaS churn at 4.79%. Across the industry, we’ve become much better at predicting churn, but not nearly as good at preventing it. Why?
I’m James Mitchinson, Head of Customer Success at Userpilot. In this post, I’ll unpack the gap between prediction and prevention: the quality of the signals feeding your model and the interventions that determine whether customers stay or leave.
The key takeaways
- Your model is only as good as the signals feeding it, and most companies are feeding it the wrong ones.
- Three specific behavioral moments predict churn more reliably than any composite risk score.
- AI has genuinely improved how CS teams prioritize accounts at scale; timing quality is still a judgment call no algorithm makes for you.
- A churn flag without a clear intervention playbook is just expensive reporting.
- Before you build or buy a model, your team needs a shared definition of what “healthy” actually looks like in your product.

Your signals are more important than your algorithm
One of the most memorable retention saves I’ve been part of happened about eighteen months ago. A customer had high login frequency, well above our internal benchmark, but was consistently below average on actual outcomes: flows published, experiments launched, active users onboarded. Every health score heuristic we had flagged them as healthy.
We reached out before they said anything. It turned out the primary user had changed three months earlier, and the new person was logging in, clicking around, and producing nothing because nobody had re-onboarded them for their specific use case. We fixed the gap in under a week, but without that behavioral pattern on our radar, we would have missed them entirely until the renewal conversation.
The alert that triggered the outreach wasn’t a composite health score. We caught it because we were watching one specific ratio within the account’s usage patterns: activity against outcomes, not just activity volume on its own.
There’s another counterintuitive signal we’ve learned to watch: ticket silence. Most people assume fewer support tickets mean higher customer satisfaction and a healthier account. In my experience, the opposite is often true.
Customers who have stopped trying to extract value from the product tend to stop asking for help first. The absence of friction requests is sometimes the loudest churn signal in the data.
Abrar Abutouq, our PM at Userpilot, showed me a related blind spot on the feature adoption side. A new mobile feature had 10% raw adoption across our customer base, which looked underwhelming on the surface. When she filtered by customers who were actually eligible to use it, adoption was 25%.
The model had been scoring a segment of customers as under-adopting a feature they literally couldn’t access. Raw adoption rates mislead when eligibility isn’t factored in.
This is why combining behavioral signals with qualitative context changes prediction accuracy more than upgrading the algorithm does. Companies actually focused on reducing churn, not just scoring it, layer what customers are doing with why they’re doing it, or why they’ve stopped, and they consistently surface risk that usage dashboards miss entirely.
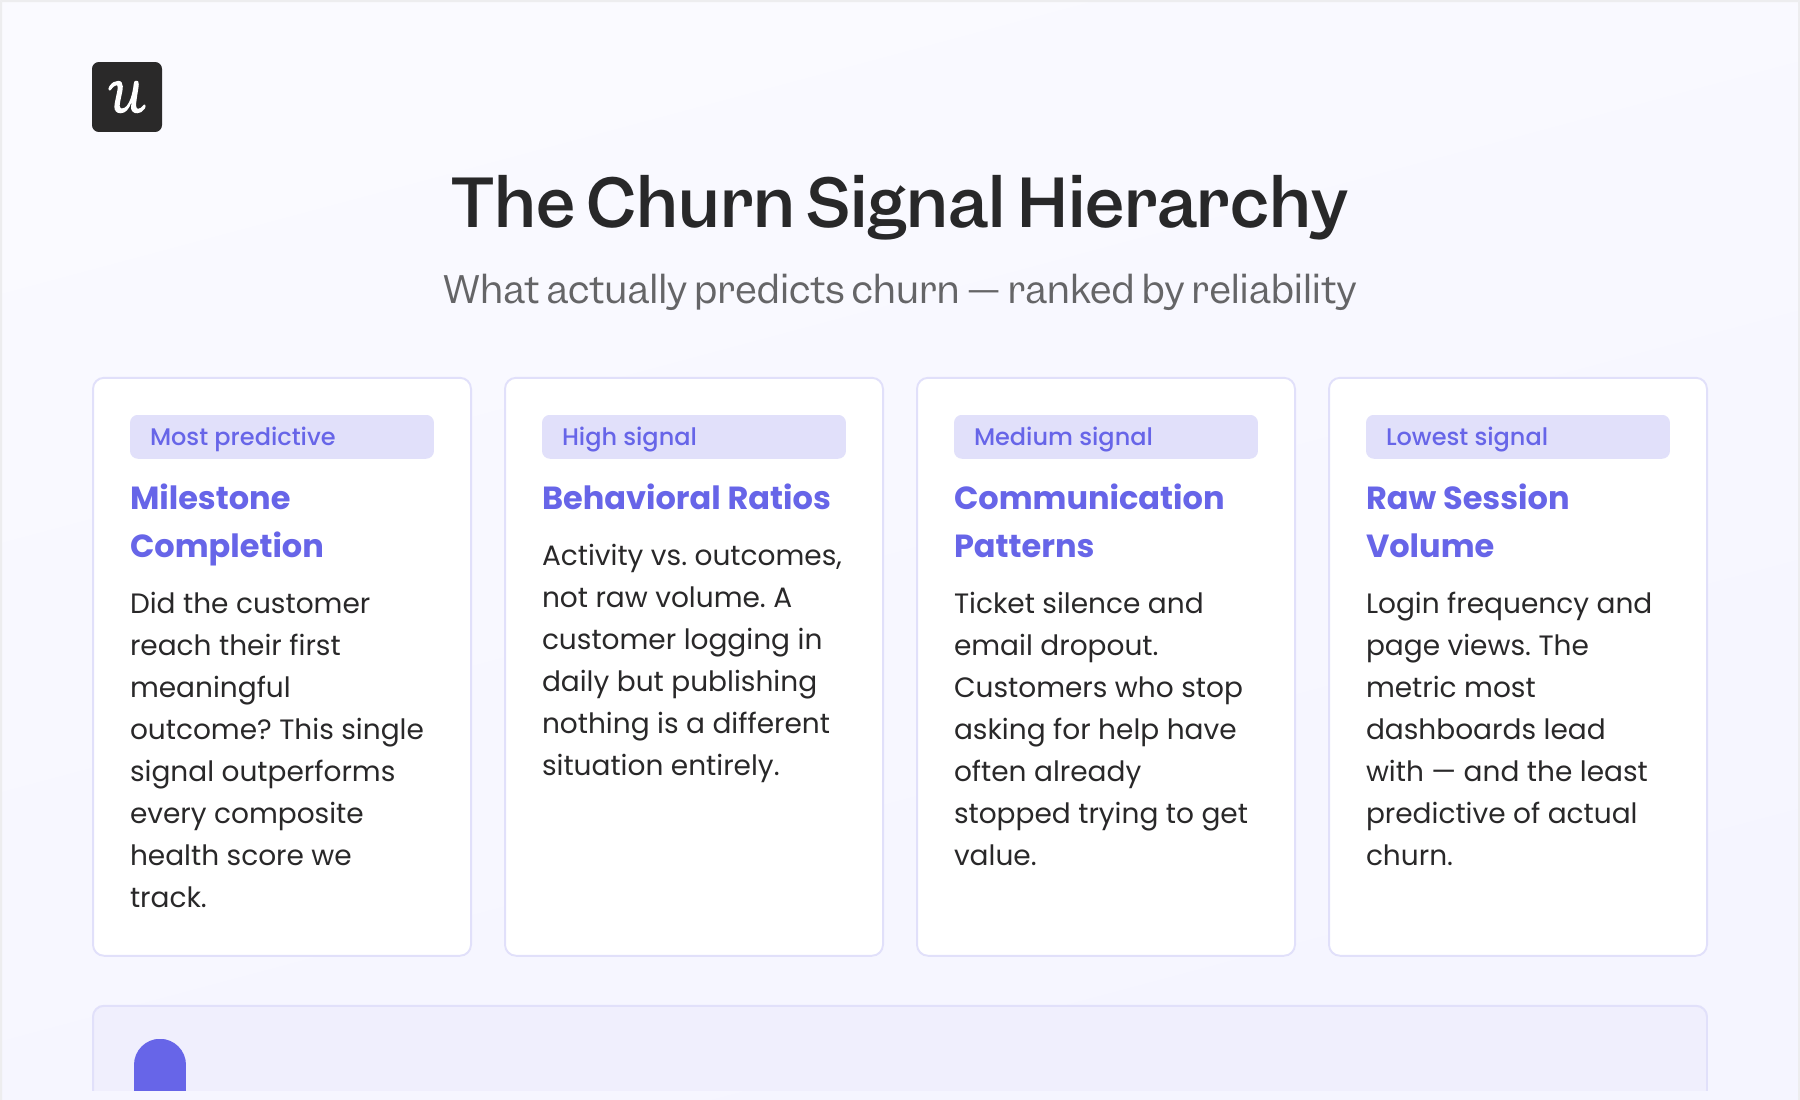
After watching this across hundreds of accounts, a consistent signal hierarchy has emerged for predicting customer churn. Milestone completion sits at the top: whether a customer has reached their first meaningful outcome in the product is more predictive than almost anything else we track. Below that, in descending order of reliability: changes in communication patterns, billing page behavior, and raw session volume at the bottom, despite being the metric most retention dashboards lead with.
Three moments that predict churn better than any risk score
Risk scores are averages across time. But churn decisions rarely happen evenly over time. They cluster around specific moments, and in our experience managing hundreds of accounts at Userpilot, the same three come up again and again as the ones where identifying at-risk customers early actually changes the outcome.
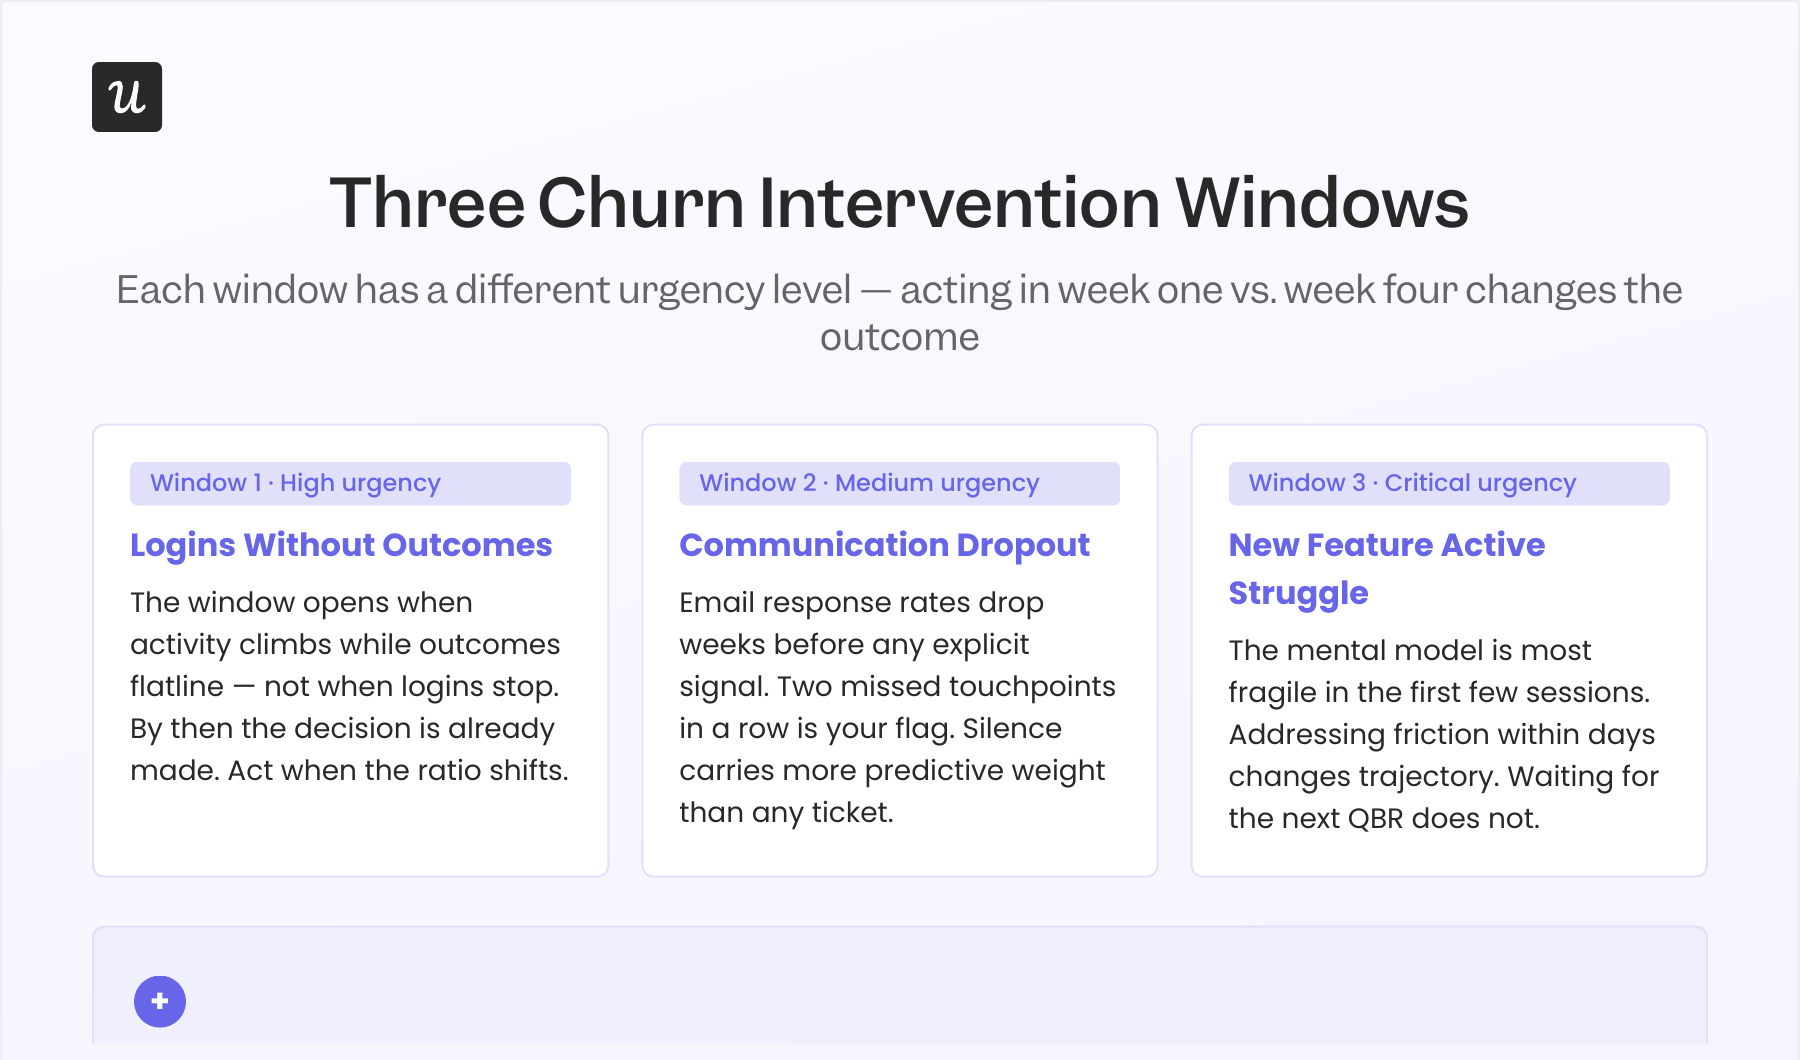
Logins without outcomes
A customer who logs in regularly but produces no measurable outcomes is either stuck, disengaged, or has lost the internal champion who used to drive results in the product. This is the most consistently predictive signal I’ve seen across account types and contract sizes.
The moment to catch is not when logins stop. By the time logins stop, the decision has usually already been made. The window opens when the ratio shifts, activity climbing while outcomes flatline, and it closes faster than most CS teams expect.
Communication dropout
Email response rates drop before customers say anything directly, sometimes weeks before. When a previously responsive customer stops replying to check-ins, stops showing up to QBRs, or stops engaging with product updates, that silence carries more predictive weight than any ticket they’ve ever opened.
Session replay data is particularly useful in this window because it tells you what’s happening during the sessions that do occur. A customer who still logs in but spends most of their time on the billing or settings page is a fundamentally different situation from one who’s active in core feature workflows.
New feature active struggle
This is the moment most CS teams are underweight. When a customer tries a new feature and fails, not abandons but actively struggles, the intervention window is short. Their mental model of the product is at its most fragile in those first few sessions, and addressing the friction within days changes their trajectory in a way that waiting for their next quarterly review simply does not.
Abrar’s team built this instinct into how they handle adoption signals at Userpilot. She described one instance where email feature friction was causing users to drop off during domain verification: “Within a few hours, I just created a targeting modal and showed it to users and highlighted the correct steps for them to make it clear what to do next. That helped a lot in reducing friction and supporting users in real time without involving our dev team.” The speed of the response is most of the value, not the sophistication of the fix.
The timing window AI is only starting to figure out
I’ve said this to my team more times than I can count: if a customer is telling you they don’t want to continue with the product, it’s already too late. By the time a customer articulates a desire to leave, the decision process has been running in the background for weeks, sometimes months.
The problem is that catching risk early requires both identification and available capacity, and at scale those two things are rarely both present at the same time. Individual CSMs on my team cover more than 100 accounts each. There is no world in which every account gets a meaningful proactive review every week without something to surface the ones that actually need attention right now.
AI has genuinely improved this, and I don’t want to understate the shift. Instead of working from “biggest contract equals most attention” or a gut-feel health score, we can now identify customers who need proactive retention outreach across the entire book simultaneously. That changes what a CSM spends the first hour of their Tuesday on, and the compounding effect of that is real.
What AI hasn’t changed is the timing quality gap once an account is flagged. Knowing that a customer is at risk this week is useful. Whether to reach out today, wait for a natural touchpoint, or escalate to an executive relationship is still a judgment call the model can’t make.
The algorithm surfaces which accounts need attention. Deciding when and how to act remains the CSM’s call.
When the flag fires, the work starts
A churn flag is a starting point, not a solution. What happens between the flag and the customer’s renewal decision is where churn is actually won or lost, and most teams underinvest in that stretch because the flag itself feels like progress.
The stakes of getting this right are higher than people tend to acknowledge in day-to-day planning. Customer acquisition costs run 5 to 25 times higher than the cost of retaining an existing customer. Every intervention that works is revenue that doesn’t need to be replaced with a brand-new logo that takes 6 to 12 months to reach the same outcome value.
Getting the intervention right means matching the response to the actual root cause. When Abrar’s team caught the email feature struggle, she didn’t file a dev ticket or schedule a training call. She built an in-app checklist that surfaced the correct steps in context, within hours of identifying the problem.
That distinction is worth internalizing carefully. Some flagged accounts have a CS problem: relationship friction, value perception drift, a missed QBR that let doubt accumulate. Others have a product experience problem: unclear flows, missing guidance, a feature that looks broken but isn’t.
Sending a CSM to solve a product experience problem is expensive and often ineffective. Pointing automated in-app guidance at a relationship problem just adds noise. Routing correctly is what makes targeted retention strategies work, and current AI tools aren’t reliably making that call on their own.
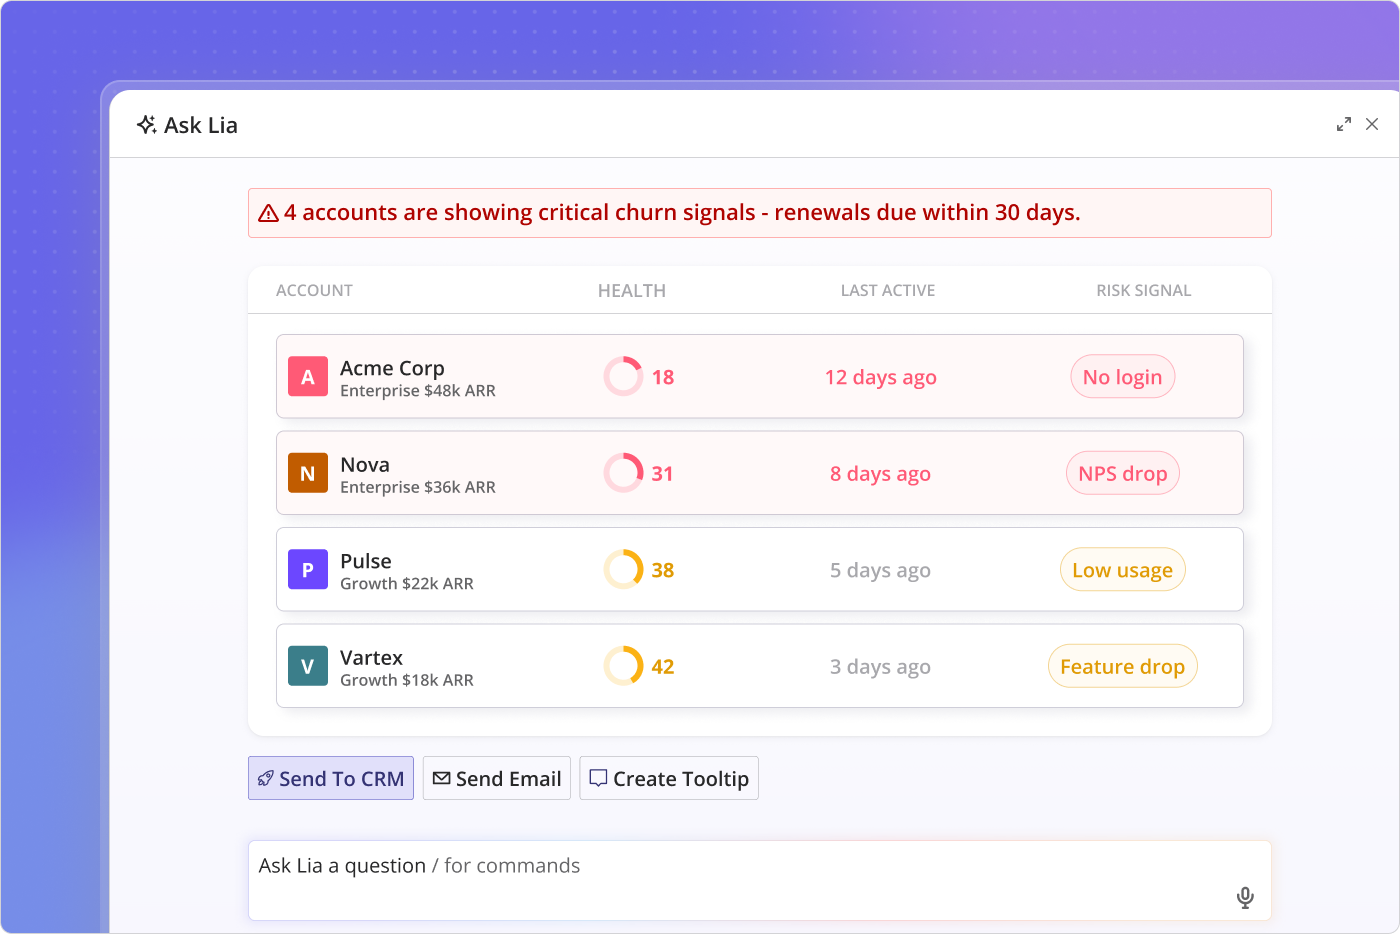
At Userpilot, Lia, our AI agent built for Customer Success, flags churn-risk accounts and surfaces the behavioral context behind each flag so the CSM can make that routing decision faster. The goal is to reduce the time spent assembling context before acting, not to make the call for the CSM.
The question that has to come before the model
Before any churn prediction model can produce meaningful risk scores, someone on your team has to answer a question most companies skip or defer indefinitely: what does “healthy” actually look like in your product for your customers?
I’ll be honest about our own experience here. We’ve spent real time as a team discussing what a healthy Userpilot customer looks like, and the answer is still incomplete. We know some of the proxies: flows published, MAU trends, experiment runs, NPS cadence, and user seat growth.
But proxies mislead. A customer can score well across every proxy metric and still be two weeks from churning because their internal champion left, and nobody on our side noticed the handoff happened.
A definition of “healthy” that only tracks what’s measurable in the product will produce a model that optimizes for what’s measurable, not for actual retention outcomes. The missing piece is almost always qualitative: relationship depth, internal adoption breadth, and whether the customer’s success goals have changed since they signed.
None of this invalidates predictive modeling. A 5% improvement in customer retention translates to a 25% to 95% improvement in profits, depending on your business model, per Bain & Company research that has held up across two decades.
Building the model is worth it. A model built on an incomplete definition of health, though, will produce risk scores that are precisely wrong in exactly the cases where precision matters most.
Abrar described it this way when we talked about how she approaches customer feedback and AI-generated suggestions for product and retention decisions: “Every single suggestion you gather from feedback, from AI or a teammate, it’s an experiment. You need to try it out.” That framing applies directly to churn modeling. Build the machine learning model, run the experiment, and pay attention to what it misses as much as what it catches, because the misses will tell you what you still haven’t defined well.
If you want to see how Userpilot helps CS teams improve customer retention by acting on churn signals before they become renewal conversations, book a demo. The model is only part of it.
About the author