RICE Score Calculator: Prioritize Your Product Roadmap With Product Analytics


I recently reviewed a product backlog that hadn’t meaningfully moved in months. Feature requests from sales, bug fixes from engineering, and “good ideas” from leadership were all competing for attention. The issue wasn’t volume but clarity.
When you’re managing dozens of competing priorities, instinct is not a strategy. It pushes teams toward output instead of outcomes and turns the roadmap into a negotiation. What you need is a prioritization framework that turns opinion into numbers. The RICE framework does that through a simple score calculator. I will show you how Userpilot’s product analytics tools make it easier.
What is the RICE score?
The RICE scoring model is a prioritization framework that helps product teams decide which initiatives to work on first by weighing value against cost. It was originally introduced by Sean McBride at Intercom to address a limitation in the traditional Impact vs. Effort matrix. Impact alone isn’t enough. A feature can be valuable, but if it only affects a small fraction of users, the investment may not be justified.
RICE evaluates initiatives using four factors: Reach, Impact, Confidence, and Effort. Together, they produce a standardized score that helps teams explain why a feature belongs on the roadmap now instead of later.
What the RICE acronym stands for
I’ve seen teams score features with made-up numbers because they didn’t define what “high impact” actually means. The four factors only work if everyone agrees on the inputs. Here’s how I define Reach, Impact, Confidence, and Effort so the scores aren’t just theater.
Reach
Reach estimates how many users will be affected by the feature within a specific time period. This is the most important variable for avoiding the “niche trap”-over-indexing on features that only power users or a tiny subset of your audience will ever see. You usually measure Reach in “number of people per quarter.” For example:
- If a feature affects every user who logs in, your Reach is your total count of active users.
- If a feature only affects users on the Enterprise plan, your Reach is the number of users in that specific user segment.
- If a feature is for a specific conversion funnel, your Reach is the number of users who visit the entry page of that funnel.
Pull Reach from product analytics, not estimates. In Userpilot, filter events by the specific screen or action to get exact user counts. If you’re scoring an onboarding improvement, check how many users triggered that step last quarter.
Impact
Impact measures the contribution a feature makes toward a specific business goal. This goal could be increasing revenue, reducing customer churn, or improving satisfaction (NPS). Since Impact is harder to measure precisely than Reach, the RICE model typically uses a multiple-choice scale to avoid analysis paralysis:
- 3 = Massive impact: This creates a fundamental shift in the user experience or business model.
- 2 = High impact: This significantly improves a core workflow.
- 1 = Medium impact: A noticeable improvement, but not game-changing.
- 0.5 = Low impact: Small UX tweaks or minor aesthetic changes.
- 0.25 = Minimal impact: Changes most users won’t notice.
Validate your impact score with qualitative data. If 80% of your detractors mention a specific friction point in customer feedback, fixing it likely scores 3 (massive) or 2 (high).
Confidence
The Confidence score is the reality check. It accounts for the uncertainty in your estimates. It prevents you from prioritizing exciting “moonshots” that have no data backing them up over boring improvements that are guaranteed to work. Confidence is measured as a percentage:
- 100% = High confidence: You have hard data, user research, and engineering specs.
- 80% = Medium confidence: You have some data or strong anecdotal evidence, but haven’t fully validated the solution.
- 50% = Low confidence: This is a wild guess or “gut feeling.”
If your confidence score is below 50%, don’t build yet. Run product experiments to gather solid data and raise that score first.
Effort
Effort is the cost. It represents how much effort (total time) it will take your team to ship the feature. This is usually measured in “person-months.” If a project takes one designer one week, and one developer three weeks, that is roughly 1 person-month (0.25 + 0.75).
Reach, Impact, and Confidence are the numerators (the benefits). Effort is the denominator (the cost). A high impact score means nothing if effort requires significant resources and two years to build when you could ship ten medium-impact features instead.
How to calculate RICE score
The RICE formula is straightforward. Multiply the benefits (Reach, Impact, Confidence) and divide by the cost (Effort).
RICE Score Calculation: (Reach x Impact x Confidence) / Effort = RICE Score
Example: Growth driver vs. Nice-to-have
Feature A: Checkout flow redesign
Reach: 2,000 users/month (from Userpilot checkout event analytics)
Impact: 3 (Massive revenue impact)
Confidence: 100% (Funnel drop-off data from Userpilot)
Effort: 4 person months
Score: (2,000 x 3 x 1.0) / 4 = 1,500
Feature B: Dark mode
Reach: 5,000 users
Impact: 0.5 (Low business impact)
Confidence: 80% (Requested, but no usage data)
Effort: 3 person months
Score: (5,000 x 0.5 x 0.8) / 3 = 666
Feature A scores 1,500. Feature B scores 666. Higher RICE scores represent better return on effort. In this case, RICE prevents a high-reach “nice-to-have” (Dark Mode) from stealing resources from a true growth driver (Checkout redesign).
Getting your numbers
Pick a time frame (monthly or quarterly) and stick with it.
- For Reach, pull the actual number from Userpilot analytics. Scoring an onboarding fix? Filter for users who hit that screen last month. That’s your Reach.
- Impact uses the standard scale: 3 for massive, 2 for high, 1 for medium, 0.5 for low, 0.25 for minimal.
- Confidence is a percentage: 100% with test data, 80% for strong signals, 50% when guessing.
- Effort is person-months across design, engineering, and QA.
The RICE score formula is: (Reach × Impact × Confidence) ÷ Effort.
Sort by score. Higher RICE scores mean better value for the effort. But don’t treat it like law. Dependencies and technical constraints still matter. What the calculator kills is the VP’s pet project that scores 340 but “feels strategic.” It forces the trade-off into the open.
When to use the RICE score formula (and when to abstain)
RICE works best when you have data and need to prioritize features across different categories. I use it for mature products where I can pull real usage numbers and compare completely different types of work.
Use RICE when:
- Managing a mature product: When you have a live product with actual traffic, you have the data needed to prioritize features accurately.
- Comparing disparate ideas: It is hard to compare competing ideas like “Fix Bug A” vs. “Build Feature B” vs. “Integrate Tool C.” RICE flattens these apples and oranges into a single “ROI” number.
- Justifying “no” to stakeholders: When the Sales VP asks why their feature isn’t being built, you don’t say “I didn’t want to.” You say, “It has a RICE score of 400. We are currently working on projects with scores of 2,000+.” It makes the rejection objective.
Do NOT use RICE when:
- Early-stage MVP: If you are searching for product-market fit, you don’t have enough users for “Reach” to mean anything. In this stage, you need vision and big bets, not optimization.
- Breaking emergencies: If your server is on fire or a payment gateway is broken, you don’t calculate a score. You put the fire out.
- Addressing technical debt: RICE is notoriously bad at valuing technical debt. Refactoring code usually has a “Reach” of zero (users don’t see it) and an “Impact” that is invisible until things break. You should allocate a fixed percentage of your roadmap (e.g., 20%) to tech debt rather than making it compete with new features.
RICE vs other prioritization frameworks
RICE helps you make data-driven decisions, but other prioritization frameworks fit different stages of company growth or solve different problems.
RICE vs. ICE
The ICE model (Impact, Confidence, Ease) removes “Reach.”
- The difference: ICE trades accuracy for speed and ignores cost-benefit analysis. It scores a feature affecting 5 users the same as one affecting 5,000.
- Use when: You need quick scoring for growth hacks. Use RICE to prioritize projects for product strategy.
RICE vs. MoSCoW
MoSCoW categorizes features into Must/Should/Could/Won’t have.
- The difference: It is a bucketing system, not a scoring system. It reduces personal biases through group consensus but lacks nuance and fails when stakeholders label everything a “must-have” without assigning a higher priority.
- Use when: Planning release versioning (e.g., V1.0 launch).
RICE vs. Kano Model
The Kano model classifies features by customer satisfaction (Basic Needs vs. Delighters).
- The difference: Kano helps you make informed decisions about why to build something, but ignores the cost (Effort).
- Use when: Generating ideas. Use RICE to prioritize them.
Avoiding common implementation pitfalls
I have seen teams adopt RICE and still fail. Avoid these specific traps:
1. Beware of confirmation bias
Product managers inflate confidence scores to push pet projects. If you say, “I’ll give this 100% Confidence because I believe it’s a significant improvement,” you have broken the system. Confidence requires evidence, not faith.
2. Exclude bugs and technical debt
Do not apply RICE to software bugs or debt. These items have low direct Reach/Impact and will always lose against new features that require fewer resources in this model, leading to a crumbling infrastructure.
3. Respect technical dependencies
RICE provides a single score anda ranked list, not a build sequence. Feature B might score lower than Feature A, but if Feature A relies on Feature B’s backend architecture, you build B first. Circumstances change when dependencies exist. RICE identifies value; engineering identifies feasibility.
How to prioritize your product roadmap with product analytics
Product analytics turns RICE from a scoring exercise into a decision system. The biggest objection to RICE is “we don’t have the data.” If you guess Reach and Impact, your RICE score is just “guessing with math.” Userpilot provides several benefits here: it tracks how many people interact with each product feature, validates Impact through user feedback, and shows confidence level through trend data.
Use feature tagging
Do not assume 100% of users interact with a feature. You need exact user engagement numbers to calculate accurate reach scores.
In Userpilot, use feature tagging to track clicks without code. Tag any UI element (buttons, links, modals) and Userpilot automatically tracks how many people affected by each interaction. If you want to improve “Export to CSV,” tag the button in Userpilot’s visual builder. If only 50 users clicked it last month, your Reach is 50. The feature is low priority before you even finish the calculation.
Userpilot also lets you segment tagged features by user properties, so you can see if a product feature only serves a small audience versus your entire user base.
Deploy microsurveys
Qualitative data validates Impact scores. If you aren’t sure if a feature haa s significant impact or is just a “nice to have,” ask your target audience directly.
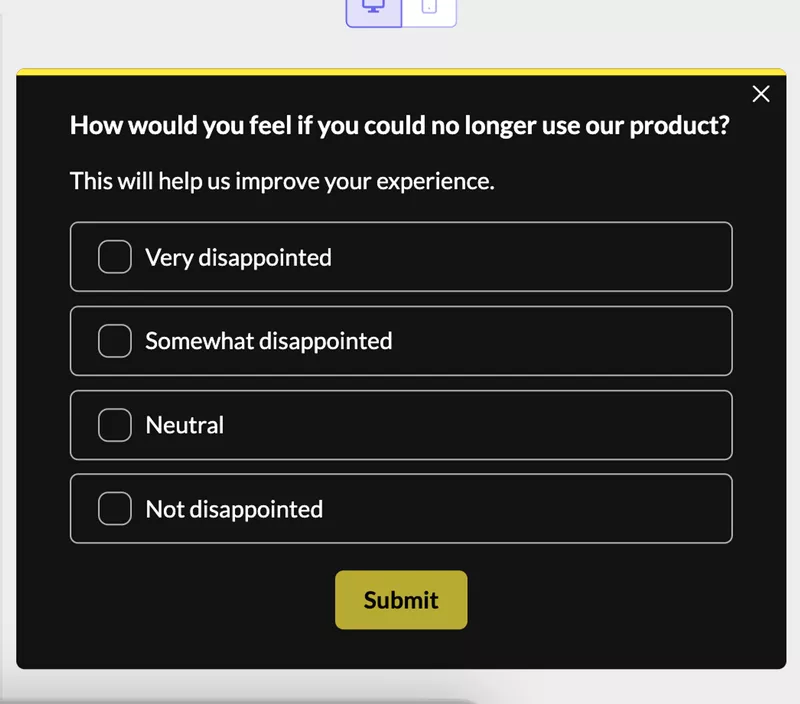
Run a Userpilot microsurvey asking: “How disappointed would you be if this feature was removed?”
- 80% say “Very disappointed”: Impact score is 3 (massive)
- Most say “I wouldn’t care”: Impact score is 0.25 (minimal)
Userpilot lets you trigger surveys based on specific user actions, so you’re asking people who actually used the feature, not your entire user base.
Analyze trends
Use Userpilot’s trend analysis reports to see if a problem is growing based on historical data.
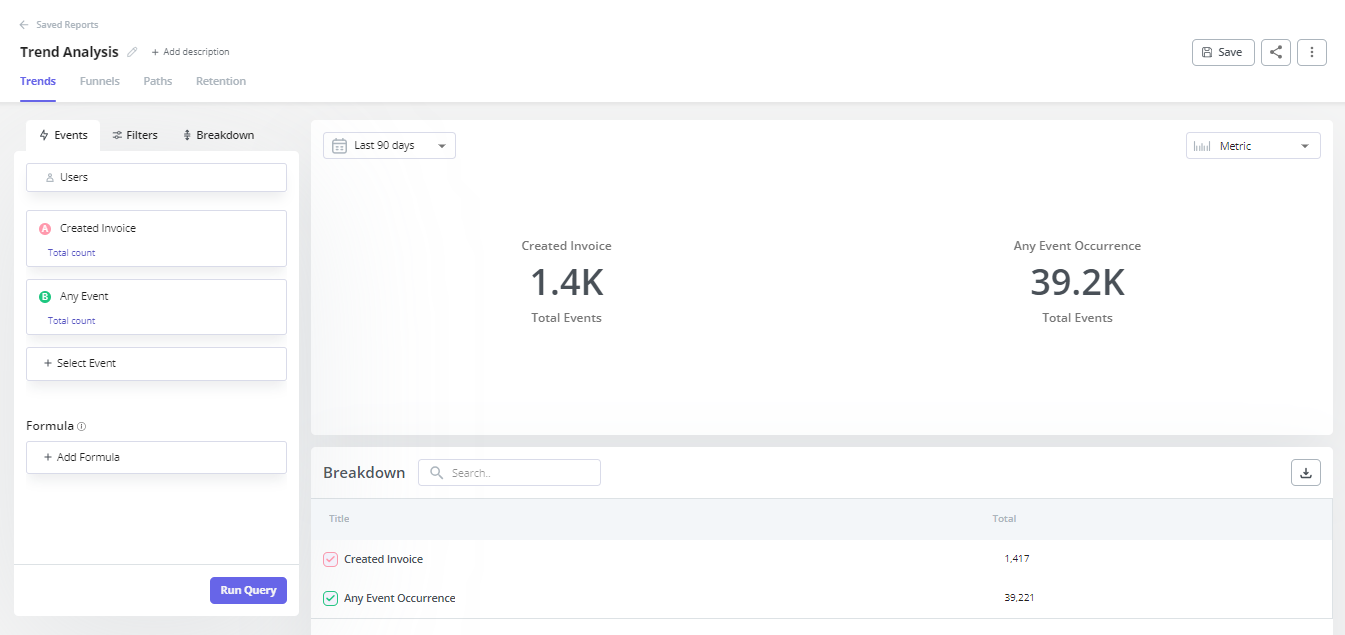
If a drop-off in onboarding is increasing over 90 days, your confidence level that this is a critical problem rises to 100%. If the trend is flat or improving naturally, your confidence in the necessity of a fix drops to 80% or 50%.
Userpilot’s Product Analytics dashboard shows retention curves, feature adoption over time, and funnel conversion trends. All of this informs your Confidence score with actual data instead of guesswork.
Start scoring your roadmap today
Good prioritization requires saying no more often than yes. When a stakeholder asks why their idea isn’t on the roadmap, you can say: “It scores 400 while our current initiatives score 1,500 because they reach 10x more users.” That’s data, not opinion.
The RICE calculator forces trade-offs into the open by balancing reach against resources required and separating impactful projects from vanity features. Score your top 10 features today by pulling Reach from analytics, validating Impact with feedback, and running the calculation.
Book a Userpilot demo to see feature tagging, microsurveys, and trend analysis that make RICE scoring accurate instead of guesswork.
About the author