10 Product Management Metrics for PMs to Track [+ Strategies to Improve KPIs]

![10 Product Management Metrics for PMs to Track [+ Strategies to Improve KPIs] cover](https://blog-static.userpilot.com/blog/wp-content/uploads/2024/09/10-product-management-metrics-for-pms-to-track-strategies-to-improve-kpis_218523150ff7ef0e26da33e632f1ffa6_2000-1024x670.jpg)

As a product manager, you’re constantly juggling multiple priorities, from delivering exceptional user experiences to driving business growth. But without the right product management metrics, it’s easy to lose sight of what truly matters.
You’d be left guessing whether your product is on the right track. And the worst part? Chasing vague or irrelevant metrics can lead to wasted resources, overlooked user needs, and even losing ground to competitors.
This guide aims to help you prevent all that. We’ll explore the 10 most critical product management metrics every PM should track, along with actionable strategies to help you improve your key performance indicators and steer your product toward success.
What are product management metrics?
Product management metrics are performance indicators that let you track growth and measure success.
The ideal metrics are the ones that tie back to your product strategy and help you develop a data-driven approach to meeting customer needs.
Why do product management metrics matter?
Identifying and tracking the right product metrics helps you gain valuable insights into user behavior, measure the impact of product decisions, and prioritize development efforts effectively.
Loom is a great example of this. The company uses “Video First View” (VFV) as a key metric for measuring customer activation. A new customer isn’t considered fully activated until they create their first video—and it gets at least one view within a week of signing up.
The product team tracked this metric for a while and observed a trend: many creators weren’t adding titles, captions, or other descriptive information to their videos. This lack of context led to lower viewer engagement, as viewers had no easy way to assess the value of a video before watching it.
Asking creators to add more details would introduce friction and potentially reduce creator engagement with the platform. So, the team came up with a clever solution: AI features to enhance the video creation process.
Launched in Q3 2023, Loom AI automatically generates video titles, creates summaries, divides videos into chapters for better navigation, and even suggests call-to-actions based on the video’s content.
The impact of this data-driven decision was significant. Within three months of launch, videos created using Loom AI garnered 35 million views, a 37% increase from the previous year.
Without tracking VFV and analyzing the associated user behavior, Loom’s product team might have missed this crucial user need and the opportunity to develop such a valuable solution.
But, of course, product management is broad, and you’d often need more than one metric to understand product health. The next section will cover ten that we’ve found to be the most essential.
10 Key metrics for product managers to track
We’ve categorized these metrics into three core areas:
1. Product usage.
2. Customer satisfaction.
3. Business impact.
Let’s explore each category and the insights they provide.
I. Product usage (Engagement and adoption)
These metrics reveal the frequency of user interactions, which features they use, and how effectively they integrate your product into their workflows.
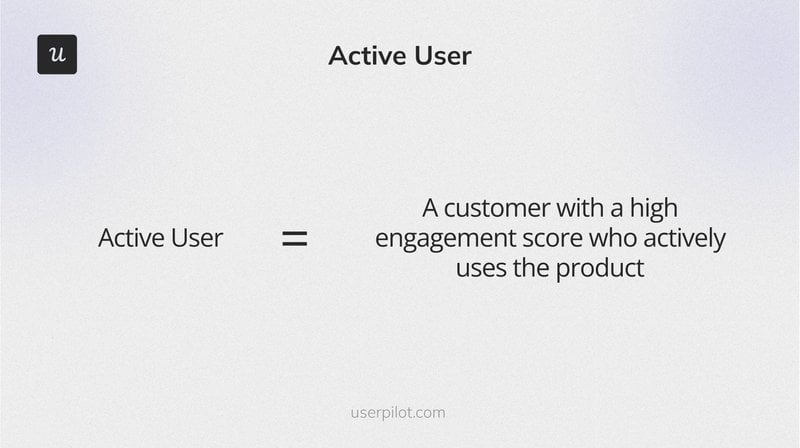
1. Daily/monthly active users (DAU/MAU)
Also known as product stickiness, this ratio tracks the number of users engaging with your platform daily and monthly. You can easily pull this data from your product analytics tool, but you need to first define who an “active user” of your product is, or you risk tracking vanity metrics.
For example, simply logging in is often not sufficient to make someone an active user of a B2B SaaS product. Instead, consider actions that demonstrate actual engagement and value realization. If you’re a CRM, an active user might be someone who creates or updates at least five customer records per week. If you’re a project management tool, your daily active user could be someone who assigns tasks or updates project status at least once daily.
2. Average session duration/Average time spent
This metric tracks the average length of user sessions. It’s calculated by dividing the total time spent across all sessions by the total number of sessions:
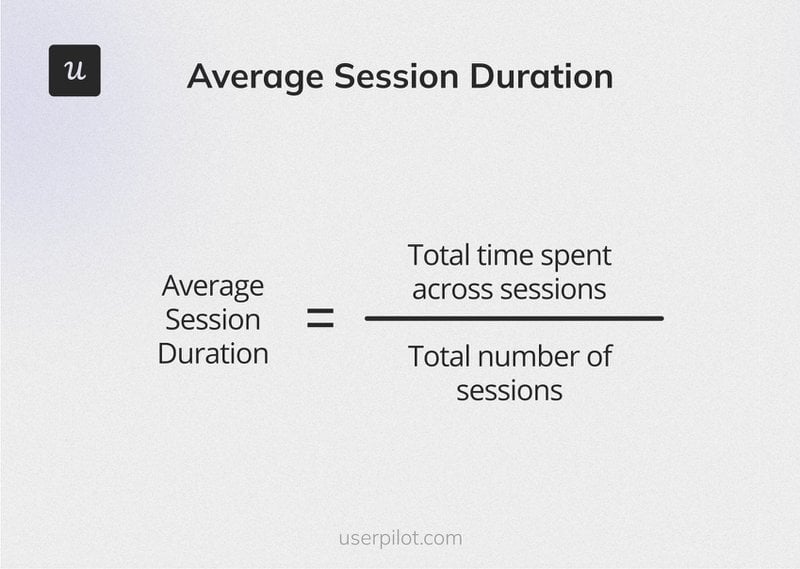
Longer sessions often correlate with higher user engagement and satisfaction, but varying session lengths can be normal, depending on your product’s purpose and how users interact with it.
For example, in a project management tool, sessions focused on planning and task creation might be longer than quick check-in sessions to review progress.
Similarly, users interacting with a complex data analysis tool might have longer sessions than those using a simple note-taking app. It’s important to understand the user’s goal for the specific sessions you’re tracking and what constitutes “typical” behavior within your product.
3. Feature usage (Adoption rate)
The feature usage metric tells you what percentage of your users have adopted and are actively using specific features. It’s calculated by dividing the number of monthly active users for a specific feature by the total number of user logins within the same month and multiplying by 100.
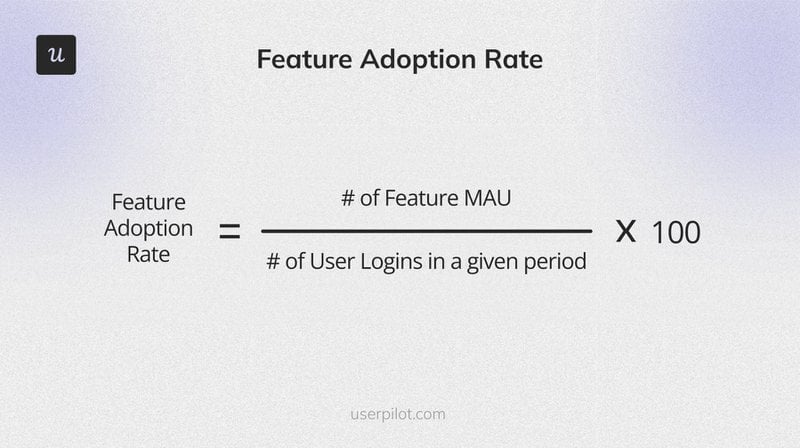
To gain deeper insights, segment your users into various groups (e.g., new vs existing customers) and measure the feature usage rates across each segment. This granular approach makes it easier to understand user workflows, identify underutilized features, and prioritize development efforts based on actual user behavior.
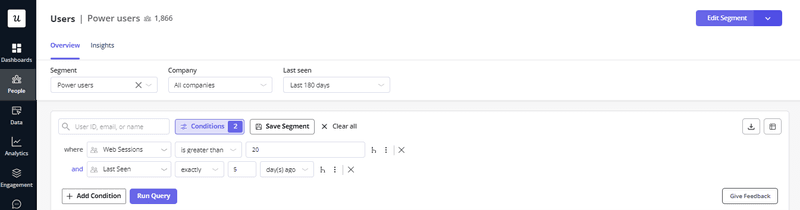
Tools like Userpilot can help you track and analyze feature usage without writing any code. For example, you can use Userpilot to segment power users, understand which features they find most valuable, and then leverage those insights to increase engagement among the rest of your user base.
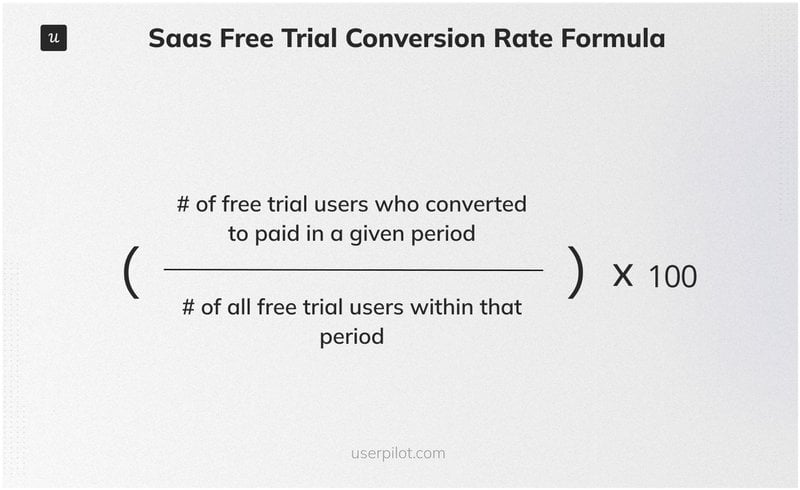
4. Free trial conversion rate
The free trial conversion rate tracks how many free trial users become paying customers. To calculate this metric, divide the number of free trial users who converted to paid within a given period by the total number of free trial users within that period and multiply by 100.
The free trial metric alone doesn’t provide much information. So you know users aren’t converting as you want, but why?
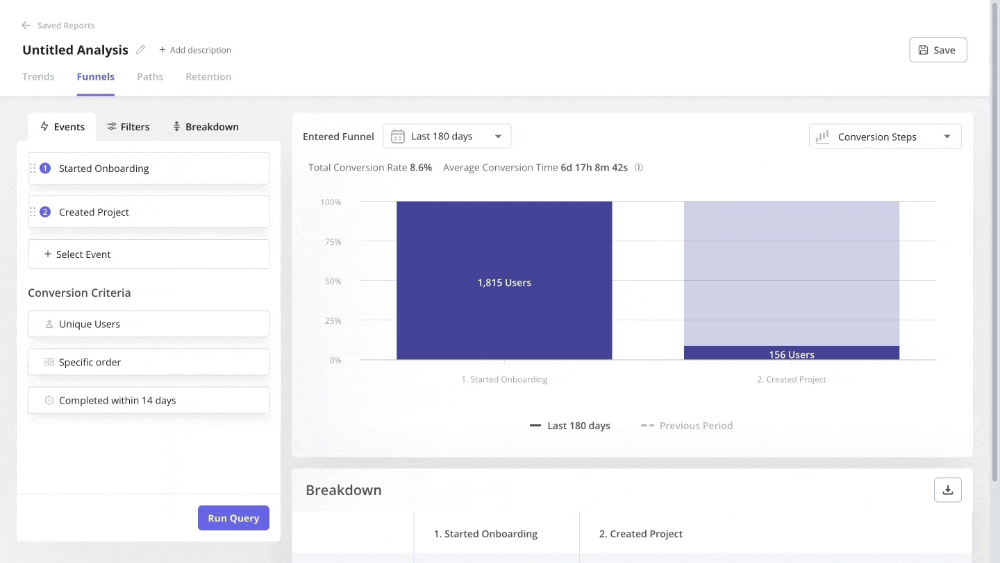
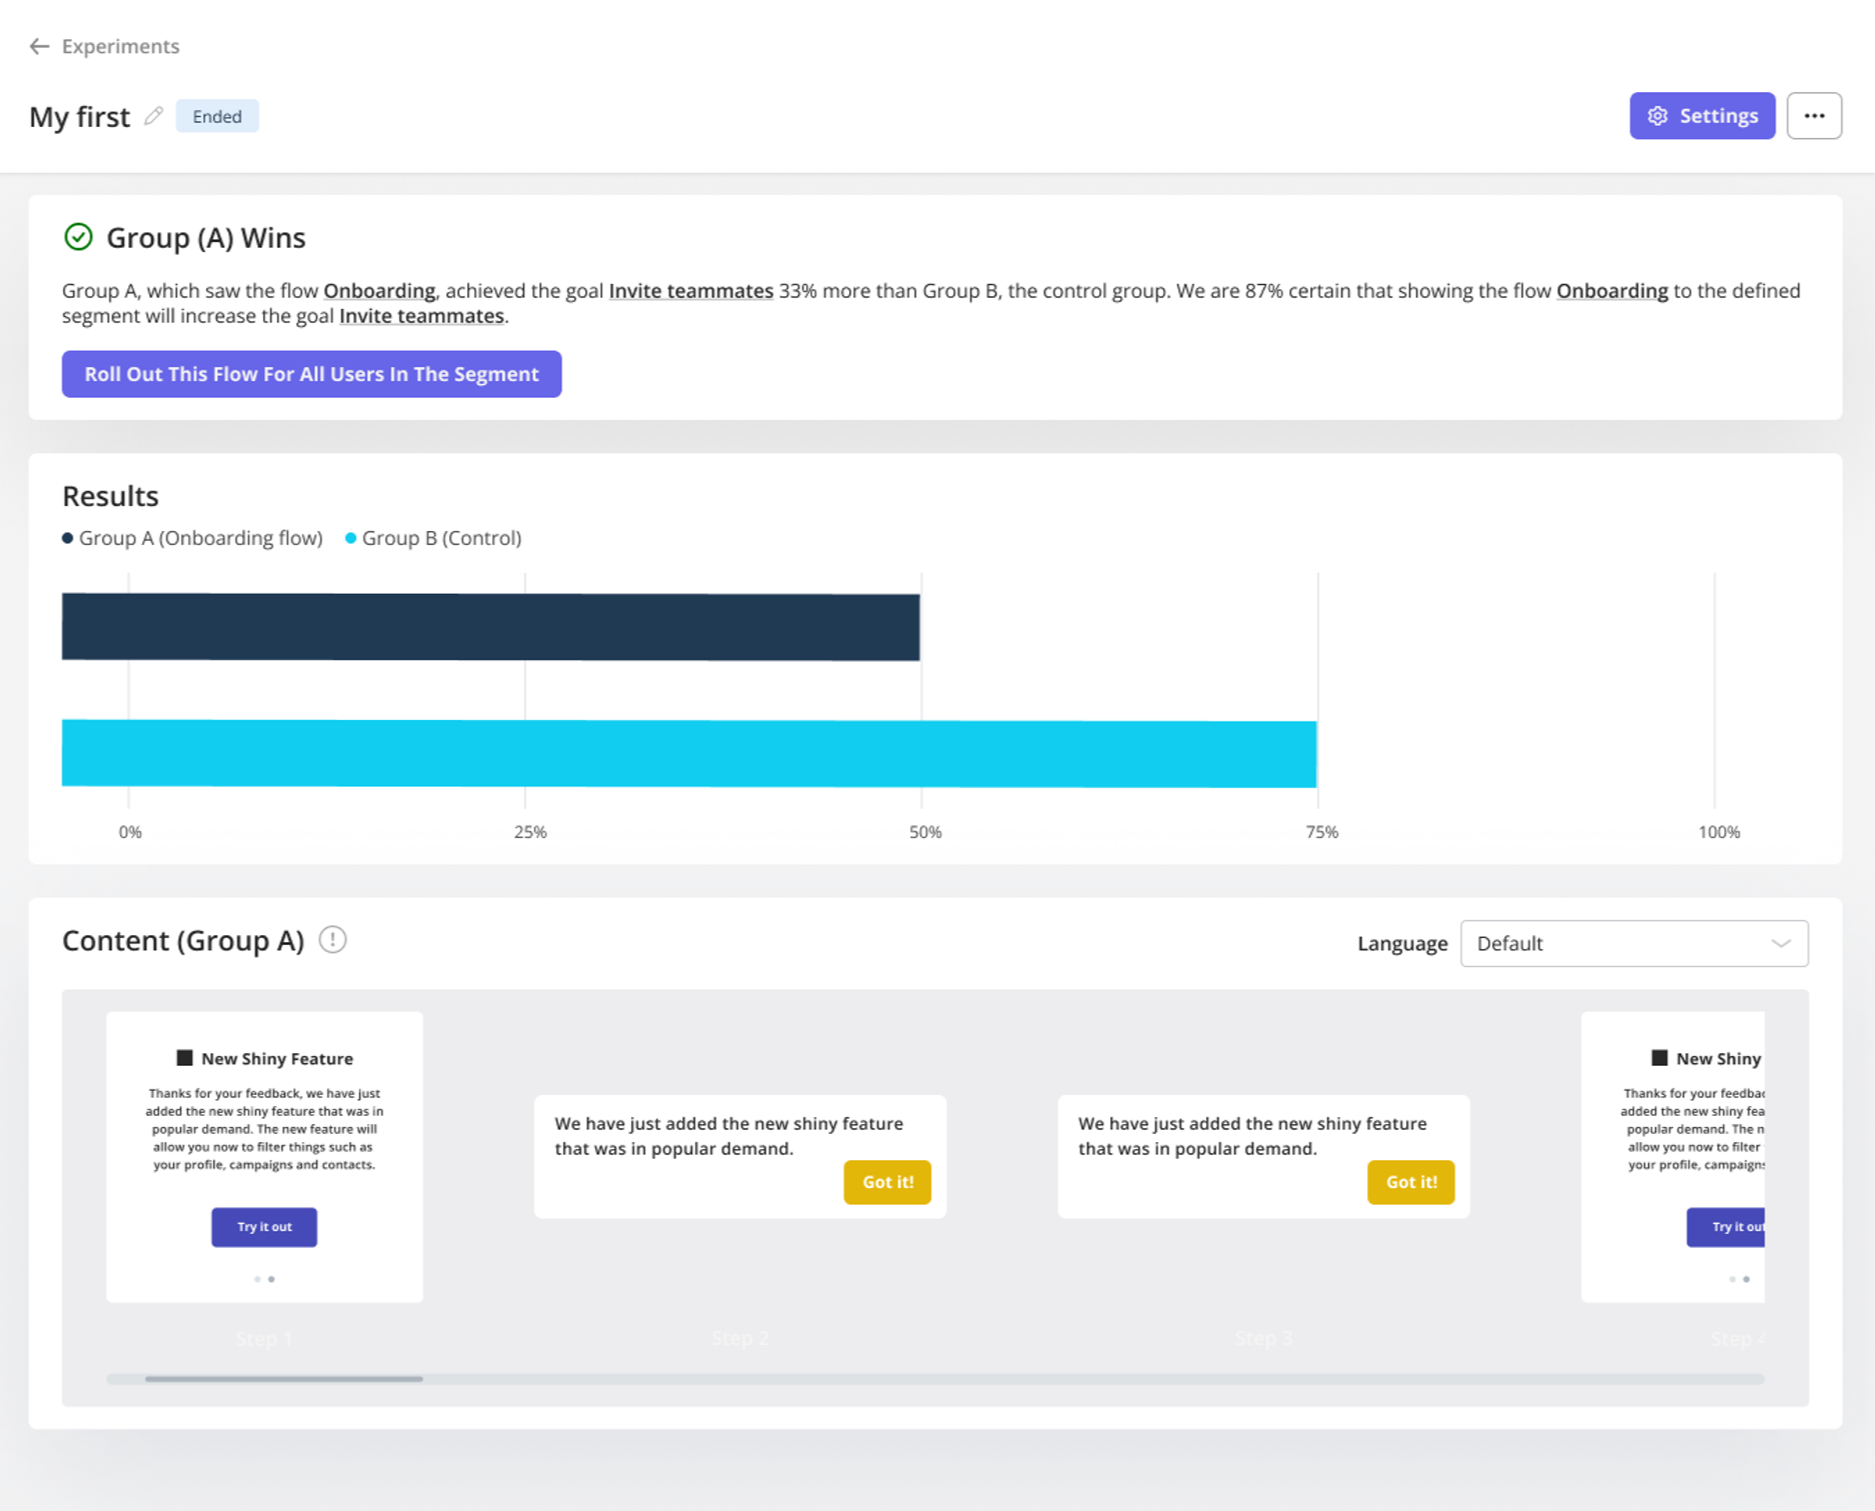
There are two main ways to investigate the underlying reasons. The first is to implement an exit survey that asks users why they’re not upgrading. The second approach is to use funnel analysis to identify friction points in the user journey and areas for optimization.
Userpilot can help you deploy both options. Here’s an example of a funnel analysis conducted with our tool:
II. User satisfaction (Voice of the customer)
Satisfied customers are more likely to become loyal advocates for your product. They stick around longer, spend more, and recommend your product to others. This category focuses on metrics that help you gauge user happiness, loyalty, and overall satisfaction with your product.
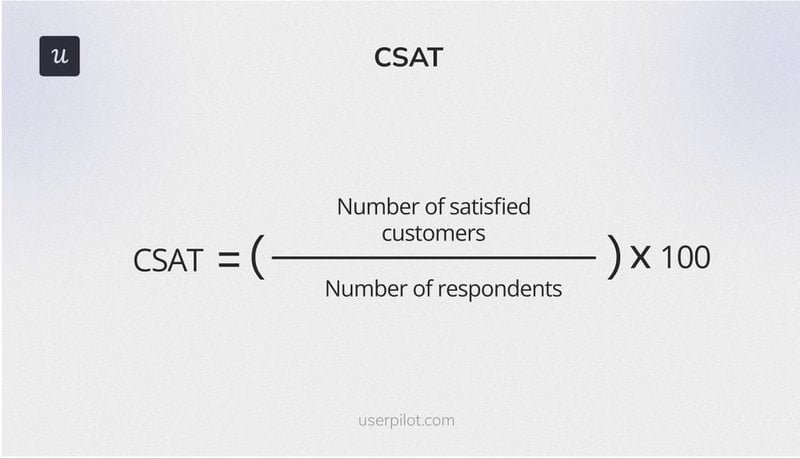
5. Customer satisfaction score (CSAT)
The CSAT score is one of the most popular product management metrics for tracking customer satisfaction. After sending out your CSAT survey, calculate this metric by dividing the number of satisfied users by the total number of respondents and multiplying by 100.
Pro tip: Ask targeted questions to get actionable customer feedback. For example, instead of asking, “How satisfied are you with the product?” ask, “How satisfied are you with the new reporting feature?” or “How easy was it to integrate our product with your existing workflow?”.
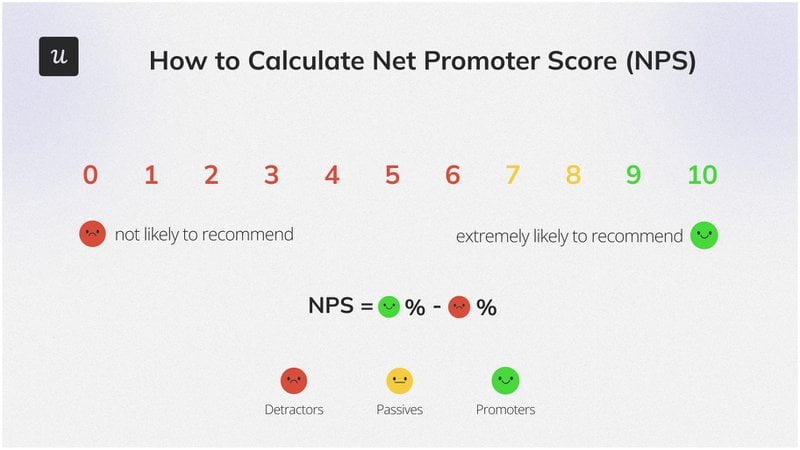
6. Net Promoter Score (NPS)
This metric uses an 11-point survey question to gauge customer loyalty and likelihood to recommend your product. There are three response categories:
- Promoters: Users who respond with a 9 or 10. They love your product and are happy to recommend it to others.
- Passives: These people are on the fence. They enjoy your features but are not sure if they want to recommend you, so they rate you a 7 or 8.
- Detractors: This last category of users are dissatisfied with your product and often on the verge of churn. They rate you anywhere between 0 and 6.
To calculate your Net Promoter Score, subtract the percentage of detractors from the percentage of promoters:
Don’t forget to follow up with detractors, understand their concerns, and see if you can offer tailored solutions. For example, if a detractor is frustrated about a lack of integration with a specific tool, explore if there are any workarounds or alternative solutions you can provide while you consider developing the integration.
7. User reviews and feedback (Qualitative data)
Numbers are great, but they don’t always tell the full story about customer satisfaction and sentiment. Complement your quantitative data with insights from direct customer reviews, support tickets, and social media posts.
You can also trigger contextual in-app surveys that give users room to express themselves.
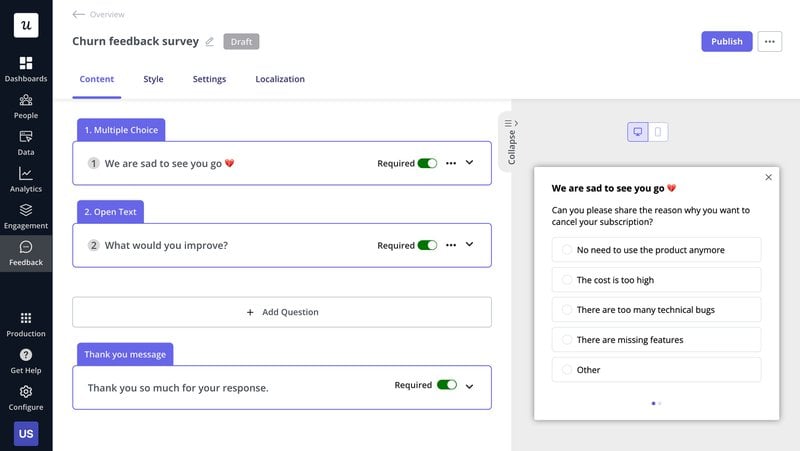
For example, a churn survey with an open-ended question asking, “What would you improve?” helps you gain more actionable insights than one with just a list of options to choose from:
III. Business impact (Revenue and growth)
Ultimately, one of your key roles as a PM is to use data to demonstrate how product decisions contribute to overall business success. This final category covers three product management metrics that can help you do that.
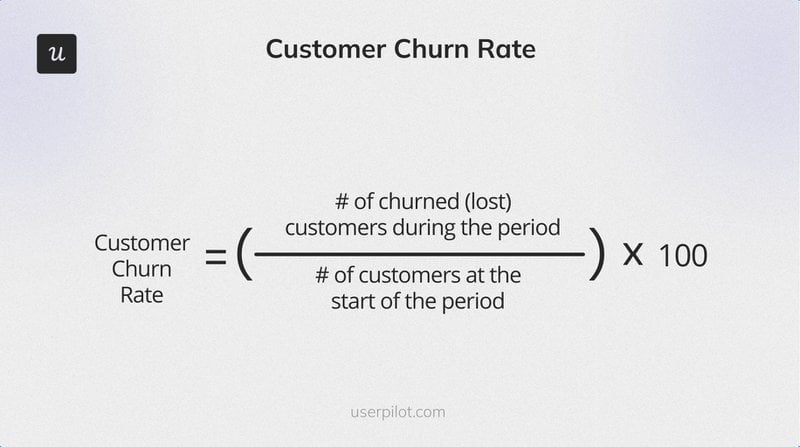
8. Churn rate (Customer retention)
The customer churn rate is the percentage of users who stop using your product after a specific period. To calculate, divide the number of customers lost in a given period by the total number of customers you had at the start of the period. Multiply by 100 to express it as a percentage.
A high churn rate often indicates problems with product value, user experience, pricing, or a combination of these factors. Conversely, low churn (and, therefore, high retention) usually suggests that users are satisfied with the product and your pricing strategy.
When analyzing churn (or customer retention), it’s always best to do so by user segments. This approach makes it easier to identify patterns and develop targeted solutions. For example, you might be experiencing new user churn due to poor onboarding, but without proper segmentation, you could assume the root cause is something else.
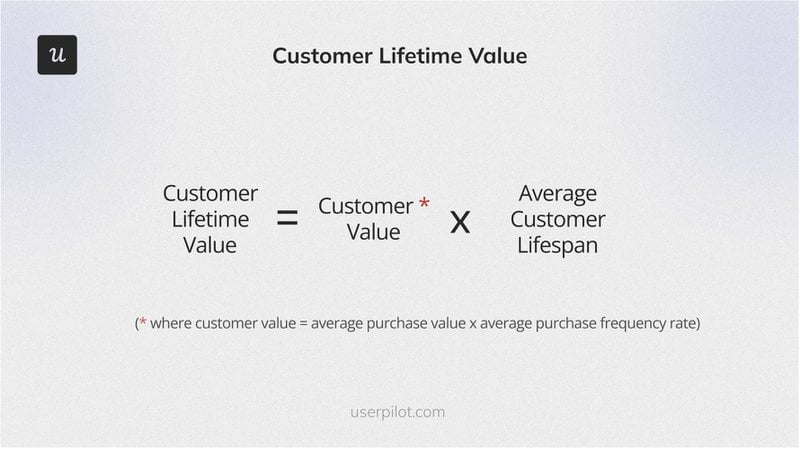
9. Customer lifetime value (CLTV)
Customer lifetime value (CLTV) estimates the total revenue a new customer will generate over the course of their relationship with your business. It helps you understand the long-term value of users and prioritize your acquisition efforts accordingly.
For example, if you find that customers acquired through a specific channel have a higher CLTV, you might allocate more resources to that channel.
CLTV calculations can be complex because every business has a unique approach to revenue generation, so choose a calculation model that works for you. However, one of the most common formulas is to multiply the customer value by the average purchase lifespan:
A closely related metric you might want to track is the LTV:CAC ratio, which compares the customer’s lifetime value to the customer acquisition cost (CAC). Ideally, your LTV should be at least 2-3 times your CAC to ensure profitability and sustainable growth.
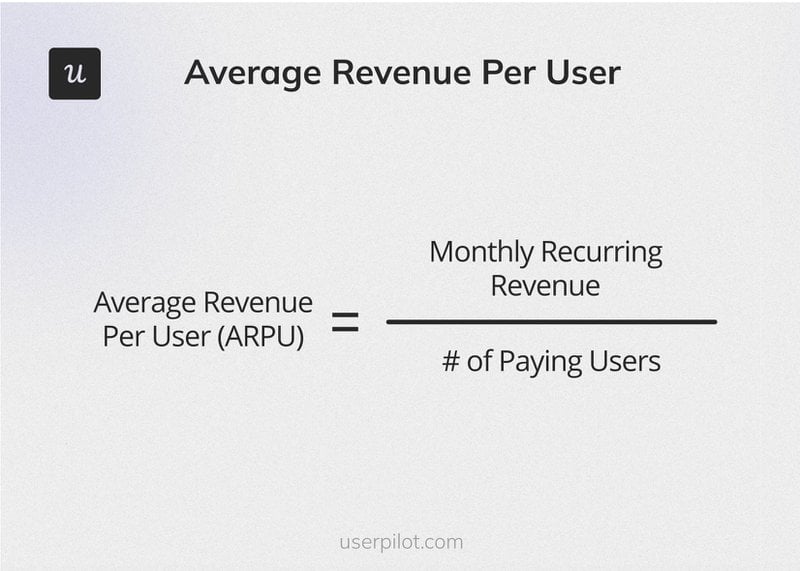
10. Average revenue per user (ARPU)
While CLTV estimates a customer’s total value over their entire relationship with your business, ARPU provides a snapshot of the average revenue generated by your current user base within a specific timeframe.
To compute your monthly ARPU, divide your monthly recurring revenue (MRR) by the total number of paying users:
Pro tip: Segment ARPU to understand how different user groups generate revenue and spread your customer acquisition costs accordingly.
5 Strategies to improve your SaaS product management KPIs
You can gain valuable insights into product performance by tracking and analyzing the metrics we’ve discussed. But what happens next?
Here are five strategies to turn those insights into action and improve your SaaS product management KPIs:
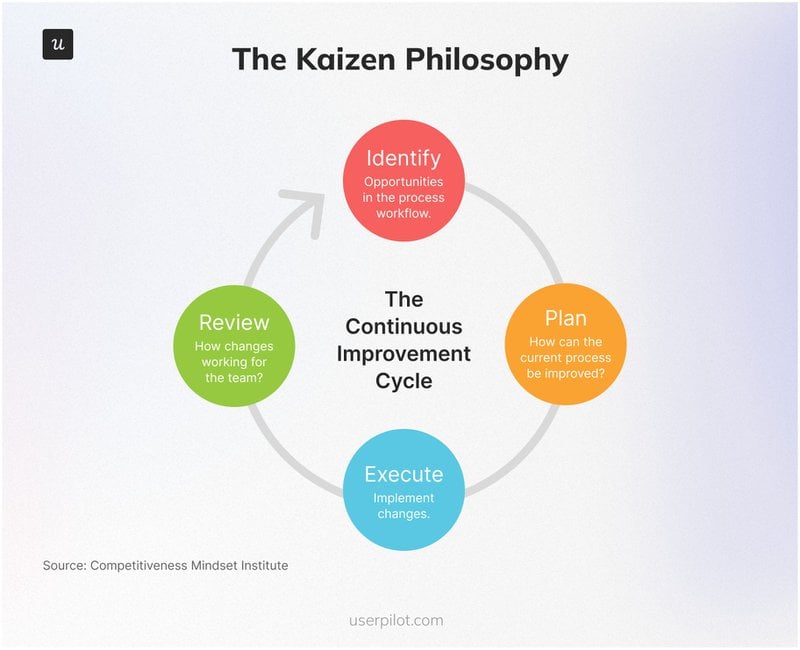
1. Embrace the “Kaizen” mindset
Kaizen is a Japanese term that directly translates as “change for the better” but has come to mean continuous improvement after it was adopted and popularized by Toyota in the post-WWII era.
The idea is that small, incremental changes repeated over time will achieve significant improvements without the resources you would have committed to radical or top-down changes.
How to apply this philosophy to your product management metrics:
- Identify: Choose a specific metric you want to improve. Start with one or two key metrics rather than trying to tackle everything at once.
- Plan: Develop a plan for improving the chosen metric. This might involve A/B testing different approaches, gathering user feedback, or making small changes to the product.
- Execute: Implement your plan and track the impact on the metric. You can use Userpilot to create a custom analytics dashboard that lets you monitor just the data points relevant to your plan.
- Review and celebrate: Regularly review your progress and identify further areas for improvement. Create a “weekly wins” board to publicly celebrate small victories and reinforce the importance of continuous improvement within your team.
2. Focus on cross-team collaboration
Your product team might be working on different aspects of the product, but create a system that breaks silos and makes it easy to collaborate.
Spotify is a popular example of this.
Back in 2012, the company published a paper detailing how it uses “squads” to scale agile developments. Each squad is responsible for a specific feature or area of the product and has all the necessary skills (design, engineering, product management) within the team. A few people from each squad form a “chapter” and meet regularly to discuss challenges, share knowledge, and ensure consistency across the product.
3. Try reverse engineering your product metrics
It’s not always easy to know which metrics to prioritize. A helpful approach is to start with a desired outcome and then work backward to identify the metrics that will contribute to that outcome.
For example, imagine you want to achieve a 20% increase in conversion rate among a specific user segment. Begin by reverse engineering the conversion path for that segment. What steps do users typically take before converting? What actions or behaviors correlate with successful conversions?
You might find that users in that segment are more likely to convert after interacting with certain content or features. This would lead you to focus on metrics related to content consumption and feature usage within that segment.
Pro tip: Balance lagging and leading indicators
Leading indicators are KPIs that predict future performance. For example, website traffic is a leading indicator of sales. Lagging indicators, on the other hand, help you measure past performance. Revenue is a lagging indicator that reflects business growth.
When choosing KPIs, try to create a healthy balance of leading and lagging indicators to gain a comprehensive view of product health.
For instance, if you’re tracking daily active users as a lagging indicator of user engagement, you might also track feature adoption rates or user onboarding completion rates as leading indicators of future product usage and stickiness. This combination helps you understand both current engagement levels and the potential for future growth in product usage.
“Lagging metrics may point out weaknesses but won’t help you act fast enough to progress. That’s the job of leading metrics.” – David Pereira, Product coach and author of Untrapping Product Teams.
4. Use historical data to identify trends and patterns
Leverage historical data to “travel through time” and see how past product changes impacted key metrics. Then, adjust your strategies accordingly.
For example, let’s revisit our goal of boosting conversion rates by 20%. By analyzing historical data, you might discover that a previous onboarding flow redesign led to a 10% increase in conversions for that specific user segment. This insight could suggest that further optimizing the onboarding experience might be a key driver in achieving the desired 20% lift.
Alternatively, you might find that a particular feature release had a negligible impact on conversions for that segment. This could indicate that focusing on other areas, such as content engagement or personalized recommendations, might be more effective in driving conversions.
5. Prioritize based on impact and effort (RICE scoring)
With limited resources and competing priorities, it’s crucial to focus on the initiatives that will have the biggest impact on your product management metrics. The RICE scoring model is a prioritization framework that can help you do just that.
RICE stands for:
- Reach: How many users will be affected by this initiative?
- Impact: How much will this initiative impact key metrics? (e.g., Will it decrease customer acquisition costs by 5% or 20%? Will it increase trial-to-paid conversion rates by 10%?)
- Confidence: How confident are you in your estimates for Reach and Impact? (This is usually scored as a percentage).
- Effort: How much effort will this initiative require from your team? (This can be estimated in person hours, days, or weeks).
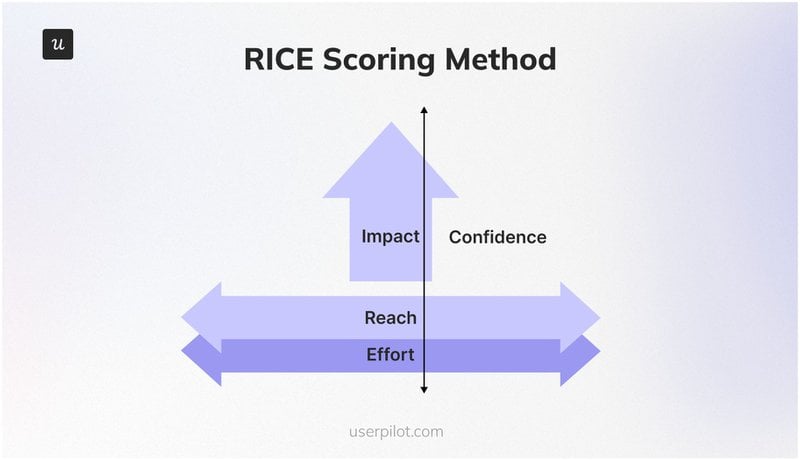
Use this formula to calculate the RICE score for each initiative:
RICE Score = (Reach x Impact x Confidence) / Effort.
Prioritize plans with higher RICE scores and save the rest for later.
Data as the key to product growth
As we’ve seen in this article, a data-driven approach to product management helps you learn from past performance, conduct bold product experiments, and gather insights to drive innovation.
Now that you know what data points to track, the next step is to choose a tool that will simplify the process. This is where Userpilot comes in.
Without writing a line of code, our platform can equip you to measure critical product management metrics, track trends in how these metrics change over time, and deploy contextual in-app experiences to boost user engagement. Book a demo call with our team today to begin!
FAQ
How do I choose the right metrics to track?
Start by defining your product goals and objectives. Then, identify the metrics that will best measure progress toward those goals.
It also helps to consider your product’s development stage (e.g., early-stage vs. mature product) and prioritize the metrics that are most relevant to your current focus. For example, an early-stage product might prioritize activation and engagement metrics, while a mature product might focus more on customer retention and revenue.
What are some best practices for improving product management metrics?
Here are three to keep in mind:
- User feedback integration: Use surveys, in-app feedback forms, and user interviews to gather diverse perspectives and better meet user needs.
- A/B testing: Experiment with different versions of features, designs, or messaging to see what performs best. Userpilot can help do this code-free:
- Iterative development: Release features in small, iterative updates and gather feedback along the way. This allows you to adapt quickly, validate assumptions, and continuously improve your product based on concrete data.
What tools can I use to track product metrics?
There are various tools available to help you track and analyze product metrics, depending on your specific needs and budget. Here are a few categories and examples:
About the author