My Top Picks for SaaS Analytics Software of 2026


As a product manager, a good part of my work revolves around understanding how users interact with products and how those interactions translate into business outcomes. That naturally means I spend a lot of time researching, testing, and working with analytics tools.
Over time, I’ve seen how different tools excel in very different areas. Some are great at deep behavioral analysis. Others help you understand revenue performance. A few focus on turning insights into action inside the product.
In this guide, I’ll share my top SaaS analytics software based on hands-on experience, along with insights drawn from community discussions.
My goal is to give you a practical view of what each tool is best at, so you can quickly decide which one fits your needs without getting lost in feature lists or marketing claims.
What is SaaS analytics?
SaaS companies use SaaS analytics to track customer data across the entire customer journey and make smarter, data-driven decisions.
SaaS analytics helps companies understand user behavior, reduce customer churn, increase user engagement at every touchpoint, and ultimately grow retention rates.
What does SaaS analytics measures?
- Monthly recurring revenue: How much money comes in each month.
- Customer lifetime value: Total money a customer will pay over time.
- Churn rate: How many customers cancel.
- Customer acquisition cost: How much it costs to get a new customer.
Why does SaaS analytics matter?
SaaS analytics helps companies figure out which customers are most valuable, generate predictive insights, anticipate when customers might cancel, and make smart decisions about pricing and product features. It’s essential for growing a healthy subscription business.
The biggest mistake software builders make is treating their app like a traditional website. Standard web analytics tools like Google Analytics focus on how many website visitors you have and which pages they view. That works fine if you sell shoes.
SaaS is different. In software-as-a-service, the sale is just the beginning of the relationship. Your business model relies on recurring revenue, which means you have to deliver continuous value. If you fail, the user cancels their subscription.
To survive, you need product analytics. You need to know what happens after the user logs in. Where do they click? Where do they get stuck? Which features do they ignore?
What types of SaaS analytics software do SaaS companies need?
There’s no one-size-fits-all SaaS analytics platform. Selecting the right analytics tool depends on your specific business needs and the insights you’re seeking.
You can find specific software specialized for uncovering specific data points in the subscription business, including:
- Product analytics tools.
- User behavior analytics tools.
- Growth analytics tools for tracking growth and financial metrics.
SaaS companies need product and user behavior analytics tools to track user journeys, UX issues, and more.
In addition, if you need to measure the financial impact and feasibility of your SaaS business decisions, revenue analytics tools are the ones to go for.
Let’s explore different SaaS analytics tools in more detail:
| Feature | Userpilot | Hotjar | Amplitude | Heap | PostHog | Chargebee | ChartMogul |
|---|---|---|---|---|---|---|---|
| Primary Focus | Product analytics + User engagement | User behavior insights | Product analytics + Experimentation | Autocapture product analytics | Open-source product analytics | Subscription management + Revenue analytics | Revenue analytics |
| Auto-Capture | ✅ Automatic event tracking | ❌ No | ✅ Yes | ✅ Yes (web + mobile) | ✅ Yes | ❌ N/A | ❌ N/A |
| Session Recordings | ✅ Standard feature | ✅ Core feature | ❌ No | ❌ No | ✅ Yes | ❌ N/A | ❌ N/A |
| Funnel Analysis | ✅ Built-in | ❌ No | ✅ Yes | ✅ Yes | ✅ Yes | ❌ N/A | ❌ N/A |
| Cohort Analysis | ✅ Yes | ❌ No | ✅ Yes | ✅ Yes | ✅ Yes | ❌ N/A | ✅ Yes |
| User Segmentation | ✅ Behavior-based | ✅ Basic | ✅ Advanced | ✅ Advanced | ✅ Advanced | ✅ Yes | ✅ Yes |
| Path Analysis | ✅ Yes | ❌ No | ✅ Pathfinder | ✅ Yes | ✅ Yes | ❌ N/A | ❌ N/A |
| Heatmaps | ❌ No | ✅ Clickmaps, Scroll depth | ❌ No | ❌ No | ❌ No | ❌ N/A | ❌ N/A |
| A/B Testing | ✅ Built-in | ❌ No | ✅ Yes | ❌ No | ✅ Yes | ❌ N/A | ❌ N/A |
| Custom Dashboards | ✅ Yes | ✅ Yes | ✅ Yes | ✅ Yes | ✅ Yes | ✅ Yes | ✅ Yes |
| Mobile Analytics | ✅ Cross-channel | ❌ Limited | ✅ Yes | ✅ Yes | ✅ Yes | ❌ No | ❌ No |
| Email Analytics | ✅ Unified cross-channel | ❌ No | ❌ No | ❌ No | ❌ No | ❌ No | ❌ No |
| In-App Messaging | ✅ Core feature | ❌ No | ❌ No | ❌ No | ❌ No | ❌ N/A | ❌ N/A |
| Predictive Analytics | ❌ No | ❌ No | ✅ Yes | ❌ No | ❌ No | ❌ No | ❌ No |
| Retention Analysis | ✅ Yes | ❌ No | ✅ Yes | ✅ Yes | ✅ Yes | ❌ N/A | ✅ Yes |
| Revenue Tracking | ❌ Basic | ❌ No | ❌ No | ❌ No | ❌ No | ✅ Core feature | ✅ Core feature |
| Data Integrations | ✅ Amplitude, Mixpanel, Google Analytics, HubSpot | ✅ Multiple | ✅ Extensive | ✅ Extensive | ✅ Extensive | ✅ Stripe, PayPal, HubSpot | ✅ Stripe, Recurly, Chargebee |
| Learning Curve | 🟢 Easy | 🟢 Easy | 🟡 Moderate | 🟡 Moderate (technical) | 🔴 High (engineering-led) | 🟡 Moderate | 🟢 Easy |
| Best For | Product-led companies | UX optimization | Advanced analytics | Technical teams | Engineering teams | Subscription billing + finance teams | Revenue tracking |
| Target Company Size | SMB to Enterprise | SMB to Mid-market | Enterprise | Mid-market to Enterprise | Startups to Enterprise | SMB to Enterprise | All sizes |
| Pricing | $299/month+ | Free – $32/month+ | Free – Custom | Custom (est. $3,600/year+) | Free – Custom (usage-based) | Custom pricing | Free (<$10K MRR) – Custom |
| Free Plan | ❌ No | ✅ Basic free plan | ✅ Starter plan | ❌ No | ✅ Generous free tier | ❌ No | ✅ Free (<$10K MRR) |
| Implementation Time | 🟢 1 day | 🟢 Quick | 🟡 1–2 weeks | 🟡 Few days | 🔴 Longer (setup-heavy) | 🟡 Few days | 🟢 Quick |
| Technical Expertise Required | 🟢 Low | 🟢 Low | 🟡 Medium | 🔴 High | 🔴 High | 🟡 Medium | 🟢 Low |
Userpilot for turning product analytics insights into in-app action
We built Userpilot for product teams who want to move fast. We make it easy for you to understand what users are doing in the product, spot where they’re getting stuck, and act on insights without filing an engineering ticket.
That means if you’re comparing us to pure analytics tools like Amplitude or Mixpanel, you’ll notice we’re not trying to in-depth them on data modeling. Instead, we focus on closing the gap between insight and action.
Userpilot is the tool you use when you need to answer questions like:
- Where exactly are users dropping off in our onboarding flow, and how do we fix it quickly?
- Which features actually drive activation and retention, and which ones are being ignored?
- How can we segment users based on behavior and trigger the right in-app guidance for each group?
- What changed in user behavior after our last release, and how should we respond to it?
- How do we turn product usage insights into in-app messages, tooltips, or flows that improve adoption?
Amplemarket had a few of these exact questions in mind when they switched to Userpilot.
Before Userpilot, their product team struggled to translate user insights into product decisions. User data was scattered across tools, event tracking depended on engineering, and it could take up to two weeks just to answer a simple product question.
That made it hard to iterate quickly or respond to what users were actually doing inside the product.
Userpilot helped solve that.
Instead of waiting on engineering, the team can now track new events in minutes and immediately use that data to provide contextual in-app guidance, whether that means highlighting a new feature, fixing friction points, or nudging users toward activation.
“The no-code event tracking was a huge ‘aha’ moment for the whole product team. It was almost unbelievable how we could have a new event live in 5–10 minutes without a single line of code.” — Awni Shamah, Staff Product Manager at Amplemarket
They also rely heavily on our session replays to validate what the data is telling them. After each release, the team reviews real user sessions to understand how features are actually used and where users struggle.
“We release a lot of new features and improvements every week. Without a way to see what’s happening with the product, things simply break. Session replays are a huge lifesaver.” — Awni Shamah, Staff Product Manager at Amplemarket
The result? Amplemarket experienced a 10x boost in feature adoption, driven primarily by improved visibility into customer behavior and the ability to trigger in-app experiences code-free.
Userpilot features for SaaS analytics
- No-code event tracking (autocapture + custom events): Track clicks, hovers, form inputs, and feature usage automatically. You can also define custom events that answer specific product questions without any complex setup upfront.
- Cross-platform analytics: Measure behavior across web and mobile apps, and even email engagement triggered from Userpilot. For example, you can see how a user interacts with a feature on your web app, then track whether an onboarding email helped them adopt that same feature later.
- Session replays for qualitative insights: Watch real user sessions to understand how people actually use your product, where they struggle, and what causes friction.
- Flexible analytics dashboards: Choose from pre-built dashboards covering product usage, feature adoption, activation, and retention, or build your own with our funnel, path, trend, and cohort analysis tools. Everything updates in real time, and you don’t need SQL or engineering expertise to get answers.
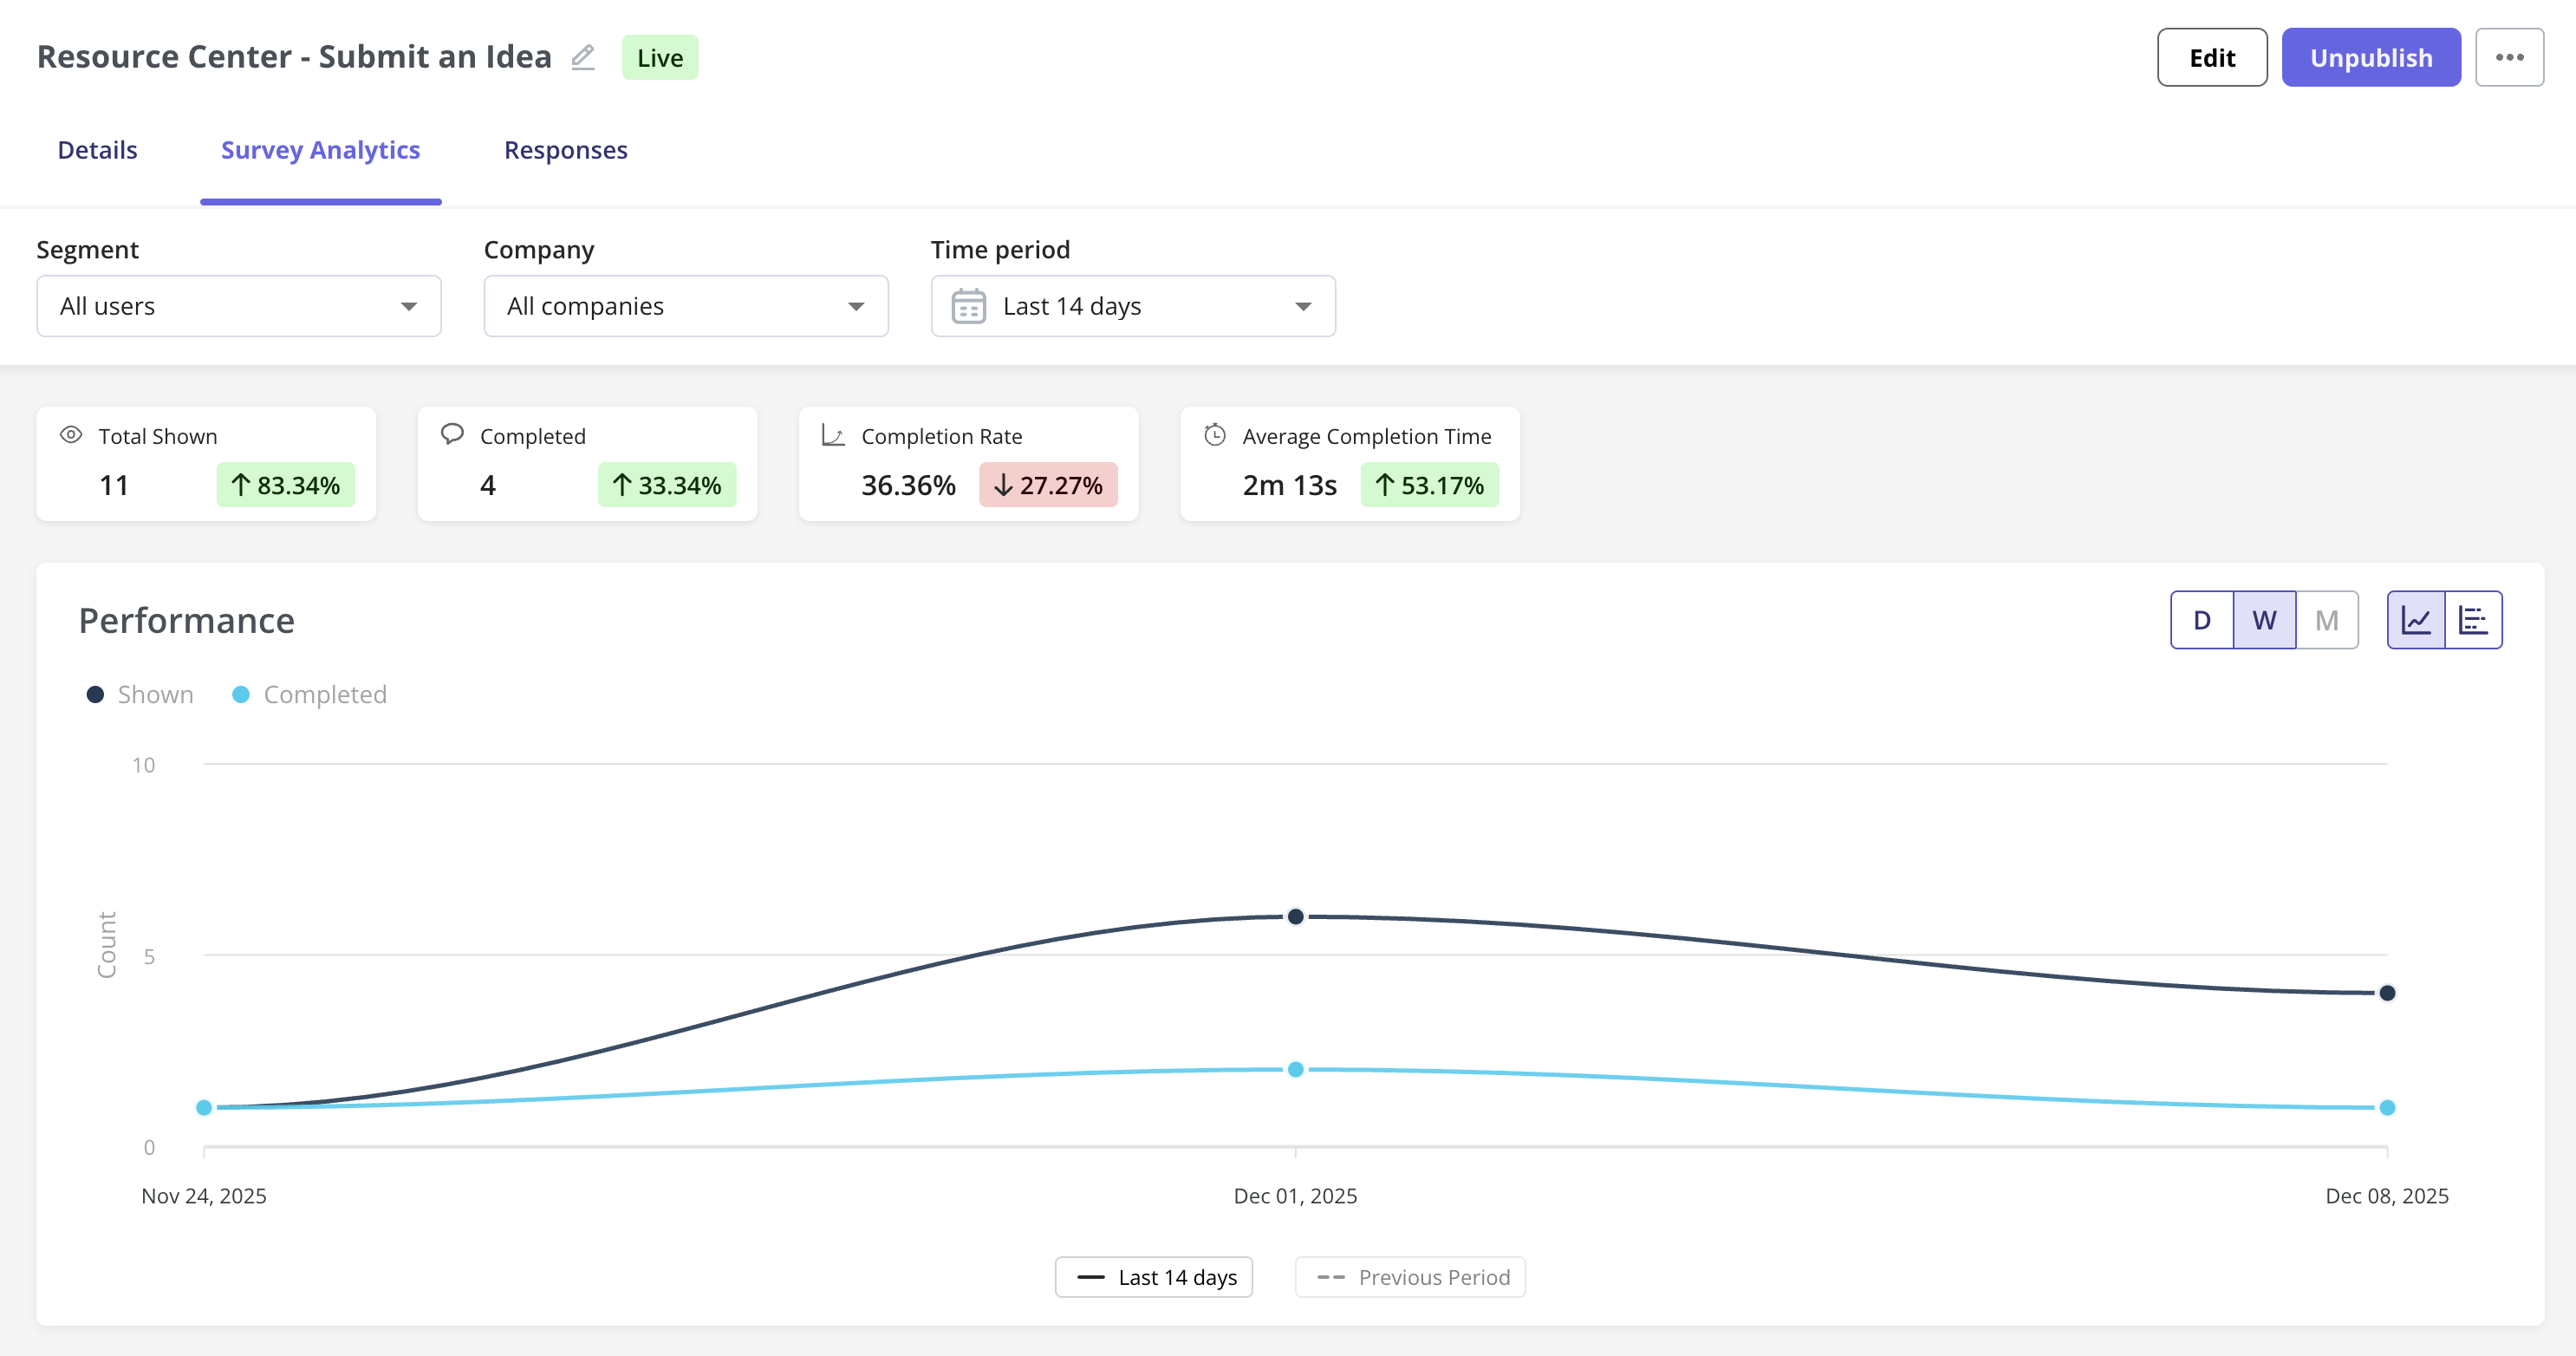
- Integrated feedback analytics: Collect user feedback using NPS, CES, CSAT, or custom surveys, then tie that feedback directly to in-app behavior and understand users better.
While researching for this guide, and even in my own day-to-day work as a PM, one pattern keeps coming up: collecting data isn’t the hard part. Interpreting it and turning it into clear decisions is.
Most tools give you more dashboards, more charts, and more data points, but answering product questions still takes more effort than it should.
This Reddit comment captures it well:

That’s the gap we’re closing with Lia.
Rather than handing you more charts, Lia tells you what actually changed. Think of instances such as notifying you of a drop in activation after a feature release or suggesting that users from Brazil are more likely to convert than from Colombia, the kind of stuff you wouldn’t have thought to look for.

Userpilot pricing
Userpilot’s pricing starts at $299 per month (billed annually) for the Starter plan, with Growth and Enterprise tiers available for larger teams and more advanced use cases.
Userpilot pros and cons
Pros
- The no-code event tracking and in-app experience builder make it easy for non-technical teams to move fast.
- Being an all-in-one platform means teams don’t have to stitch together multiple tools for analytics, engagement, and customer feedback.
- Userpilot’s strong segmentation and targeting let you deliver highly contextual in-app experiences based on real user behavior.
Cons
- The pricing can be a barrier for early-stage teams.
- Advanced features such as customer segmentation and event setup can take time to fully understand.
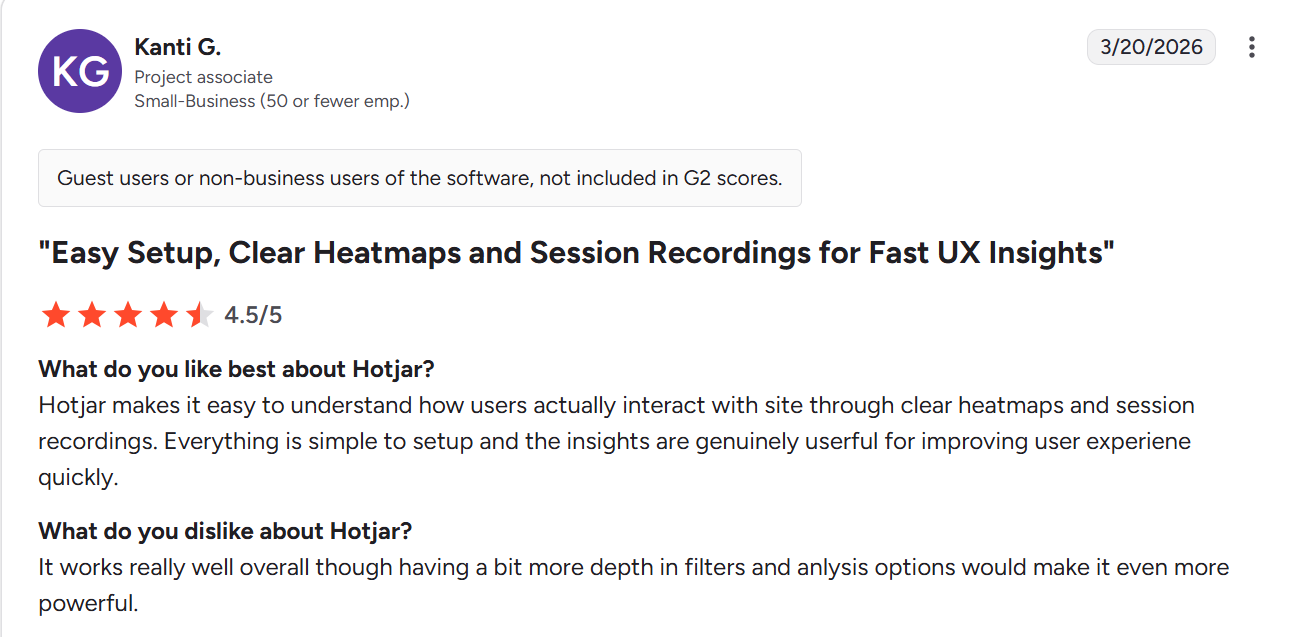
Hotjar for understanding behavioral frictions
Hotjar helps you see how users experience your product in practice. It offers visual tools that show where users click, how far they scroll, and how they move through each page.
It also includes built-in voice of the customer features, so you can collect feedback directly from users and consolidate insights in one place

Hotjar features for SaaS analytics
- Heatmaps and session replays: Understand where users lose momentum, hesitate, or abandon flows by combining aggregated interaction patterns with real session playback.
- Funnels: Track the steps users take toward a goal, such as sign-up or account renewal, and see exactly where they drop off. You can then connect this with session replays to understand the reasons behind those drop-offs and fix them with more confidence.
- User interviews and research panel: Go beyond in-product feedback by running user interviews and recruiting participants through Hotjar’s research panel. You get access to a large pool of users across industries, which is especially useful during early research, validation, or when you need quick qualitative insights without sourcing participants yourself.
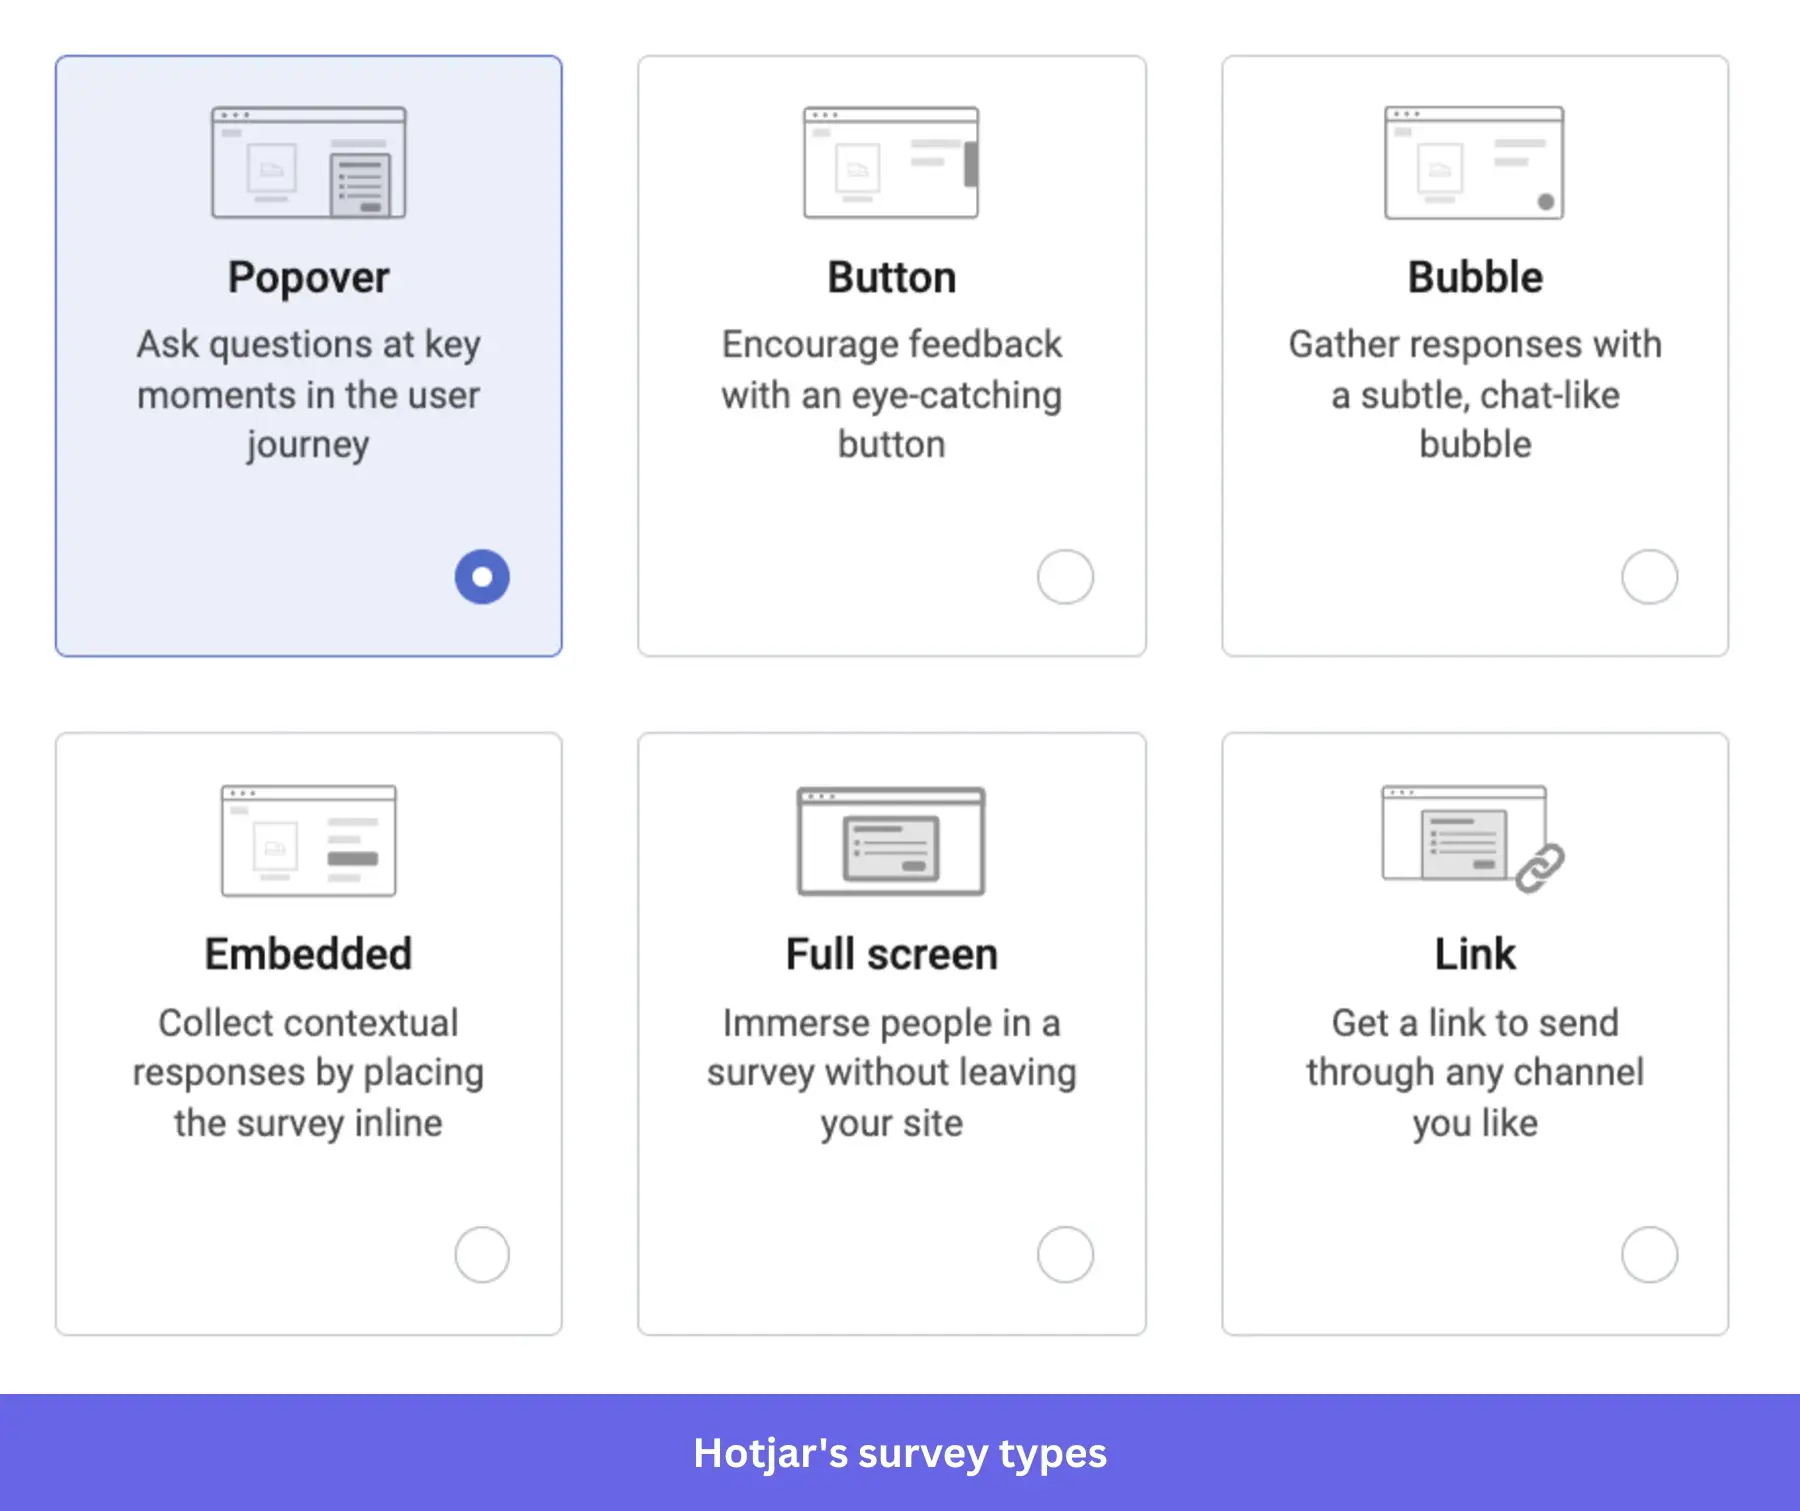
- Surveys and feedback: Create targeted surveys and feedback widgets that appear at key moments, such as when a user is about to leave a page or completes an action. This helps you collect direct input on pain points, expectations, and reasons behind specific behaviors.
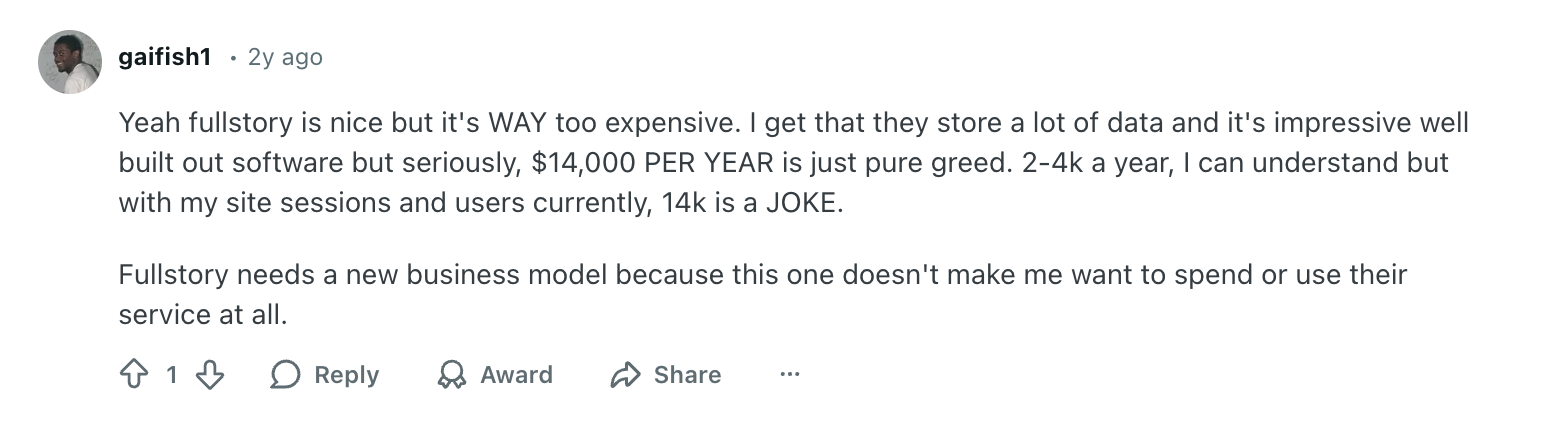
You can also consider FullStory if you’re trying to solve similar problems. It offers comparable capabilities, such as session replays, rage-click detection, and behavioral analysis.
The main difference comes down to pricing and positioning. FullStory is typically geared toward larger teams and is significantly more expensive, with limited transparency around pricing.
This sentiment comes up often in community discussions:
It is also worth noting that FullStory goes deeper into technical analysis. While Hotjar focuses on helping you understand behavior from a UX perspective, FullStory lets you index every user activity and debug issues at scale. For example, it includes developer tools like Console and Network views to diagnose why something failed during a session. It also supports both web and native mobile apps, whereas Hotjar is primarily web-focused.
Hotjar pricing
Hotjar offers a free plan with up to 200K monthly sessions, though only 5% of those sessions are captured for replays (capped at 10K). Paid plans start at $39/month for the Growth tier, while Pro and Enterprise plans are custom-priced.
(Pricing details are now listed under Contentsquare, its parent company.)
Hotjar pros and cons
Pros
- Easy to set up and use, even for non-technical teams.
- Free plan available, which makes it accessible for smaller teams or early-stage products.
- Heatmaps and session replays provide clear, visual insight into user and web visitor behavior that most SaaS analytics tools miss.
Cons
- Limited depth for advanced analytics compared to tools like Amplitude or Mixpanel.
- Filtering and analyzing large volumes of recordings can be difficult and time-consuming.
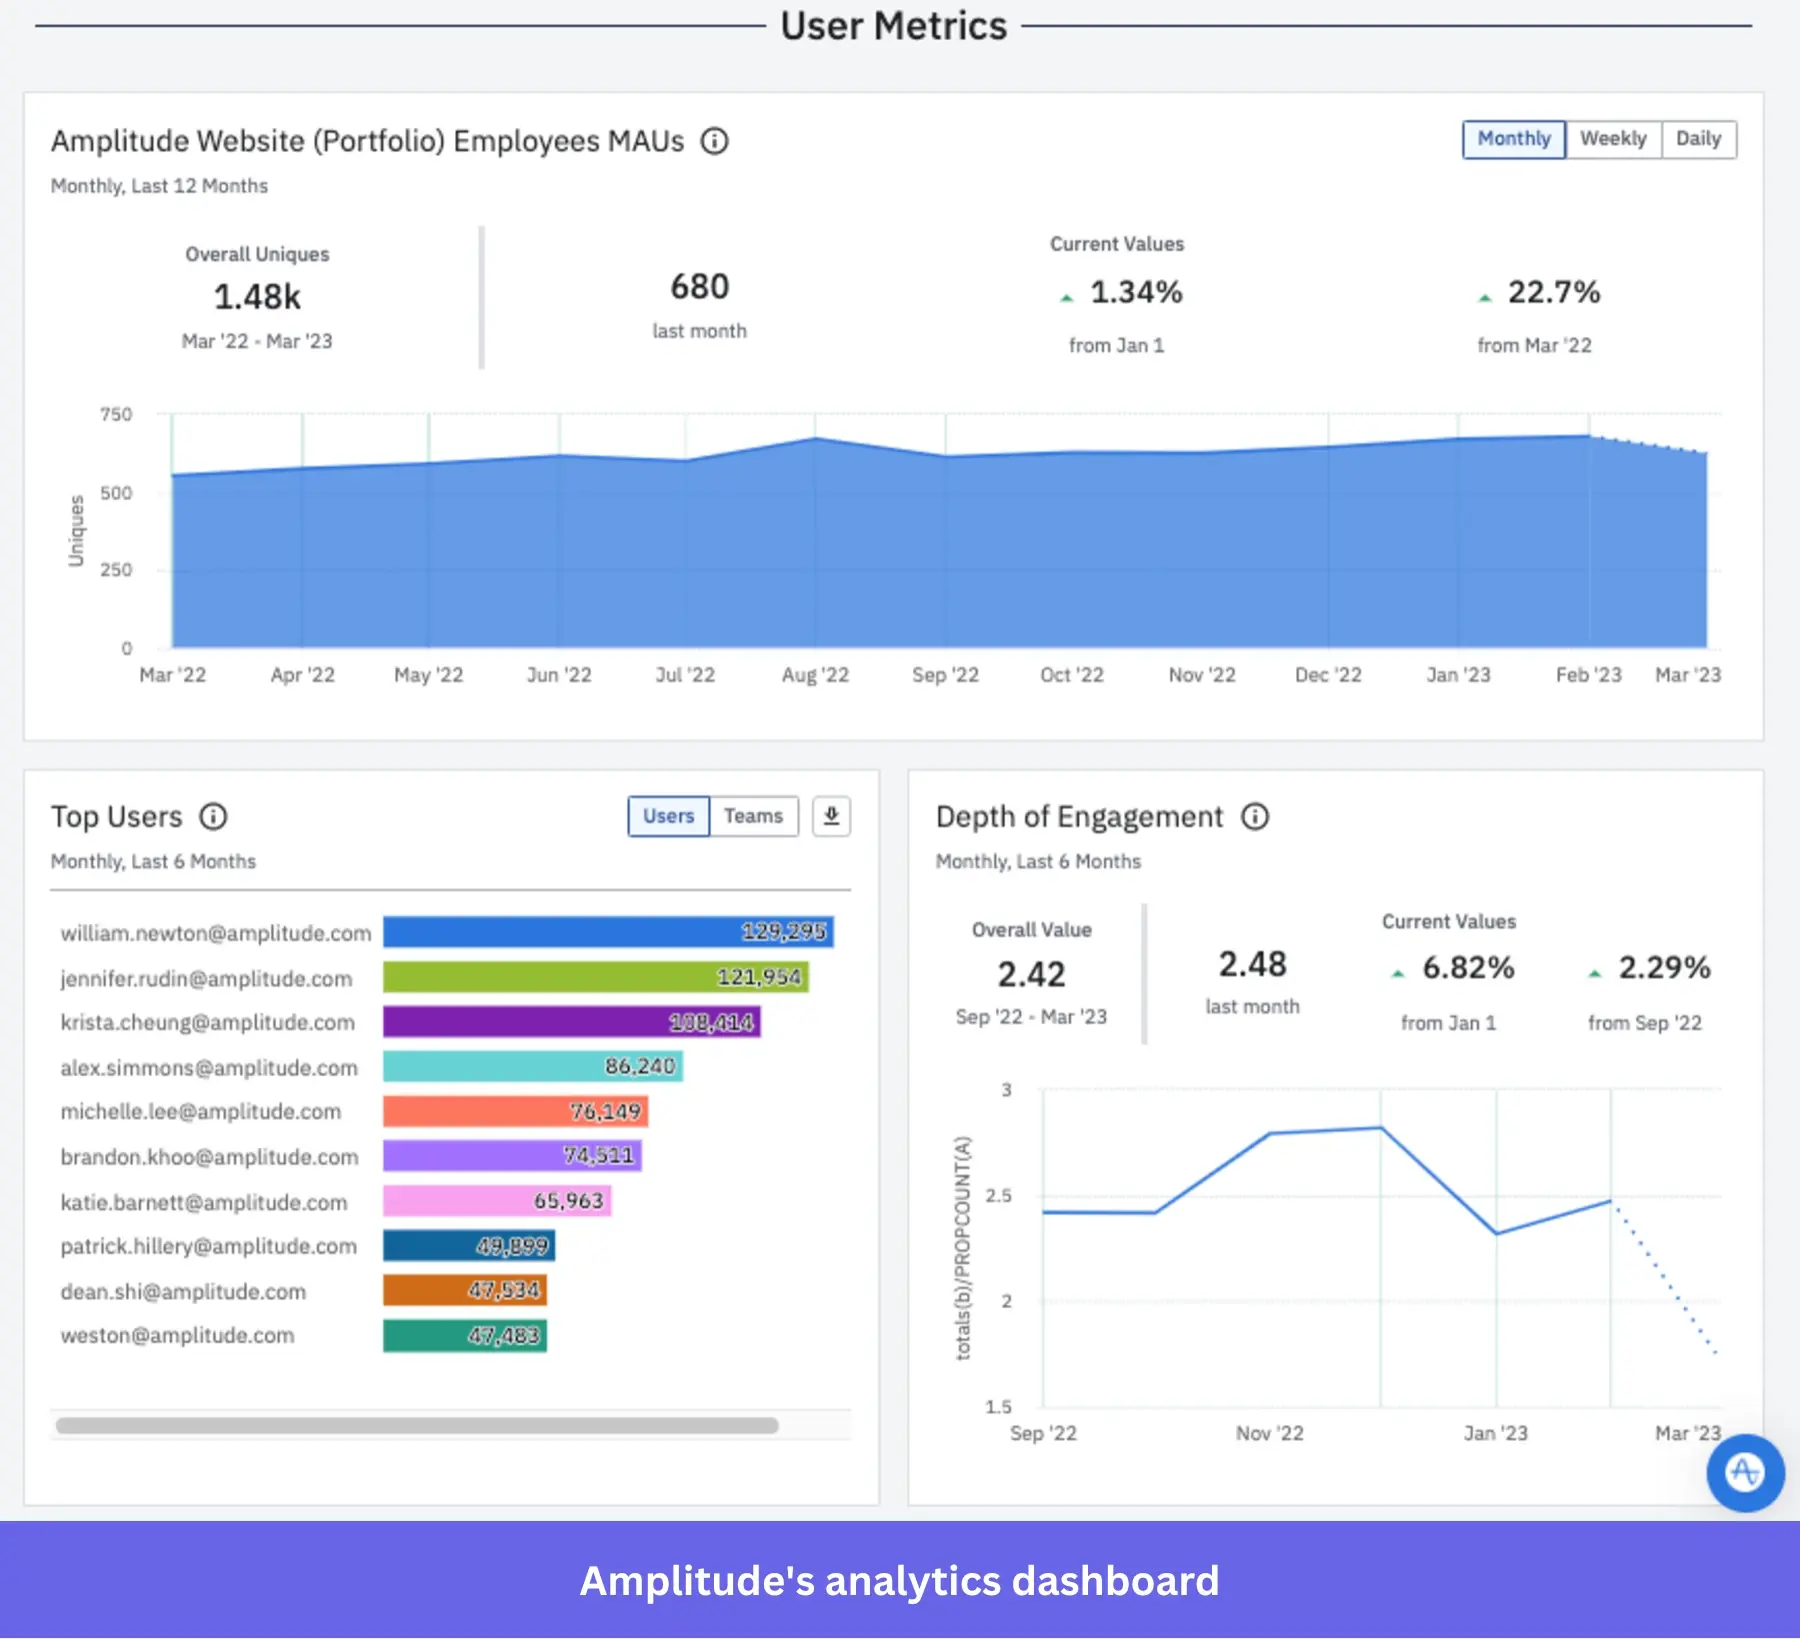
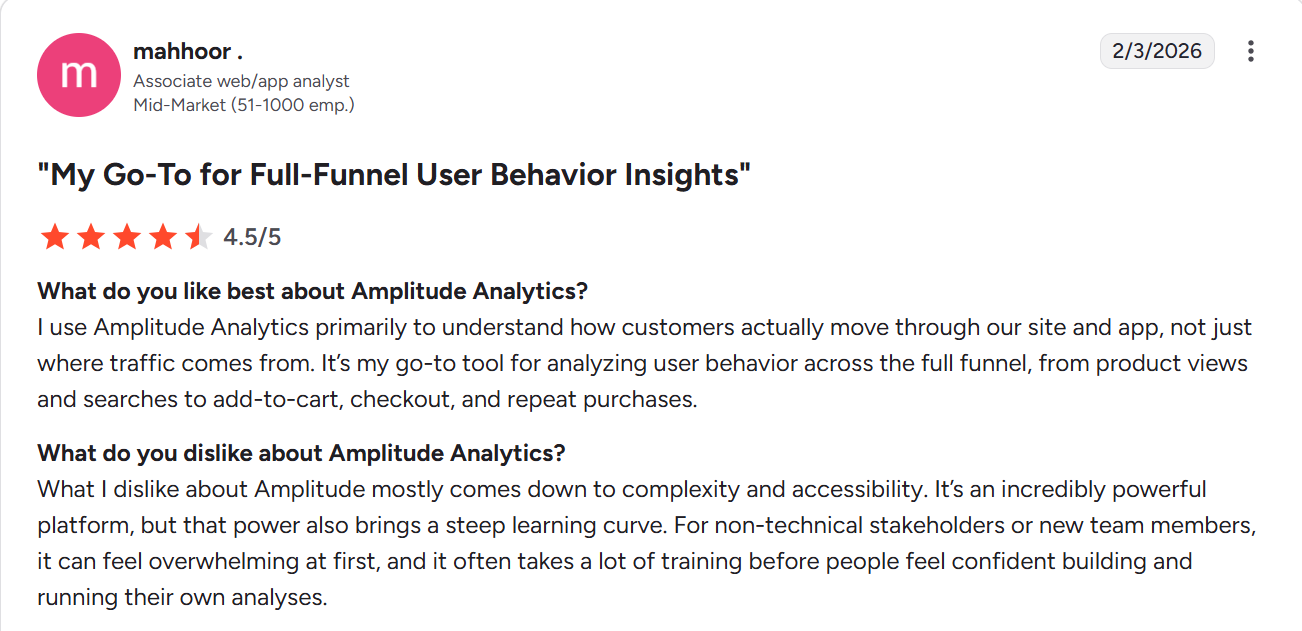
Amplitude for complex analytics and feature experimentation
Amplitude gives product teams a structured way to analyze behavior, model product usage, and run experiments at scale.
It’s particularly useful when you need precise answers about how features perform and how different user segments respond to changes.
Amplitude features for SaaS analytics
- Advanced event-based analytics: Track user behavior at a granular level using event data, then break it down across user properties, segments, timeframes, and different data sources to understand what drives key outcomes.
- Funnel and path analysis: Analyze how users move through flows and identify where they drop off. Path analysis also helps you uncover unexpected user journeys and behavioral patterns.
- Cohort and retention analysis: Group users by shared behaviors, track how engagement changes over time, and identify what drives long-term retention.
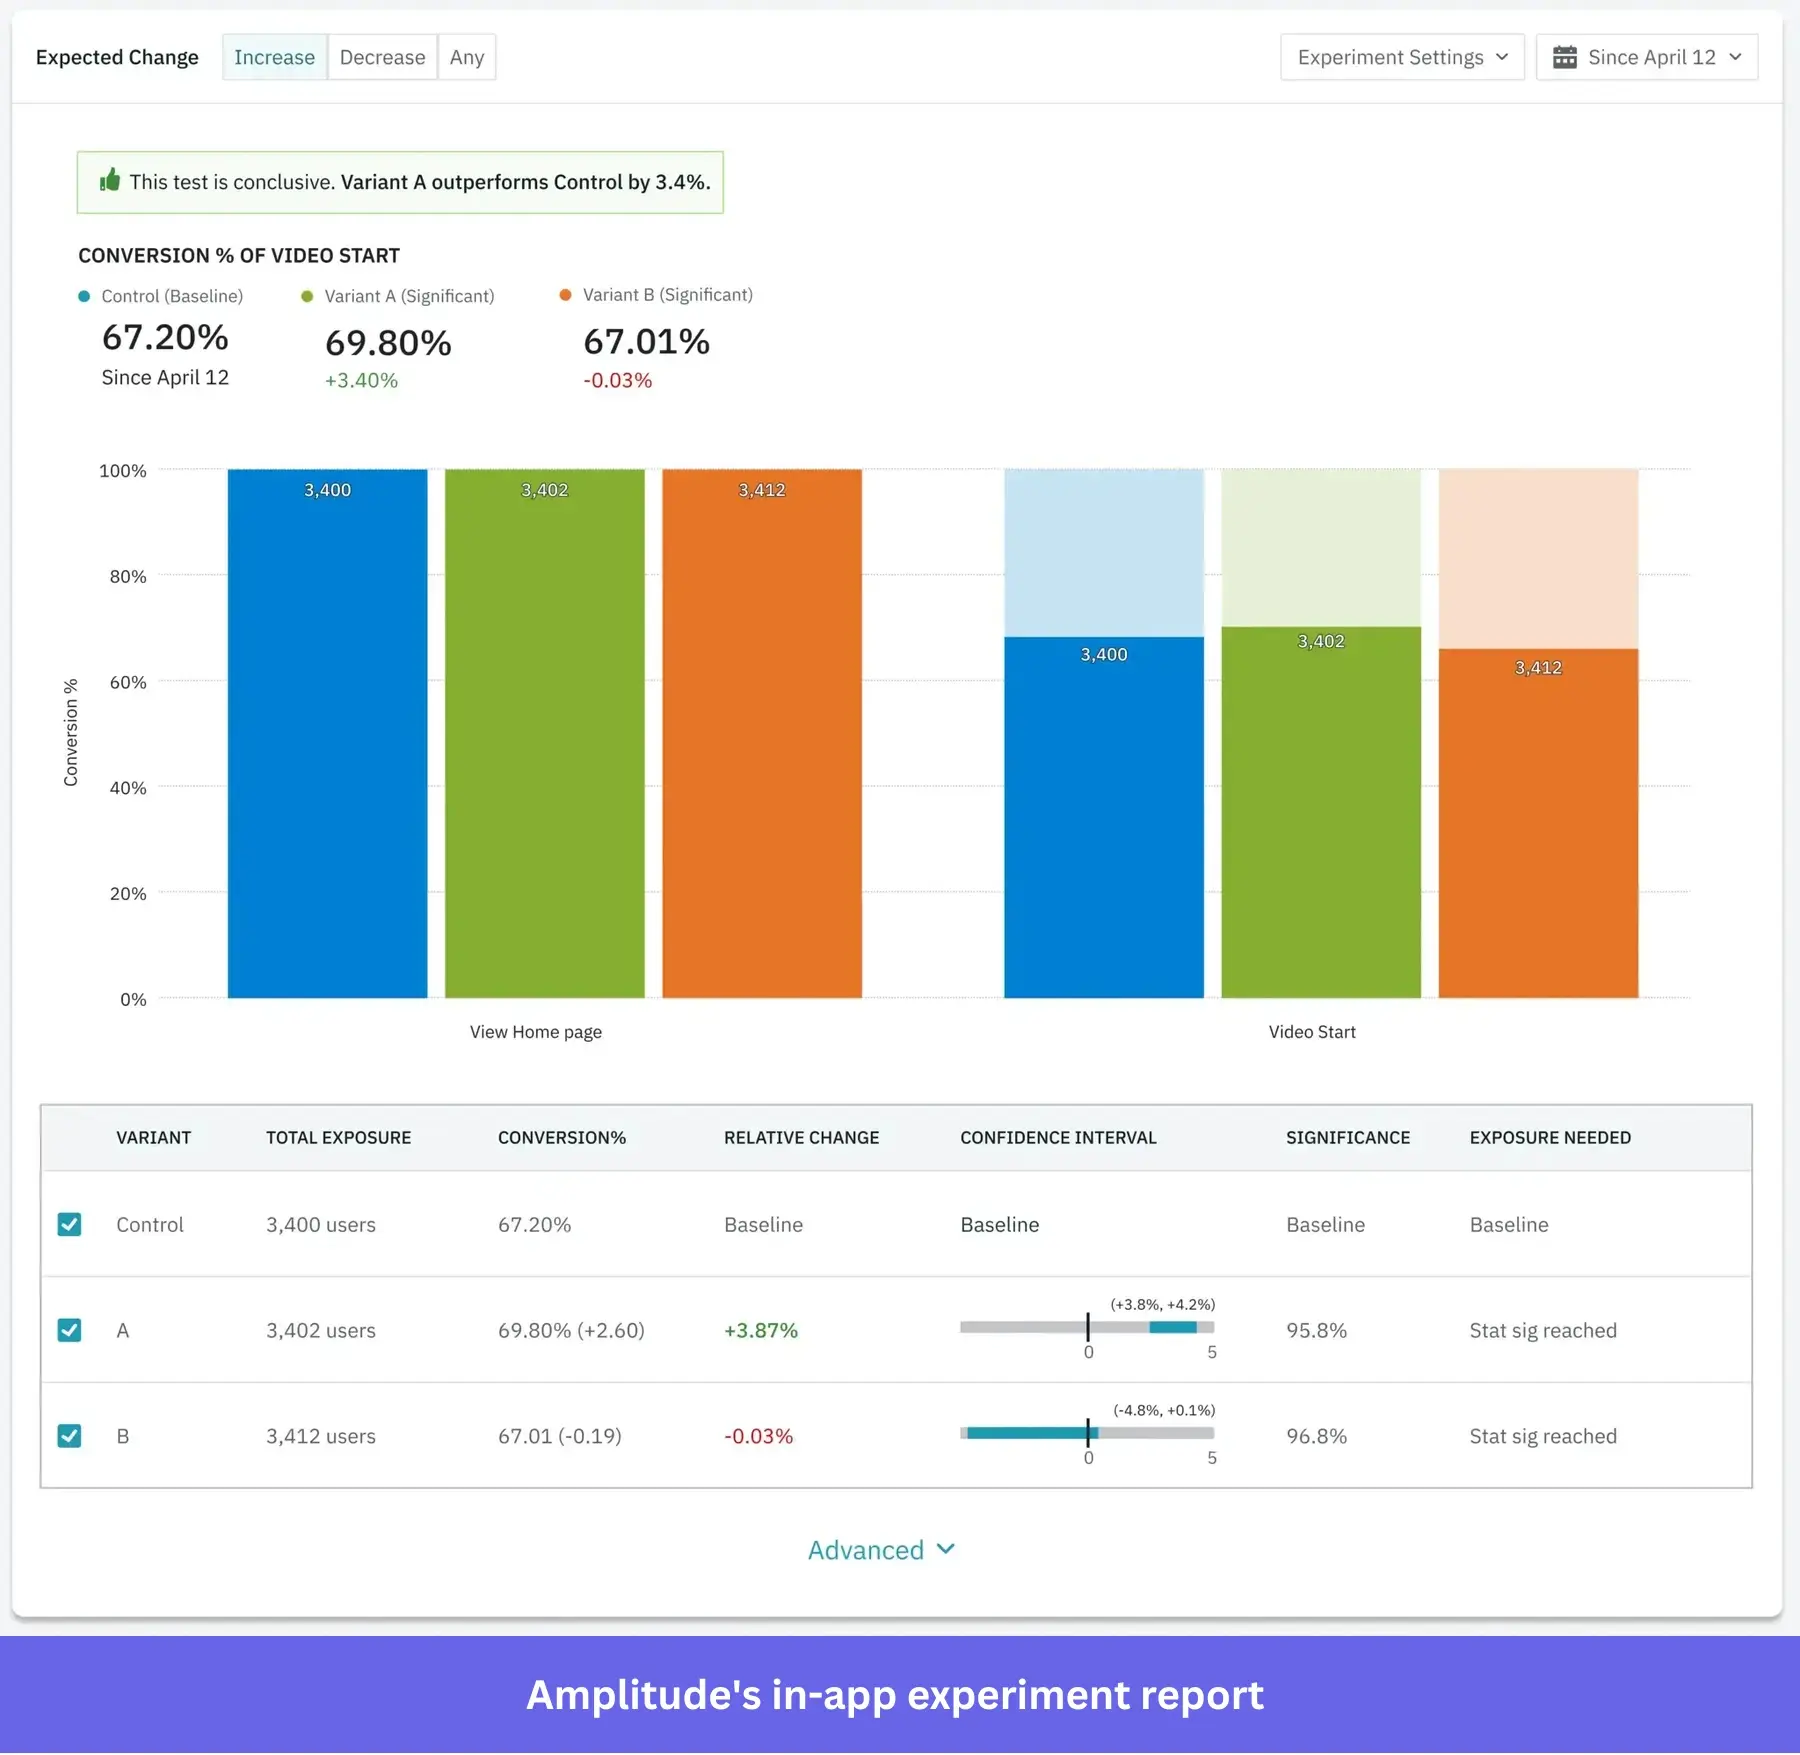
- Feature experimentation: Run A/B tests and measure the impact of product changes directly within the platform, so you can validate ideas before rolling them out broadly.
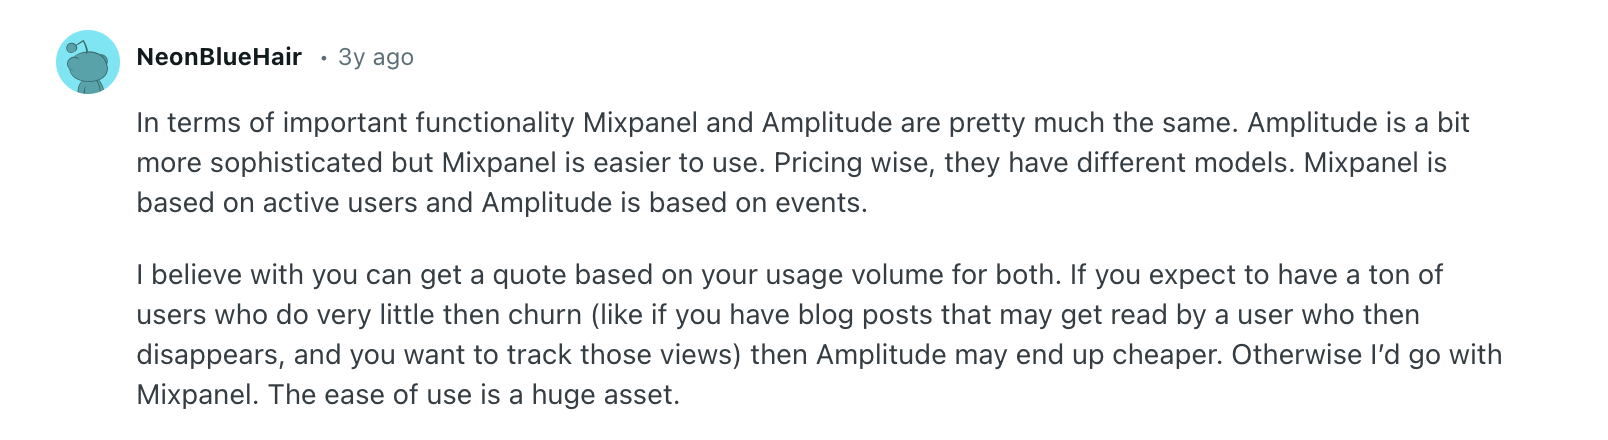
You might notice I didn’t include Mixpanel in this list, even though it’s often mentioned alongside Amplitude. That’s because both tools serve a very similar purpose.
In my experience, Amplitude tends to be the more powerful option, especially if your goal is advanced behavioral analysis and native feature experimentation.
I’m not alone in that view. Many users who’ve worked with both platforms point to the same distinction:
That said, there’s an important trade-off: Amplitude comes with a steeper learning curve and often requires a certain level of technical or engineering support to use effectively:

Its interface and query logic are designed for data-heavy teams, which makes it better suited for organizations with strong data governance and dedicated analysts.
For early-stage teams or companies without that setup, it’s worth considering Amplitude alternatives that offer a more approachable learning curve for non-technical stakeholders.
Amplitude pricing
Amplitude offers a free Starter plan with limited usage, while paid plans start at $49/month for the Plus tier. Growth and Enterprise plans are custom-priced based on usage and feature requirements.
Amplitude pros and cons
Pros
- Built-in product experimentation makes it easy to test features and quickly measure their impact.
- Scales well for large datasets and complex product analytics use cases.
- Amplitude’s flexible dashboards and reporting enable teams to explore data from multiple angles.
Cons
- Steep learning curve, especially for non-technical teams or those new to event-based analytics.
- Requires proper data instrumentation and governance to get meaningful insights.
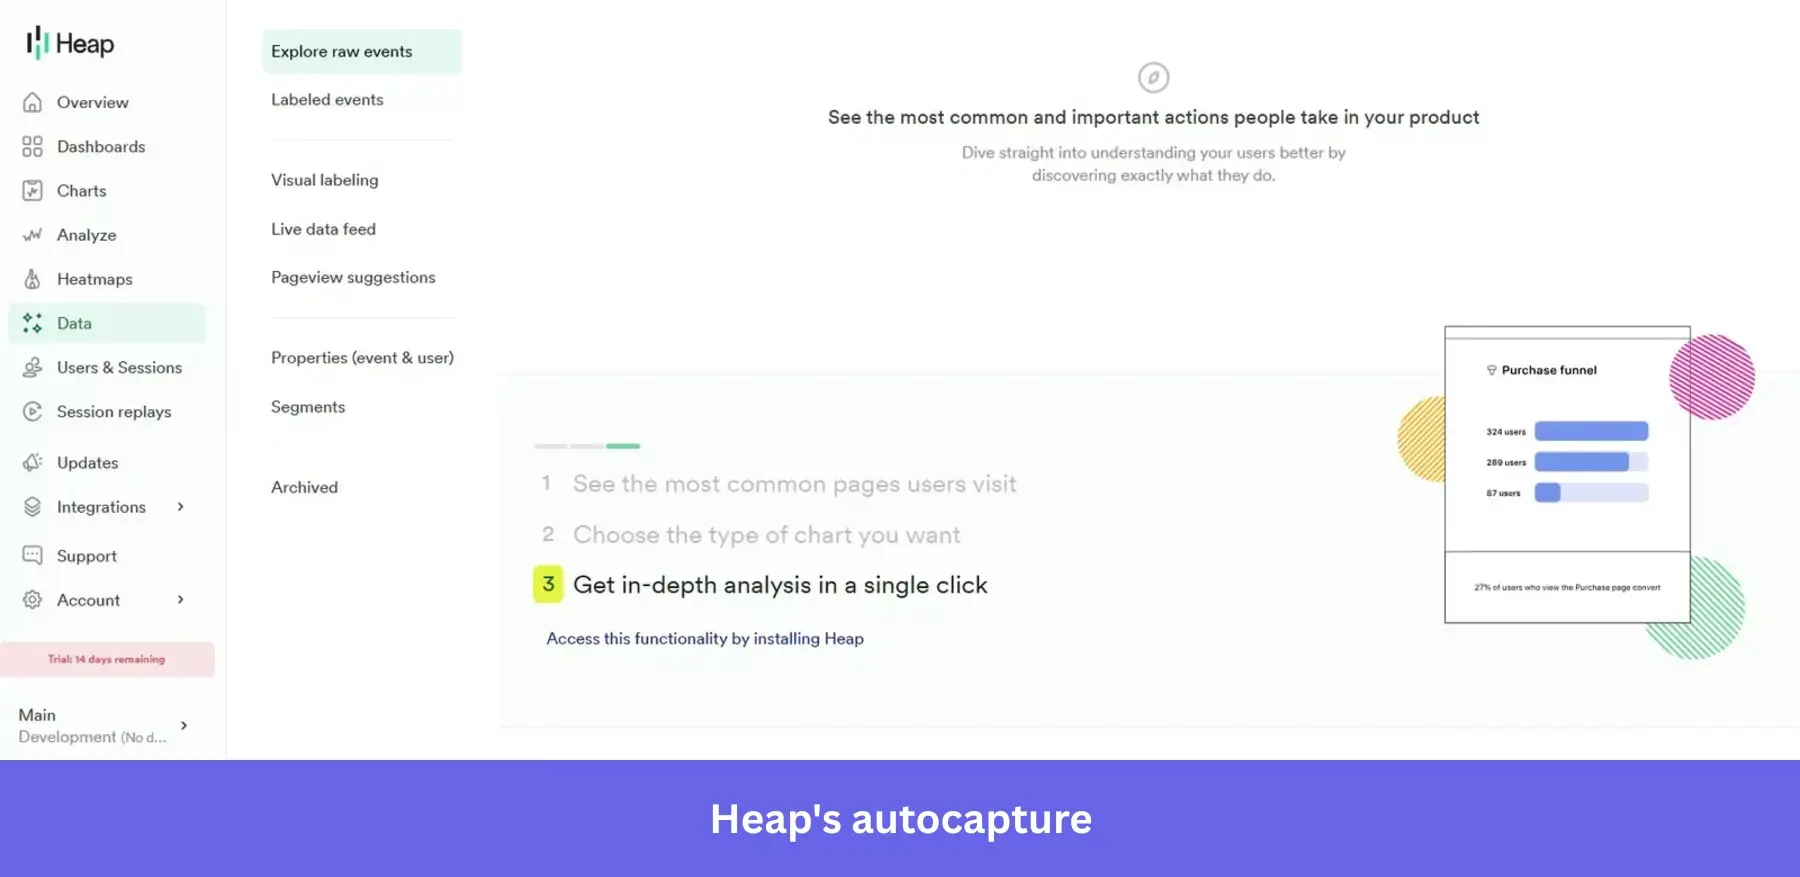
Heap for autocapture product data on both web and mobile applications
Like Hotjar, Heap is part of Contentsquare, but it takes a different approach to product analytics by automatically capturing user interactions from the start.
It’s also the only tool on this list that offers strong autocapture across both web and mobile. This means you can go back, analyze behavior retroactively, define events later, and still get full visibility into how users have interacted with your product over time.
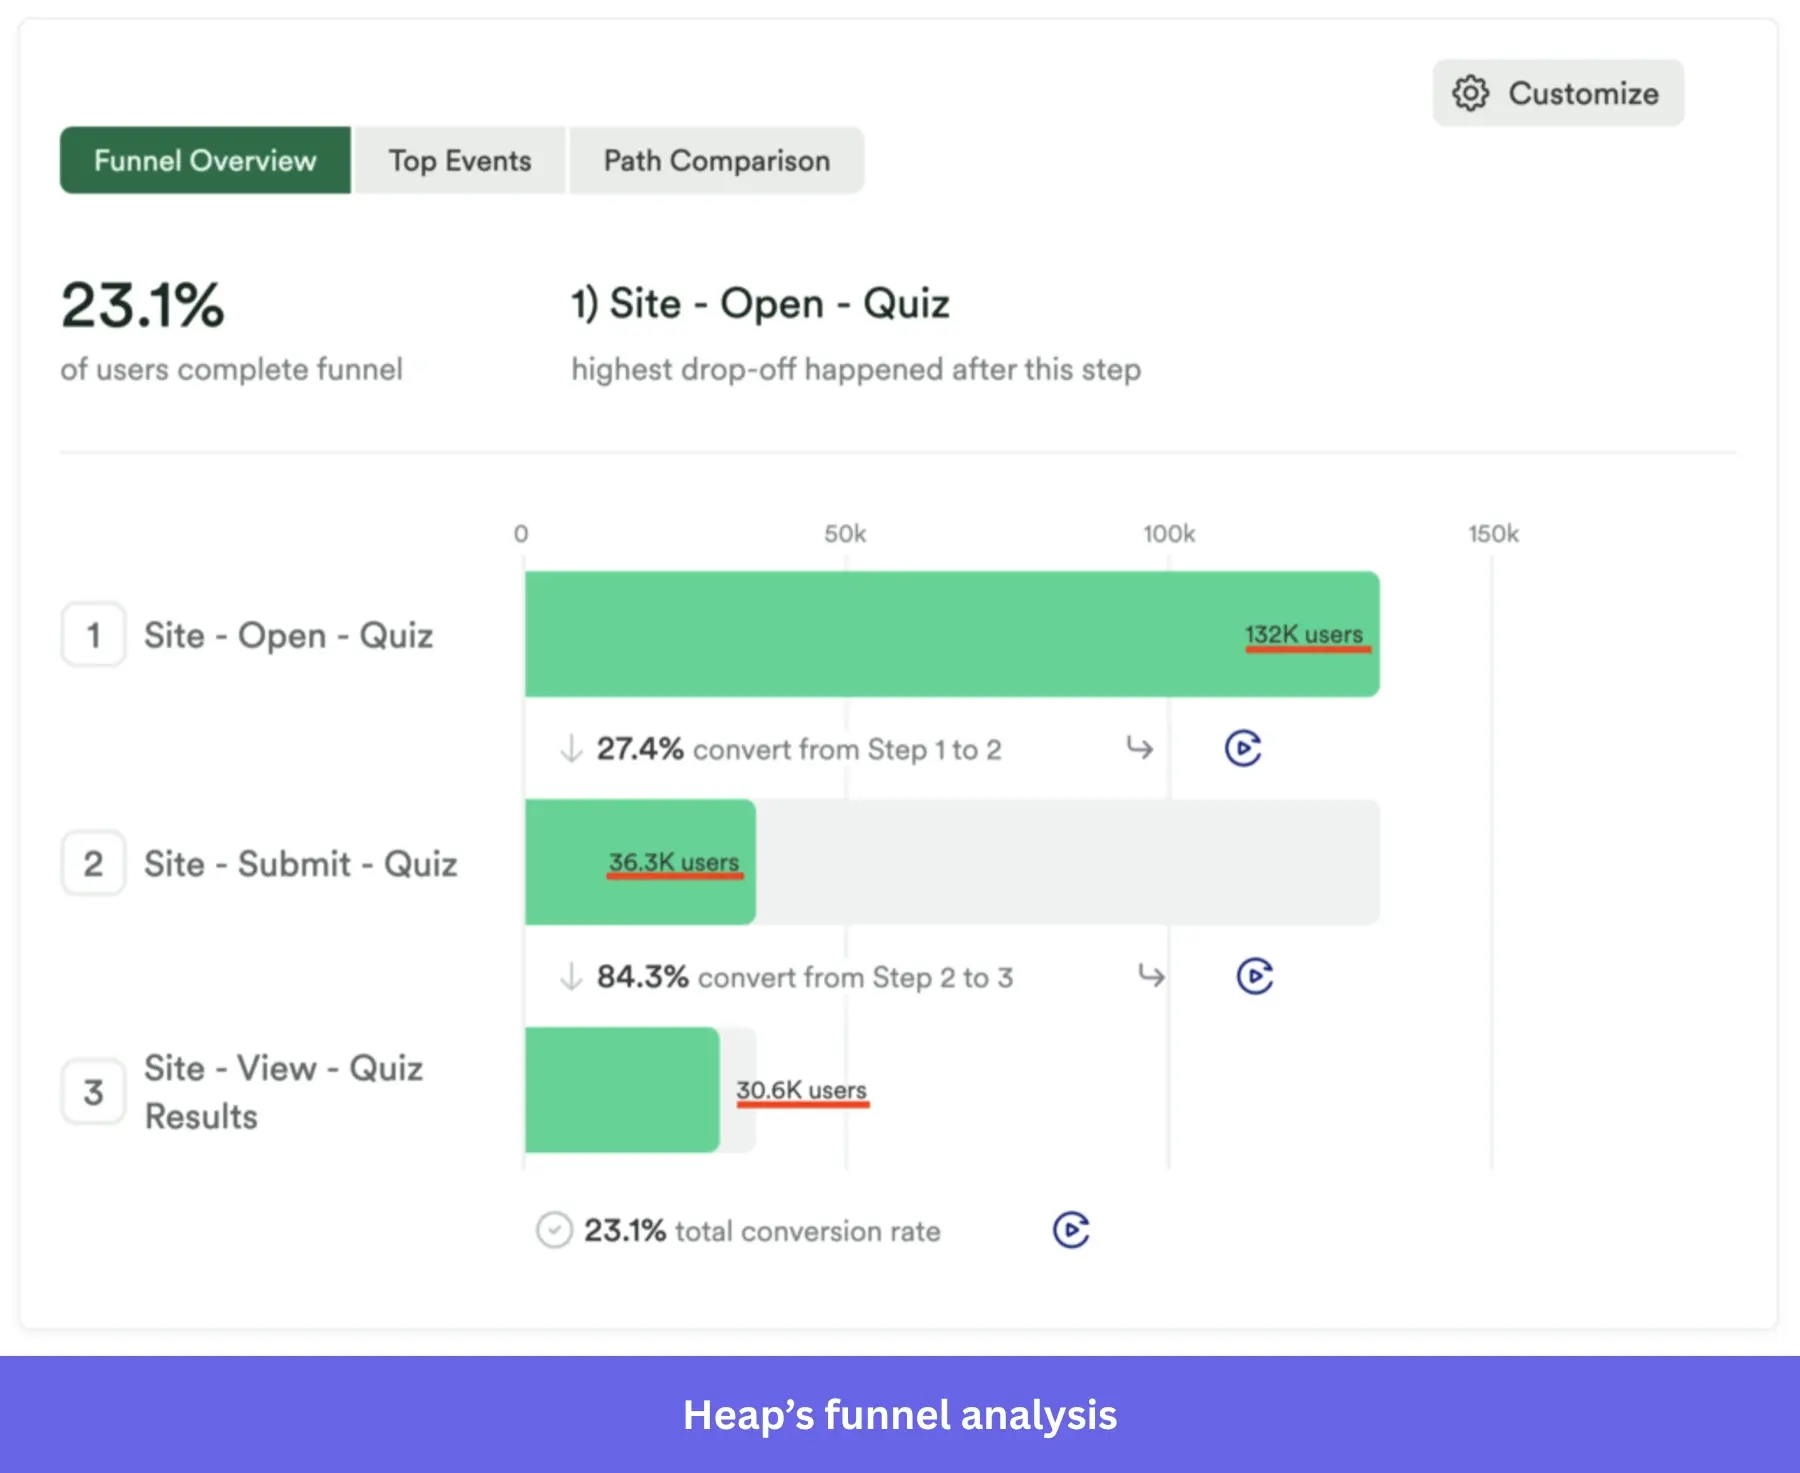
Heap features for SaaS analytics
- Heap Illuminate: Surface insights automatically using built-in data science models. This helps you identify trends, anomalies, and drivers of key metrics without manually digging through dashboards.
- Heatmaps and session replays: Visualize how users interact with your product and watch real sessions to understand behavior in context.
- Unified identity resolution: Combine user activity across devices, sessions, and touchpoints into a single user profile. This gives you a more complete view of the user journey, especially for products with cross-device usage.
- Funnels, paths, and retention analysis: Track how users move through key flows, where they stall, and how engagement evolves.
Heap pricing
Heap offers a free plan with up to 10K monthly sessions and 6 months of data retention. Paid plans are quote-based, though third-party sources like G2 suggest pricing starts at around $3,600 per year.
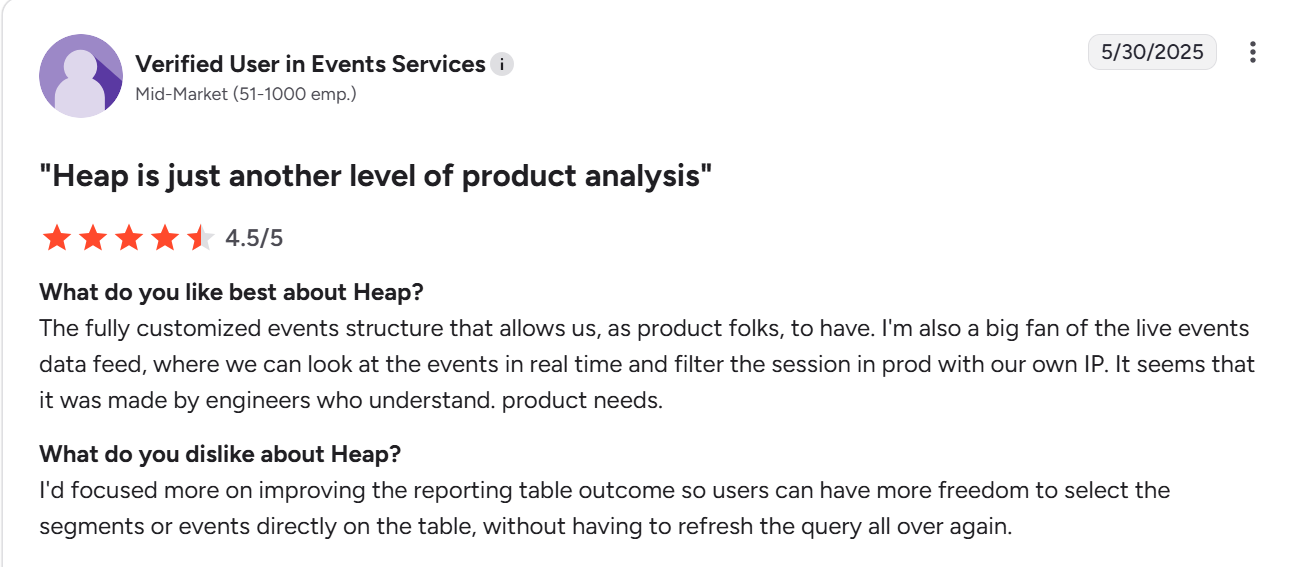
Heap pros and cons
Pros
- Autocapture removes the need for upfront tracking plans and manual data entry, making it easier to start collecting data immediately.
- Unified identity resolution helps stitch together user journeys across devices and sessions.
- Heap’s clean interface and visual tools make it easier to explore product data compared to more technical tools.
Cons
- Less flexibility for highly custom or complex queries.
- The session replay and qualitative tools aren’t as deep as specialized tools like Hotjar or FullStory.
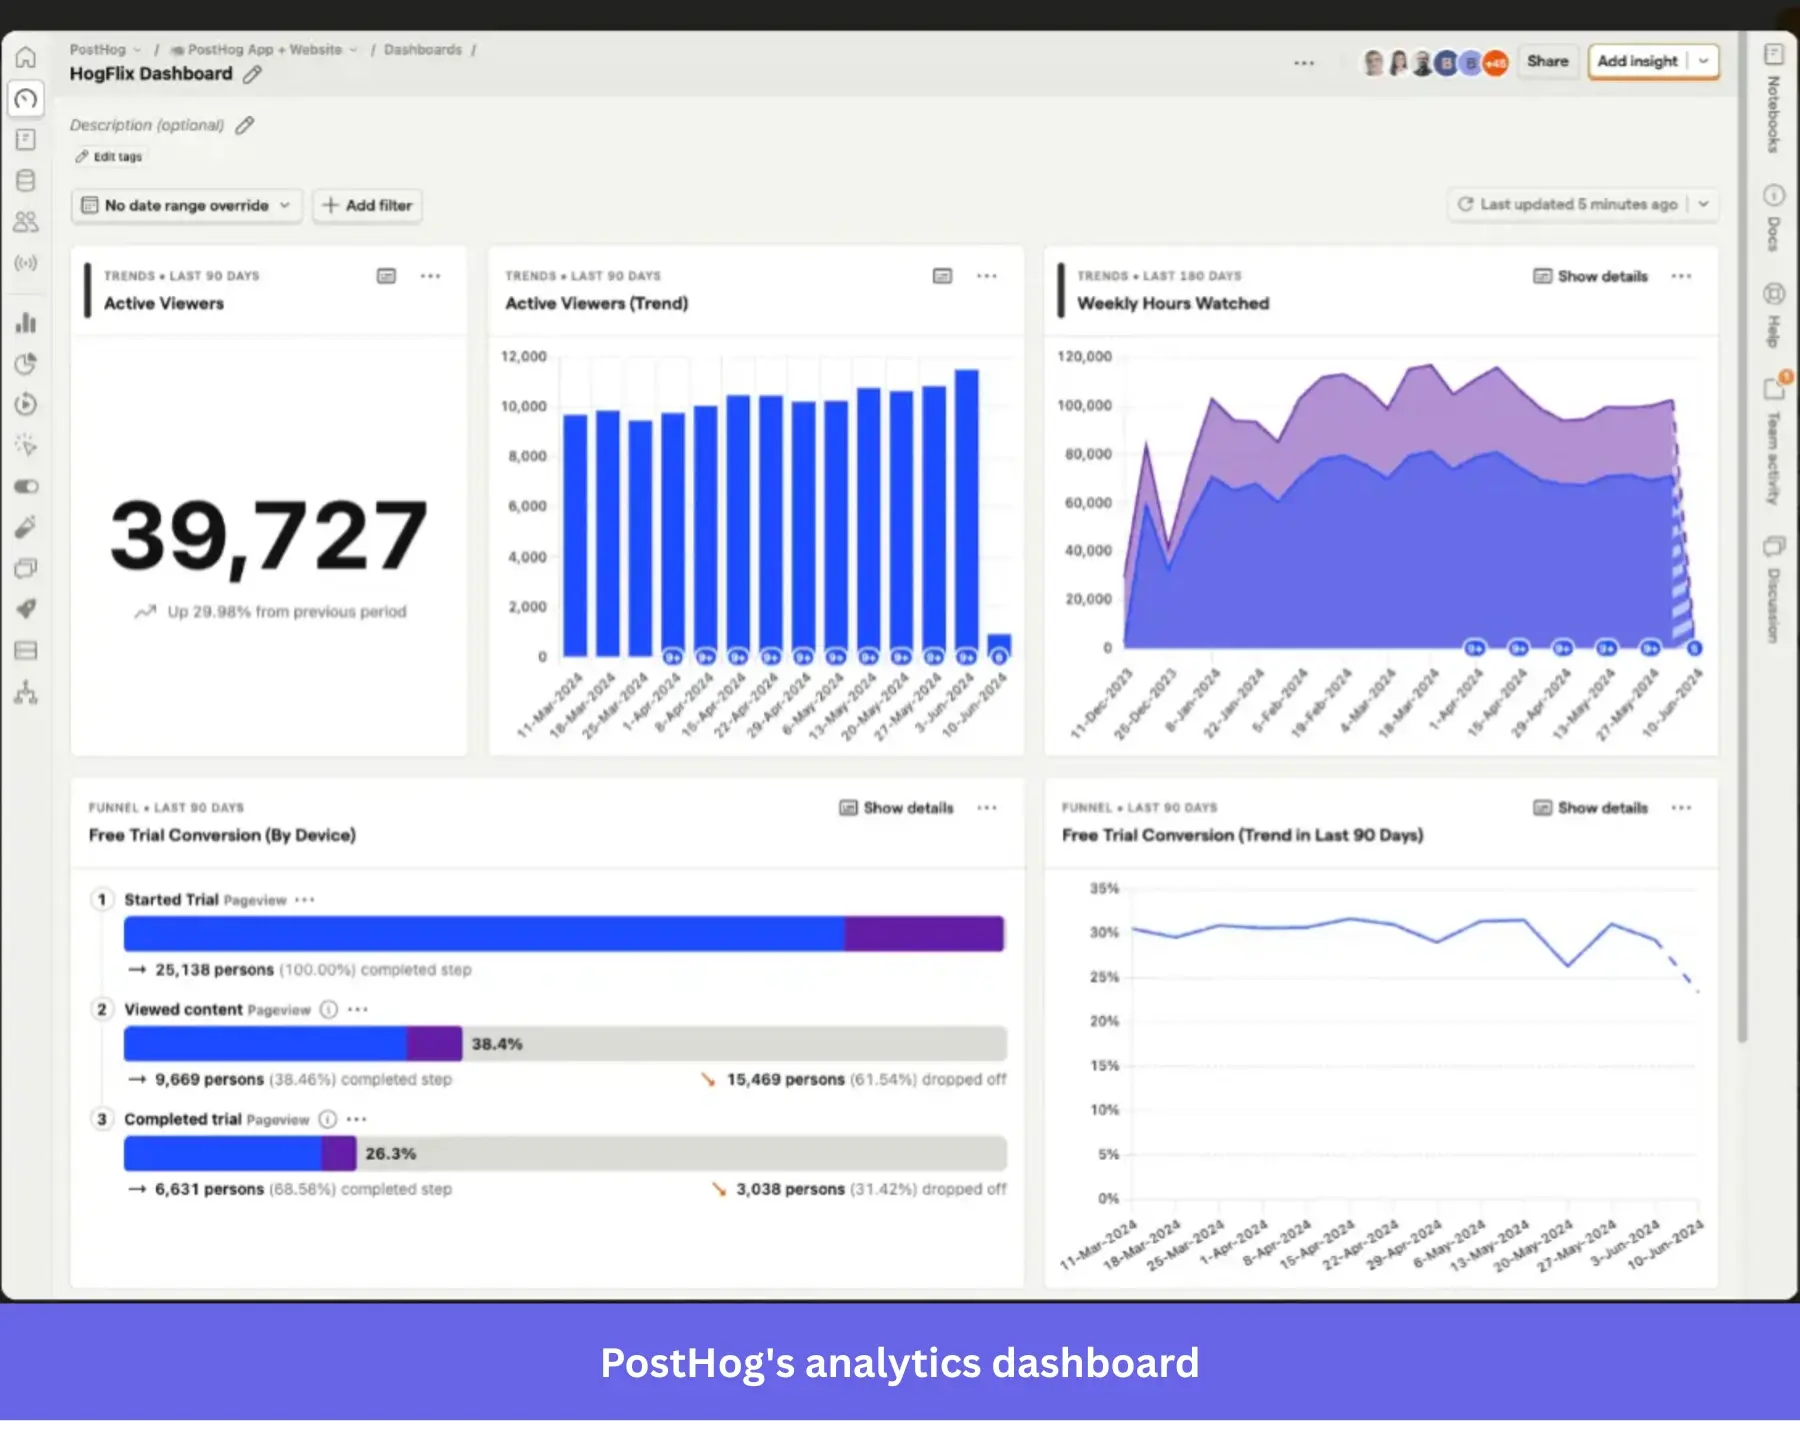
PostHog for open-source and engineering product analytics
PostHog is best suited for teams that have dedicated engineering resources and want full control over their product analytics stack.
As an open-source platform, it gives you the flexibility to go beyond standard dashboards and solve advanced analytics use cases using SQL queries. For example, you can query your product data directly, join it with external datasets or your data warehouse, build custom retention models, or analyze edge cases in user behavior that standard tools can’t easily surface.
PostHog features for SaaS analytics
- Feature flags and experimentation: Roll out new features gradually, target specific user segments, and run A/B tests without redeploying code. You can also use flags as kill switches or for remote configuration, which makes it easier to ship safely and iterate quickly.
- Session replay with developer-level debugging: Go beyond simple session recordings by inspecting console logs, network requests, and user interactions together. This makes it easier to reproduce issues and understand exactly what happened during a session, especially for debugging complex product behavior.
- Error tracking and monitoring: Capture exceptions, stack traces, and affected user sessions in real time. You can group issues, assign them to teams, and connect errors directly to product metrics or session replays to understand their impact on user experience.
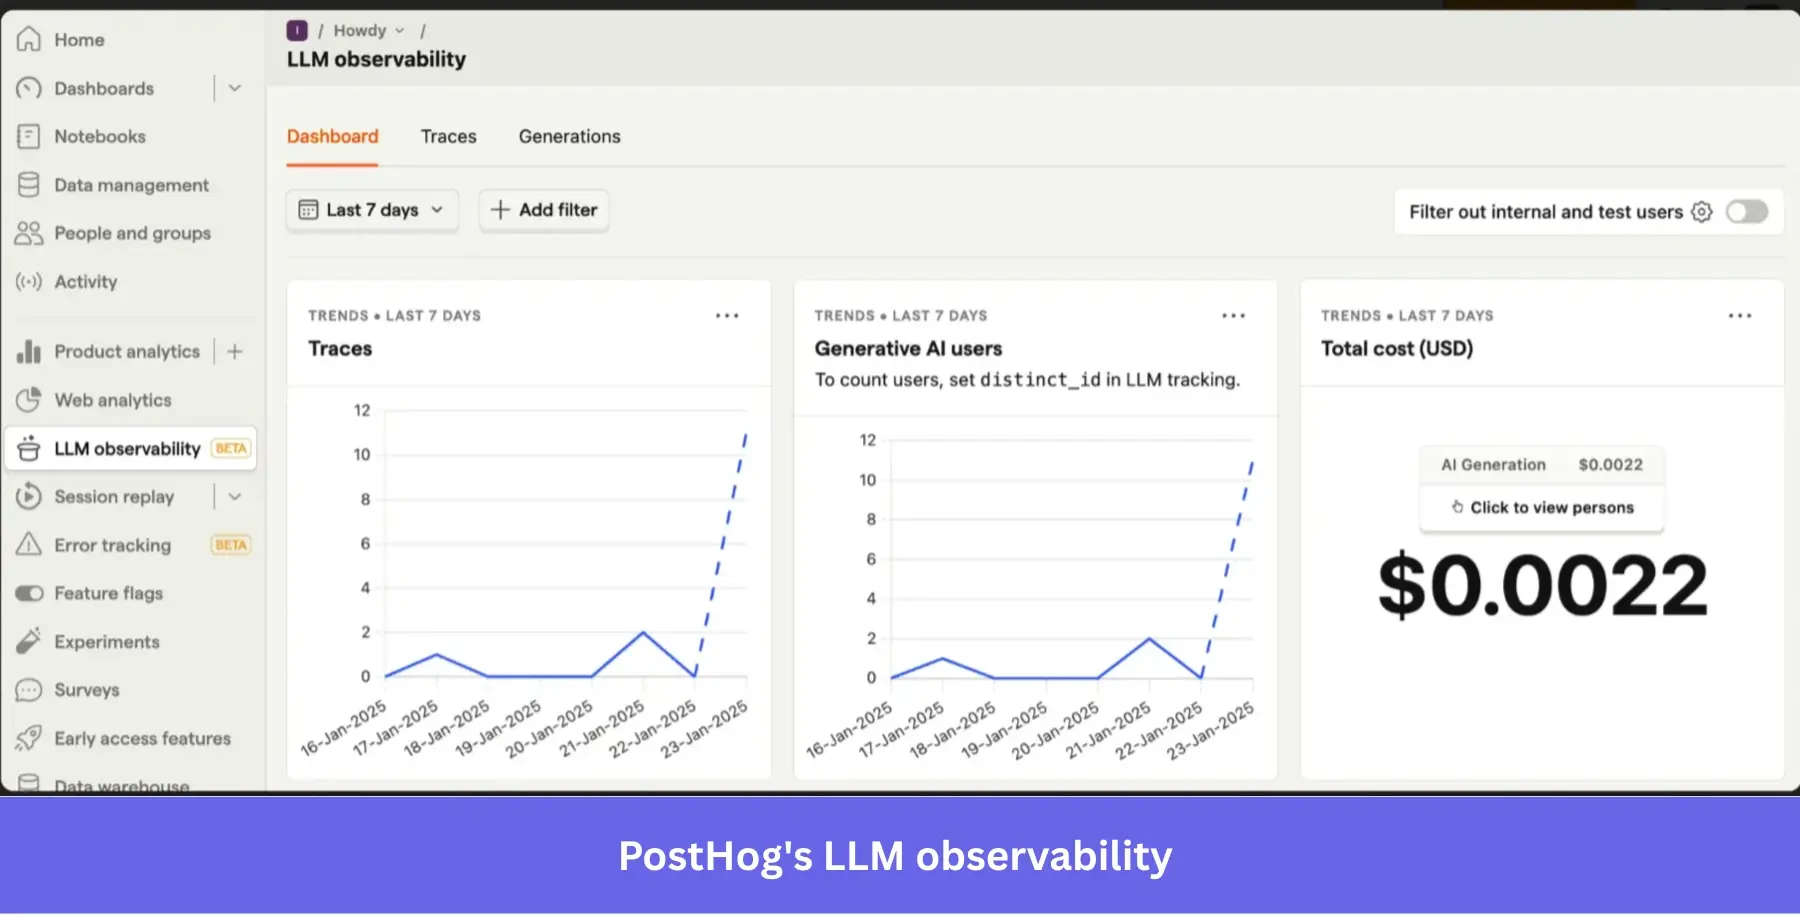
- LLM and AI observability: Track how users interact with AI capabilities by monitoring prompts, responses, token usage, latency, and costs. PostHog also lets you trace full conversations and tie them to user sessions, making it easier to debug and optimize AI-powered experiences in production.
PostHog pricing
PostHog offers a generous free plan that includes core product analytics, session replay, feature flags, and basic error tracking.
The paid tiers use a usage-based pricing model, with each product (Analytics, Session Replay, Feature Flags, etc.) metered separately. You can use PostHog’s pricing calculator to see how your usage translates into spend.
Posthog pros and cons
Pros
- Combines multiple tools in one platform.
- Strong debugging capabilities with session replay, console logs, and network data tied to user sessions.
- Flexible deployment options, including self-hosting for teams with strict data privacy or compliance needs.
Cons
- Steep learning curve for teams new to open-source SaaS analytics tools.
- Usage-based pricing can become unpredictable as data volume grows.
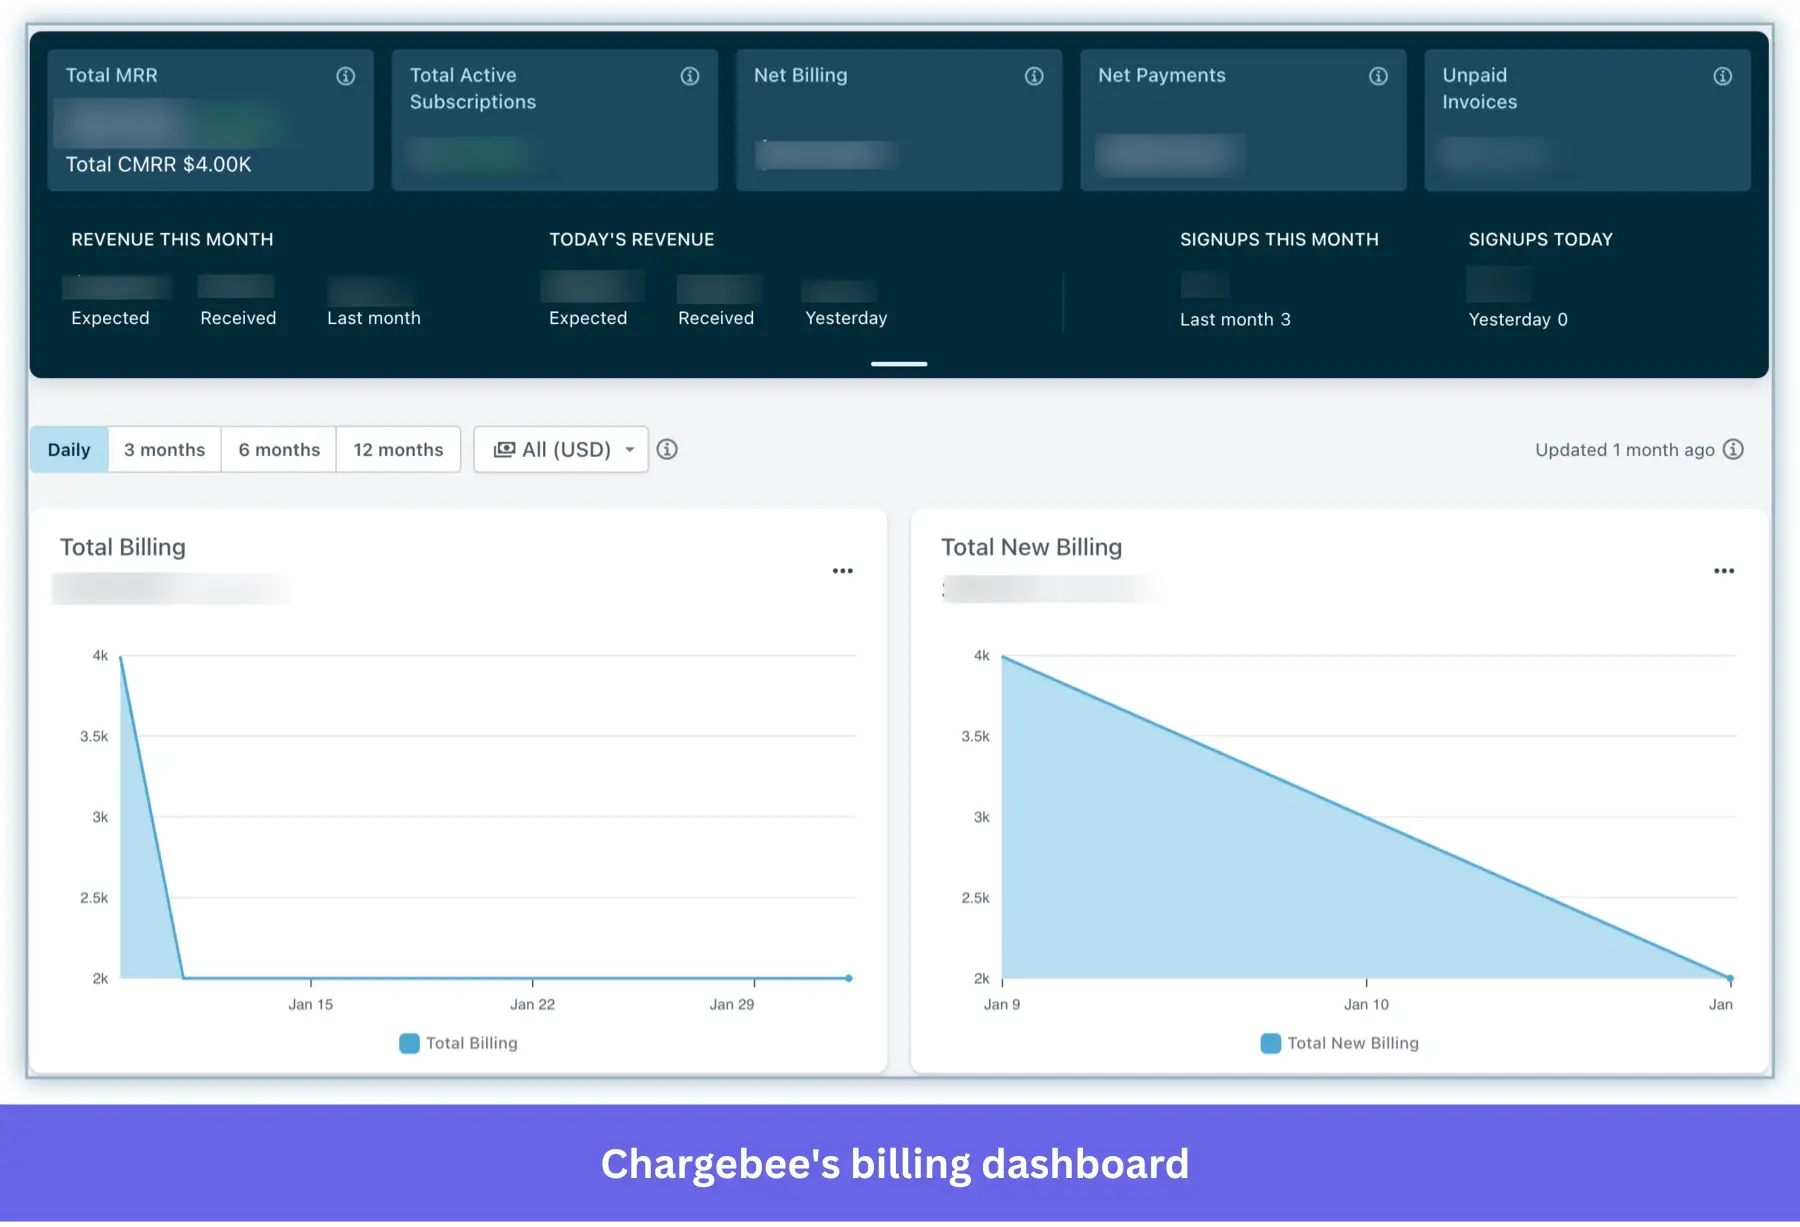
Chargebee for tracking subscription performance and revenue health
Chargebee focuses on the financial side of SaaS analytics, giving you visibility into how your monthly revenue grows, contracts, or churns over time.
It provides tools for tracking key metrics like MRR, churn, and expansion revenue, while managing billing, subscriptions, and pricing in one place.
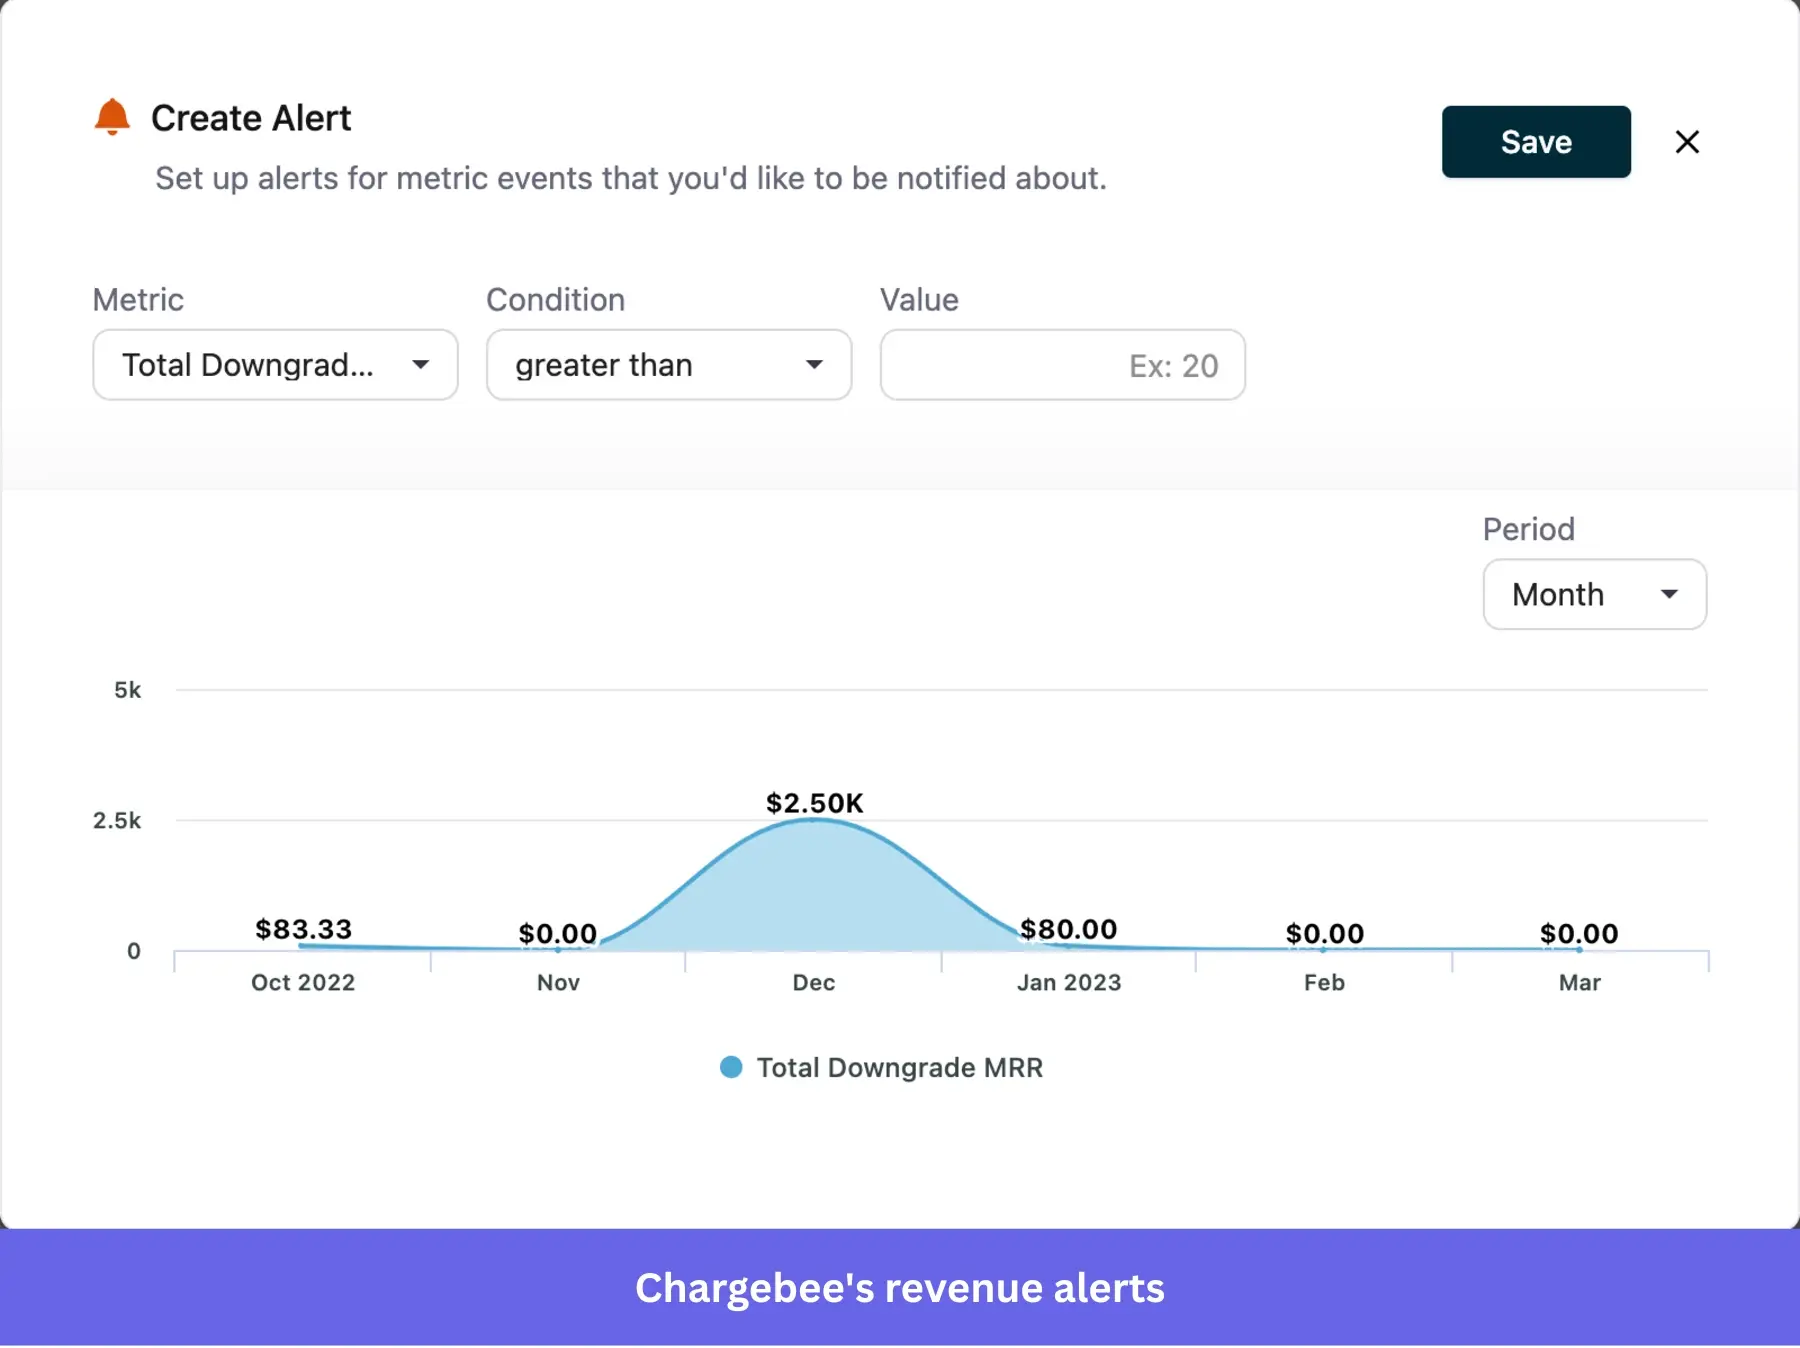
Chargebee features for SaaS analytics
- Subscription lifecycle management: Manage the entire customer lifecycle, from trial and new customer onboarding to upgrades, downgrades, renewals, and cancellations. This gives you a clear view of how customers move through your product and how each stage impacts revenue.
- Revenue recovery and dunning: Reduce involuntary churn with smart retry logic, automated payment reminders, and dunning workflows. Chargebee also provides recovery analytics to track failed payments, recovery rates, and revenue saved over time.
- Revenue analytics and reporting: Track key SaaS metrics like MRR, ARR, churn, expansion revenue, and LTV through real-time dashboards.
- Revenue recognition: Automate revenue recognition and ensure regulatory compliance with accounting standards like ASC 606 and IFRS 15.
Chargebee pricing
Chargebee’s pricing is modular and depends on the product you use, such as Billing, CPQ, RevRec, or Retention. It offers a free Starter plan for early-stage companies, while paid plans start at $250 and scale based on your billing volume and feature needs.
Chargebee pros and cons
Pros
- Reliable and scalable billing infrastructure that handles complex billing setups and subscription models without breaking.
- Strong fit for finance teams that need accurate reporting and audit-ready revenue data.
- Wide range of integrations with payment gateways, CRMs, and accounting tools.
Cons
- Initial setup is time-consuming, especially for teams without prior experience with billing systems.
- Interface and workflows can feel complex compared to simpler subscription tools.
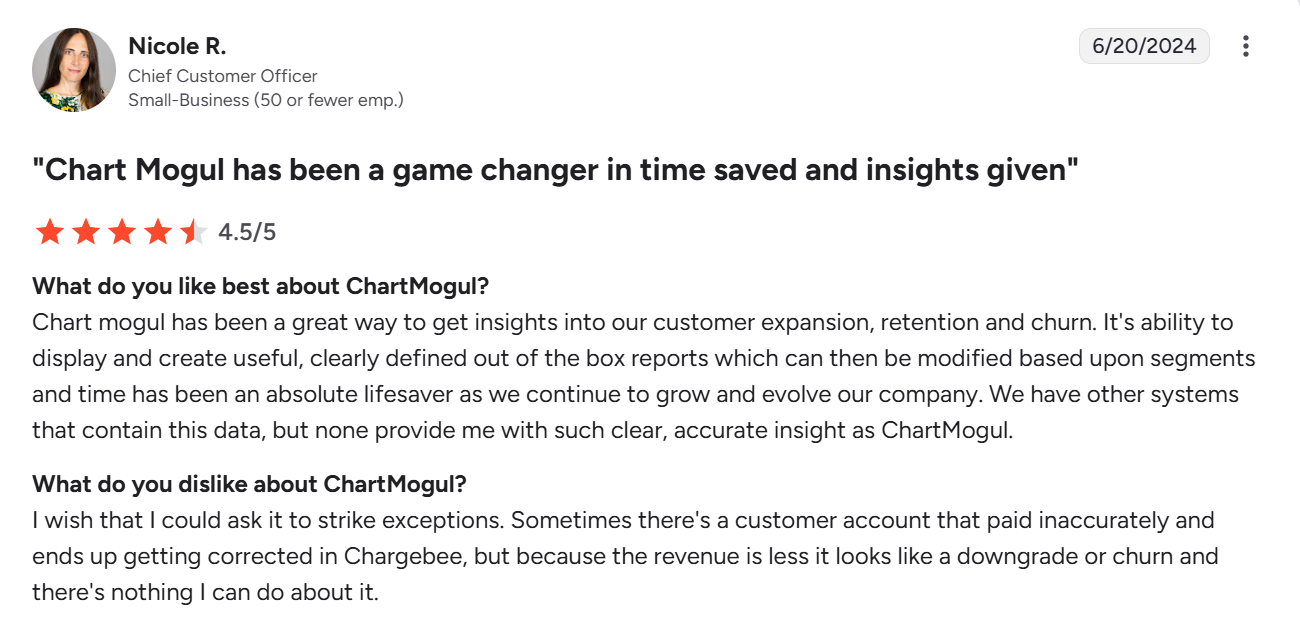
ChartMogul for measuring SaaS growth and retention
While Chargebee is a billing engine that actually collects your money, ChartMogul is a subscription analytics platform that visualizes how that money is moving. It helps you generate real-time MRR, ARR, and churn reports via direct integrations with payment processors like Stripe and Recurly.
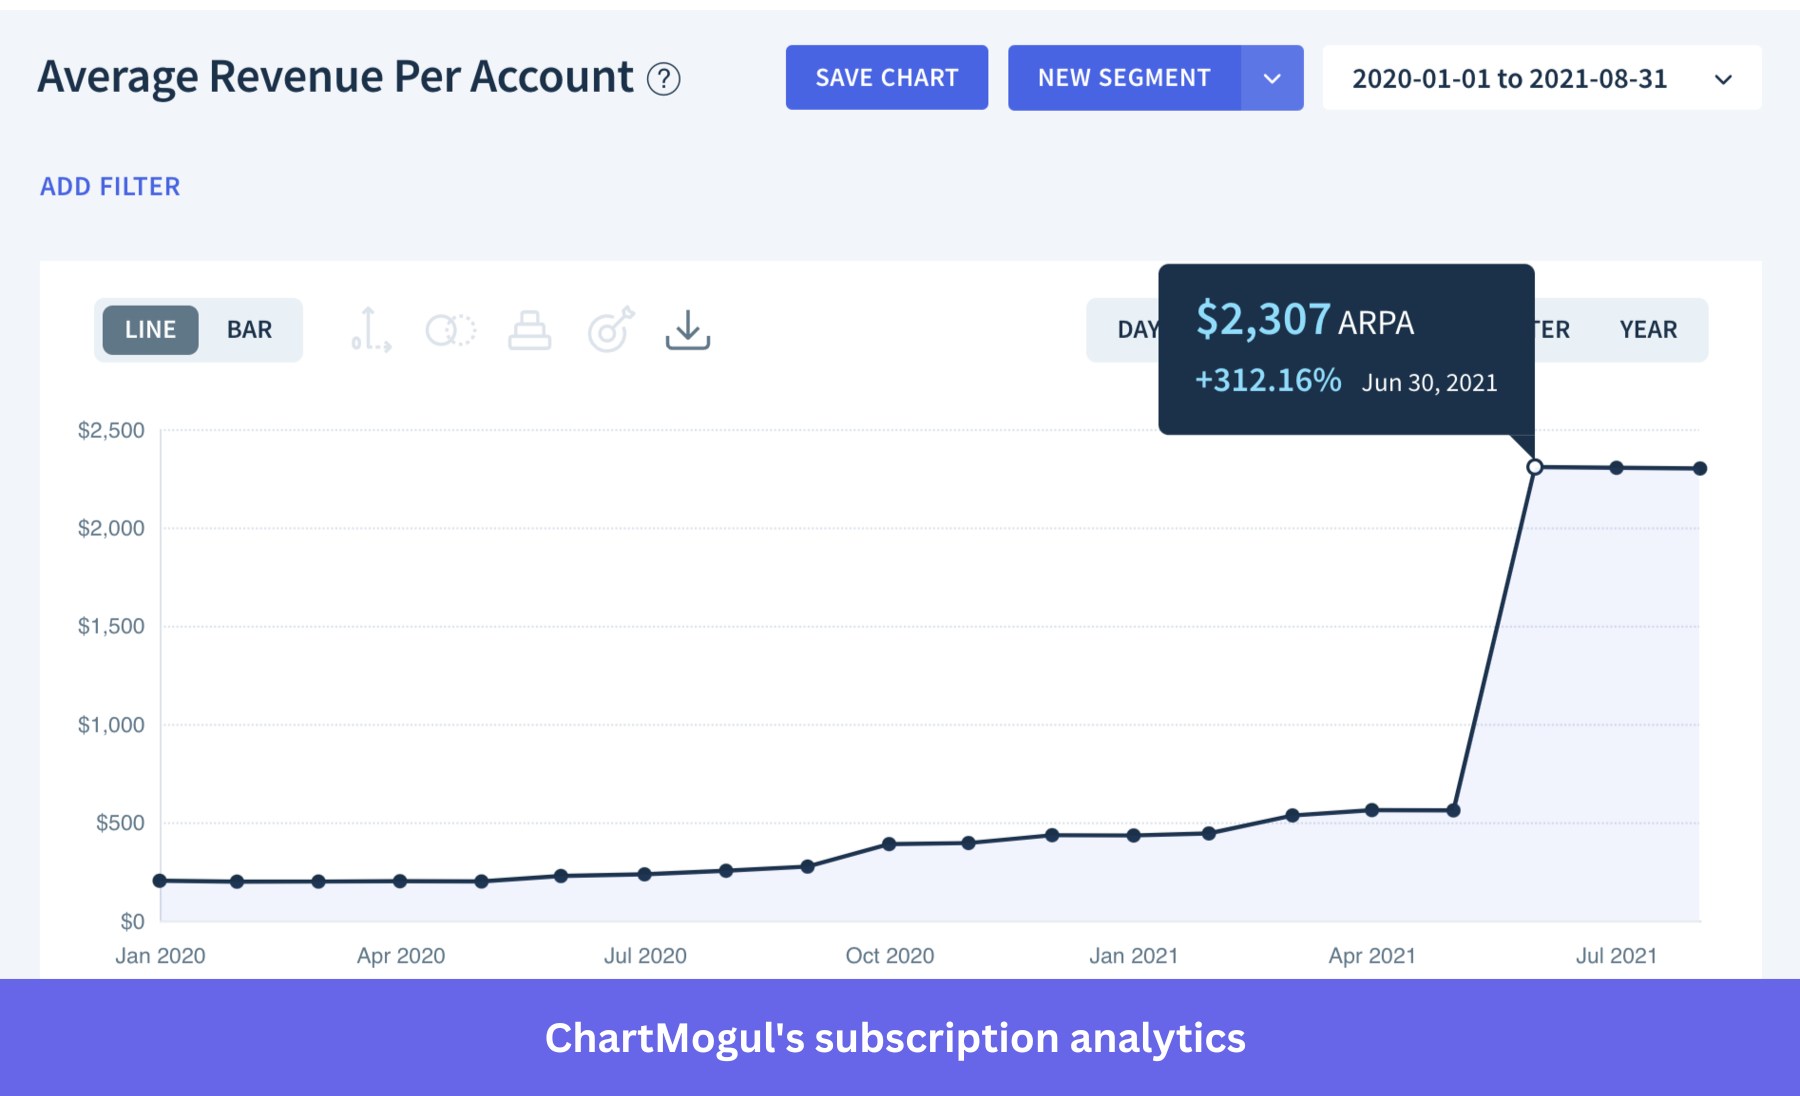
ChartMogul features for SaaS analytics
- Real-time SaaS metrics and reporting: Track core metrics and monitor growth trends through intuitive dashboards designed specifically for subscription businesses.
- Advanced customer segmentation: Slice your revenue data by customer attributes like plan, region, acquisition channel, or product usage. You can compare segments side by side to see which groups drive the most value or churn the fastest, without needing SQL or BI tools.
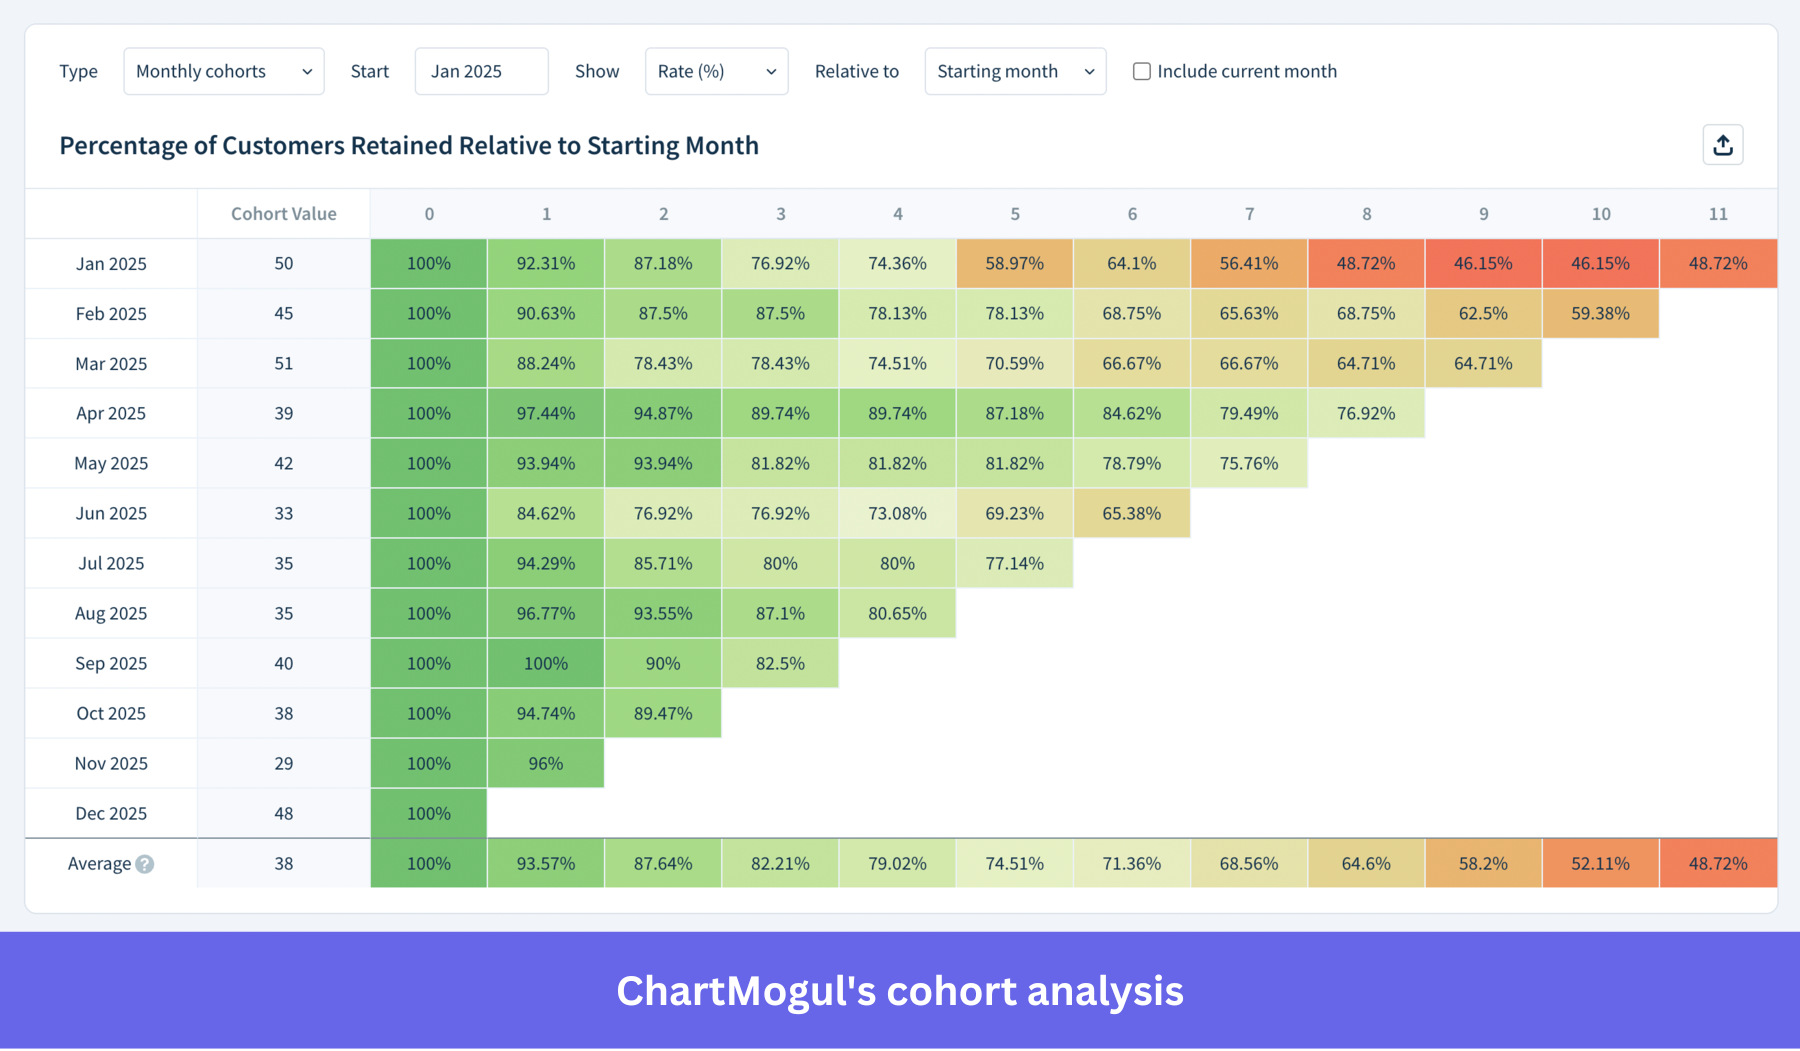
- Cohort analysis: Analyze how different customer cohorts perform over time using visual tools like retention heatmaps and stacked “layer cake” charts.
- Data cleanup and enrichment tools: Clean and standardize billing data by merging duplicate customers, correcting subscription histories, and enriching records with additional attributes. This ensures your metrics are accurate and reliable.
ChartMogul pricing
ChartMogul offers three pricing tiers: a Free plan for startups with up to $120K ARR, a Pro plan starting at $99 per month (billed annually) for around $500K ARR, and an Enterprise plan that begins at $19,900 per year for larger SaaS businesses.
ChartMogul pros and cons
Pros
- Clean, intuitive dashboards that make it easy to track SaaS metrics without needing technical expertise.
- The platform updates metrics automatically in real time.
- It handles complex subscription scenarios like multi-currency billing and different pricing models well.
Cons
- Limited customization compared to full business intelligence tools, especially if you need highly tailored dashboards or predictive analytics.
- Pricing scales with your revenue, which can become expensive as you grow.
Key SaaS metrics and KPIs to track through your SaaS analytics
Now that we’ve covered different types of SaaS analytics tools, their main functionality, and analytics features, let’s talk about the key performance indicators that every SaaS business should be tracking to increase customer retention.
Average Revenue Per User (ARPU)
The Average Revenue Per User (ARPU) or Average Revenue Per Account (ARPA) denotes the amount of revenue a paying user generates during a specific period.
Like the number of users, revenue generated by each user is an important metric of customer success in SaaS. The goal of product marketing is not only user acquisition but also increasing account expansion, which is measured using ARPU.
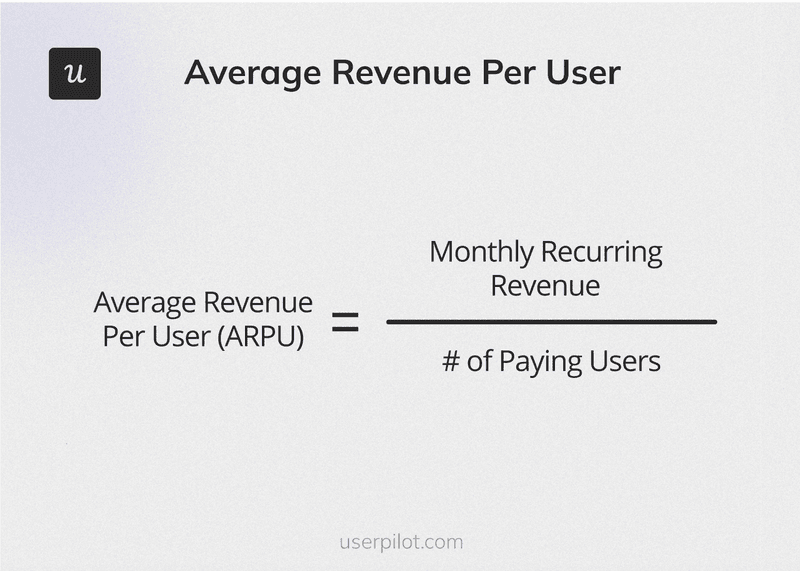
Monthly Recurring Revenue (MRR)
Monthly Recurring Revenue (MRR) is calculated by multiplying the average revenue per account by the number of accounts in a given month.
MRR is the first step to understanding whether your product marketing is driving growth or not.
Annual Recurring Revenue (ARR)
Annual Recurring Revenue (ARR) is similar to MRR, except it considers a year instead of a monthly interval.
Keeping an eye on both MRR and ARR helps you understand whether or not your efforts are generating sustainable results.
Expansion MRR rate
Expansion MRR rate tells you at what rate you’re growing through account expansion.
The formula for the Expansion MRR rate is:
(Expansion MRR at the end of the month – Expansion MRR at the beginning of the month) / Expansion MRR at the beginning of the month x 100
Where expansion MRR = revenue from upgrades in the month + revenue from add-ons in the month.
Churn MRR rate
The churn MRR rate denotes how much revenue you have lost over a range of time because of churn.
The formula for the Churn MRR Rate is:
(Churned MRR- Expansion MRR) / starting MRR x 100
Where Churned MRR = revenue lost due to churn in a given period.
Customer Lifetime Value (CLV or LTV)
CLV or LTV is the amount of money a business earns from one customer over the duration they stay your customer. It represents how profitable it is to invest in acquiring a customer.
You can calculate LTV in multiple ways.
One way to calculate it is by dividing your average revenue per account by your churn rate.
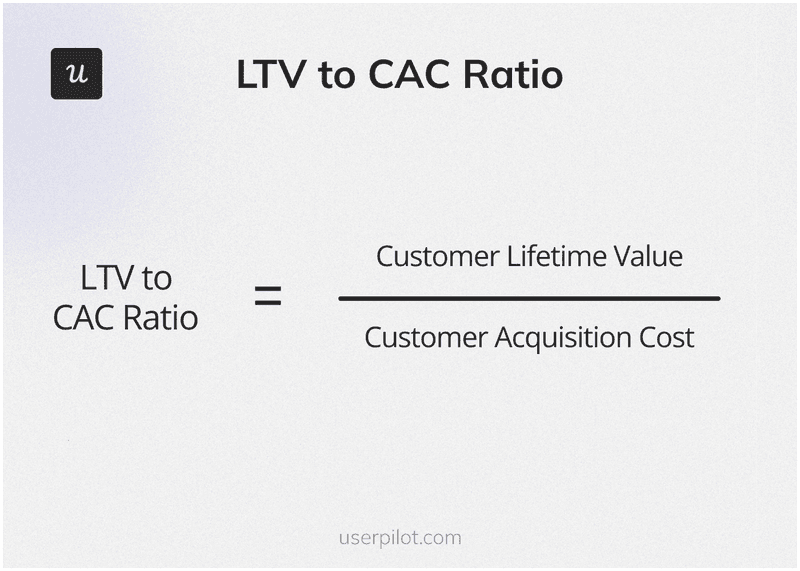
Customer Lifetime Value (LTV) to Customer Acquisition Cost (CAC) ratio
LTV to CAC ratio shows how efficient your product marketing is at acquiring customers.
An LTV to CAC ratio below 1 means you are spending more money to acquire customers than the revenue you get from them. This is unsustainable, and no business can support this long-term.
Although there is no magic number, a healthy LTV to CAC ratio in SaaS can be considered as one that is 3 times or more than your cost of acquiring a customer.
Customer Retention Rate (CRR)
You need to look at user retention rates at different intervals. There are multiple ways of calculating user retention rates. Some of these are:
- Day 0 retention rate
- Week 1 retention rate
- 7 days range retention rate
So which SaaS analytics tool should you go for?
I’d say start with your biggest blind spot. If you can’t see how users move through your product, you need behavioral analytics. If revenue visibility is the gap, go straight to Chargebee or ChartMogul.
The tools in this list aren’t really competing with each other. They solve different problems at different layers of your SaaS business.
So if closing the gap between product data and in-app action is where you want to start, we’d love to show you how Userpilot approaches it. Book a demo and we’ll walk you through it.
FAQ
What software is used for SaaS?
In essence, SaaS is a combination of technologies like cloud infrastructure, application software, etc. working together to deliver software over the Internet. The provider manages all the underlying complexity, so you can focus on using the application to analyze your data and gain insights.
What is SaaS in data analytics?
SaaS in data analytics stands for Software as a Service Data Analytics.
Essentially, it means using cloud-based tools to collect, analyze, and understand your data. Instead of installing and maintaining expensive software on your computers, you access these tools over the internet.
Here’s why SaaS is becoming increasingly popular for data analytics:
- Accessibility: You can access your data and analytics tools from anywhere with an internet connection.
- Affordability: SaaS solutions typically operate on a subscription model, making them more cost-effective than traditional software.
- Scalability: Easily scale your usage up or down based on your needs.
- Maintenance: The SaaS provider handles all the maintenance, updates, and security. You can focus on analyzing your data, not managing software.
How to analyze a SaaS product?
To analyze your SaaS product, start with a question to narrow down your analysis. Aside from tracking KPIs directly affecting your business goals, pinpoint the problems you are trying to solve i.e. user retention, adoption, conversion, etc. With a problem in mind, you can easily decide what aspect of the product you should be looking at and what metrics are important to monitor.
About the author