Top Behavioral KPI Examples and How AI Agents Skew the Metrics


Behavioral KPIs track what users actually do inside your product: which features they touch, how fast they reach value, and whether they’d recommend you. Then, you can use those valuable insights to make data-driven decisions for your SaaS business.
In this article, we will discuss the top 6 behavioral KPI examples and how you can track them to improve your product and drive business growth. We’ll also look at how AI agents serve as a major blind spot to those KPIs.

What behavioral KPIs are and why they still matter in 2026
Behavioral KPIs are metrics that track and measure how customers actually interact with your product: what they click, how far they get, when they drop off, and how often they come back. Unlike financial KPIs that report what already happened to your revenue, behavioral KPIs tell you what’s happening to your users right now, before those patterns show up in your MRR or churn reports.
Tracking them is how you catch a friction point in the activation funnel before it quietly kills a cohort’s retention. It’s how you know that the 500 users who signed up last month are stuck at the same step, not just that last month’s expansion revenue missed the target.
Without the behavioral layer, you’re left guessing at the wrong stage.
Behavioral KPIs vs. revenue KPIs
Traditional KPIs, including gross profit margin, customer acquisition cost, monthly recurring revenue, and employee retention, measure outcomes. They tell you whether the business worked over a given period. Behavioral KPIs measure the actions that drive those outcomes before the period closes.
The distinction matters because behavioral KPIs are leading indicators and traditional KPIs are lagging ones. A drop in your product activation rate this week will show up in your expansion MRR in 60 days. If you’re only tracking the lagging financial metrics, you’ll see the problem two months too late to do anything about it.
The other difference is who can act on them. Revenue metrics go to the CFO. Behavioral KPIs go to the product team, and the product team is the one with the tools to fix a drop-off rate at step three of the onboarding funnel without waiting for a board meeting.
6 Behavioral KPI examples to measure user intent
Not every behavioral KPI can have a positive influence on your strategies. So it’s crucial to know which behavioral KPIs are the most necessary for your products. Here are six top behavioral KPI examples that you should be tracking.
Time to value
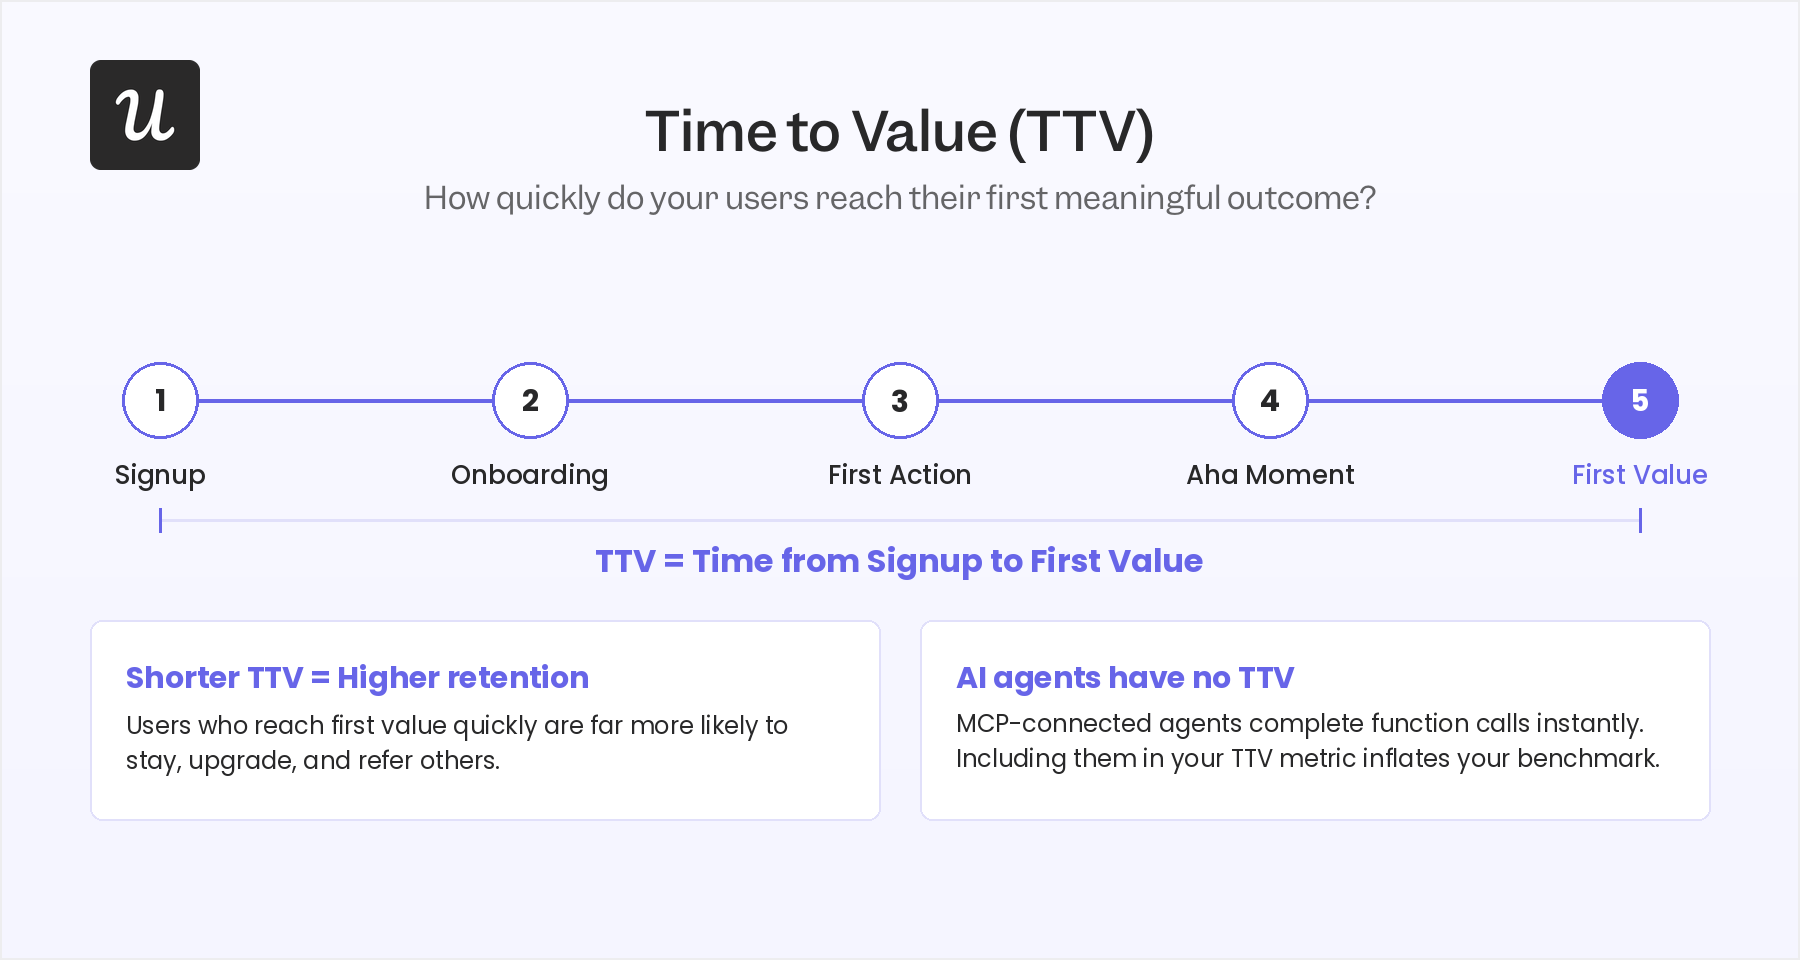
In SaaS, time to value (TTV) is the time it takes a user to reach their first meaningful outcome: the specific moment they experience why they signed up. It’s one of the strongest predictors of whether a user converts and stays, because users who reach value quickly are far more likely to stick around, upgrade, and recommend your product to others.
A short TTV tells you your product is easy to understand and your onboarding is doing its job. A long TTV usually means your activation flow has a friction point, your value proposition isn’t landing in the right order, or users are hitting a setup step that’s harder than it looks. The average TTV varies significantly by product category, so the benchmark that matters is your own cohort-over-cohort trend rather than an industry number.
Breadth of adoption
Breadth of adoption measures how widely your customer base has adopted your product, including how many distinct features different user segments actually use. A wide breadth tells you users are finding multiple use cases. A narrow breadth usually means the product is being used as a point solution, with limited product depth. Fine if that’s the intent, it becomes a retention risk if it isn’t.
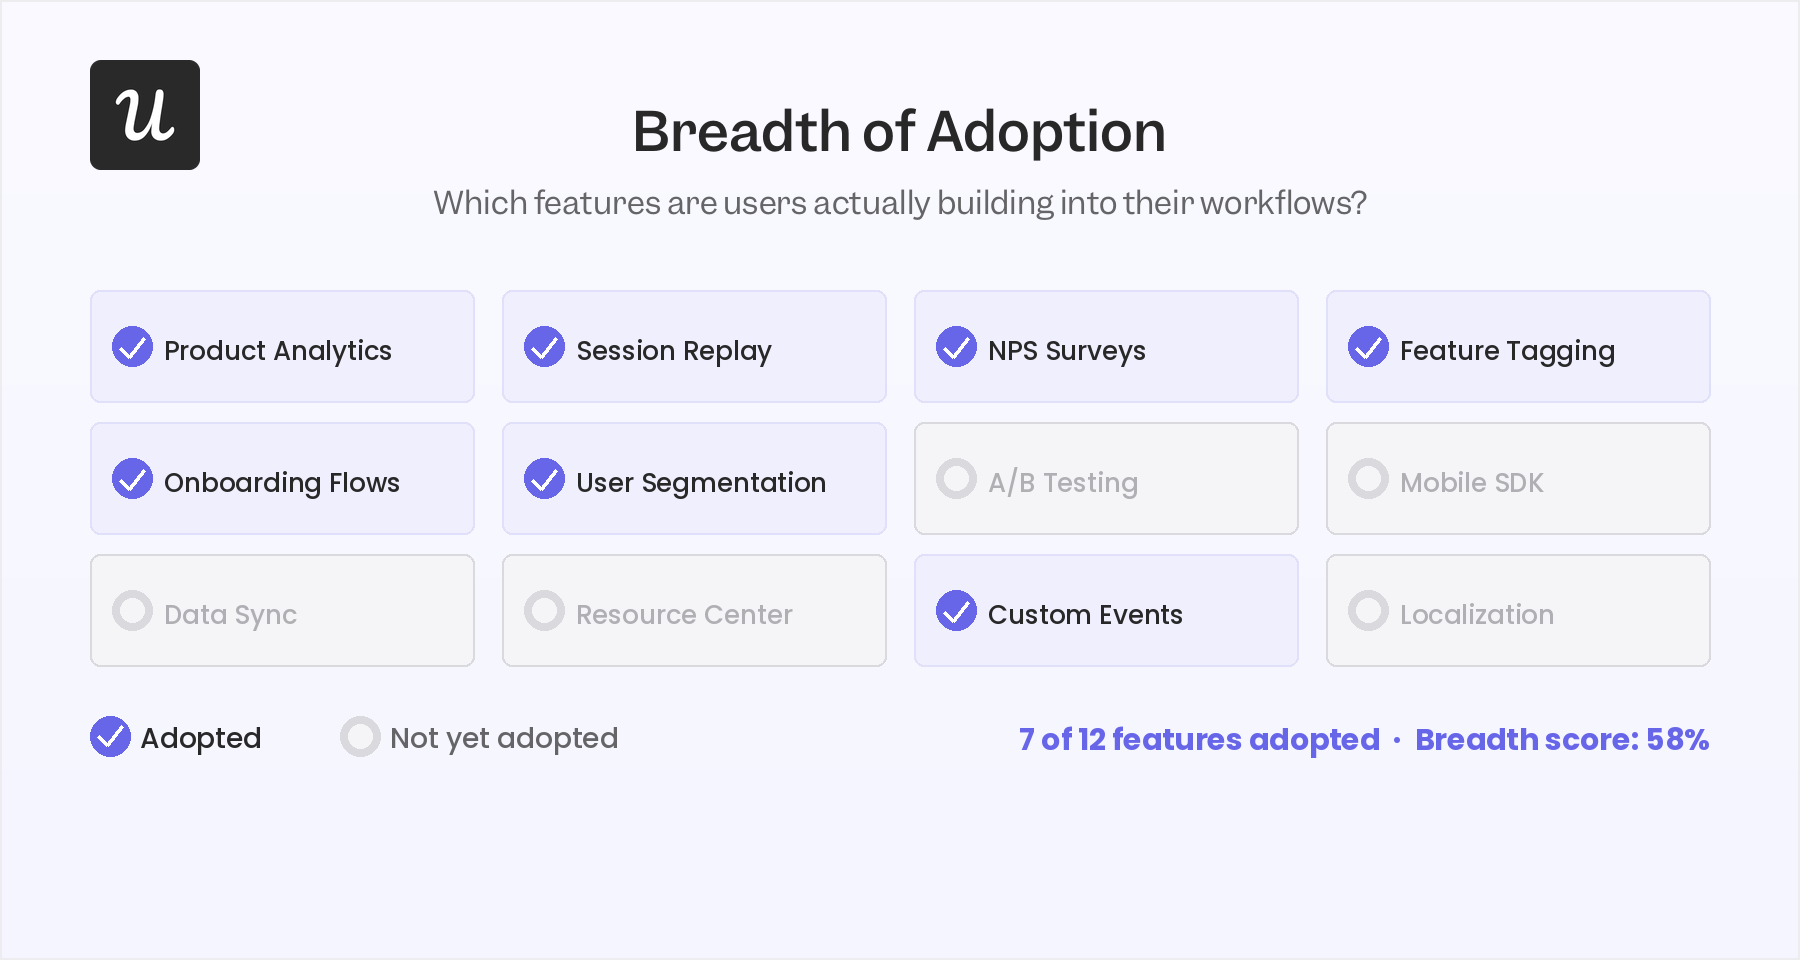
Tracking product adoption at the feature level is where this metric gets most useful: you can see not just that users are in the product, but which specific capabilities they’re building workflows around. That’s the data that tells you which features to invest in and which ones to cut through product feature analysis.
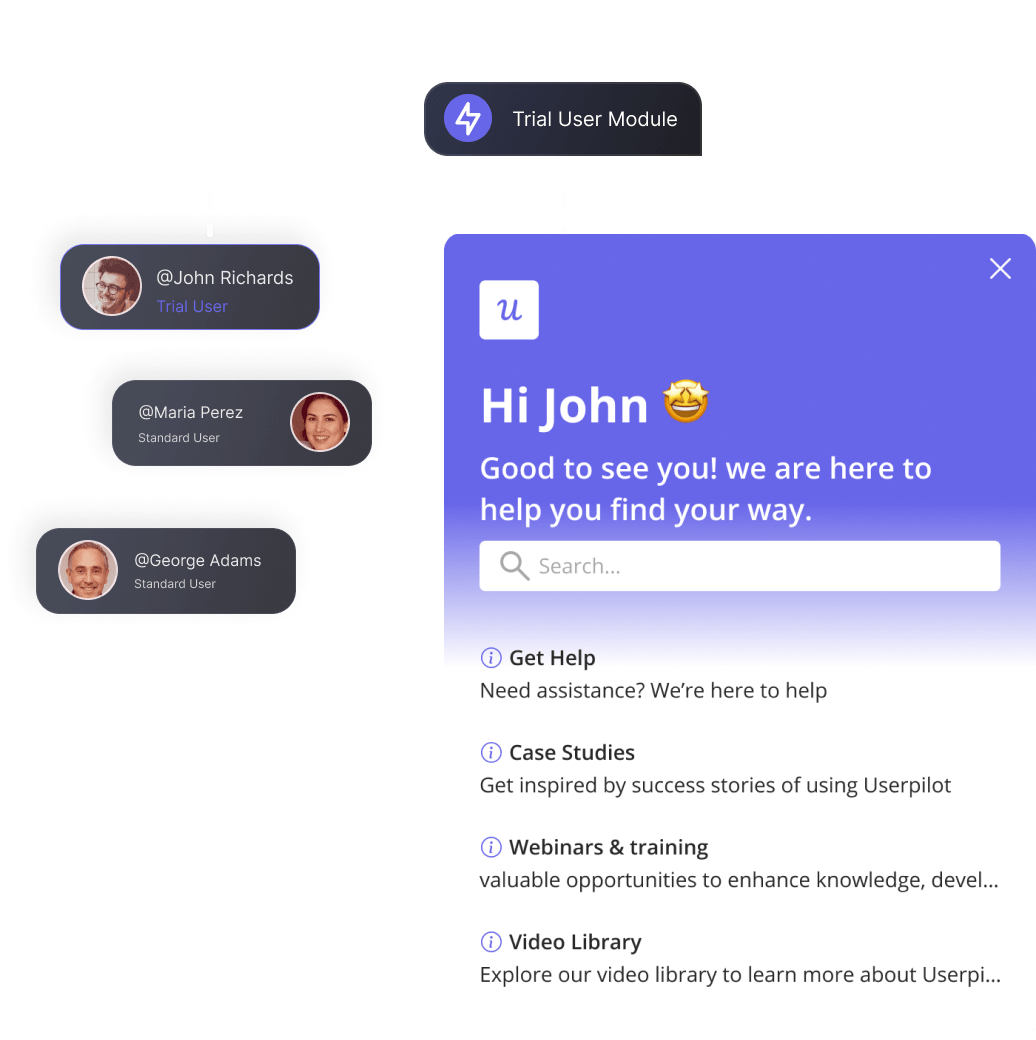
Number of times help and documentation used
This metric tracks how often users access your help content, knowledge base, and support resources. High usage generally signals that users are running into confusion the product itself isn’t resolving. Low usage usually means they’re either finding the product intuitive or they’re giving up and churning instead of asking for help, which is why you want to look at this metric alongside user retention data, not in isolation.
The most useful signal here isn’t the raw count: it’s the pattern.
If specific docs pages spike after you ship a feature, that’s a sign the feature needs better in-app guidance, not more documentation. Optimizing your help content with knowledge base articles, micro videos, and self-service flows is the response to high usage. A resource center built directly into the product is almost always more effective than directing users to an external help site.
Freemium to premium conversion rate
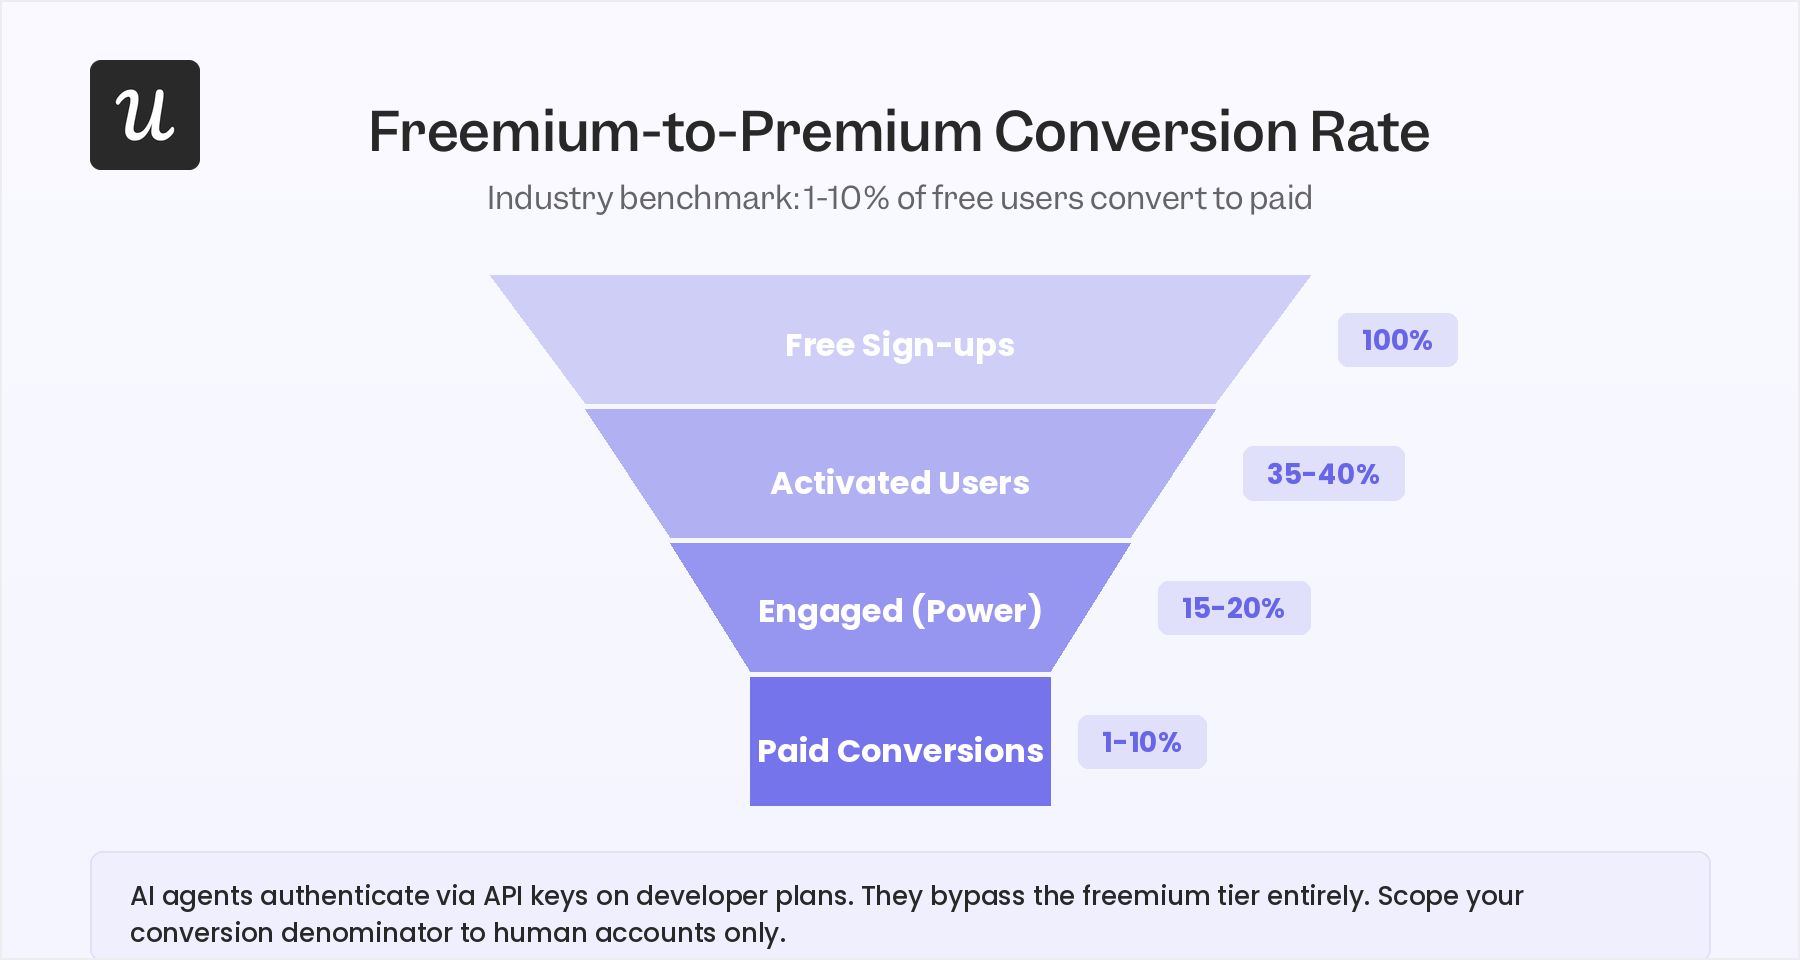
The freemium-to-premium conversion rate is the percentage of free-tier users who upgrade to a paid plan. The average conversion rate in SaaS sits between 1% and 10%, with the variance explained mostly by how well the free tier demonstrates value without giving away the product. A high rate tells you the free experience is landing and your upgrade triggers are working. A low rate usually means the free tier is either too generous or the path to paid value isn’t clear.
Product activation rate
The product activation rate measures the percentage of signed-up users who complete a defined set of key actions that indicate they’ve experienced your product’s core value. It’s the metric that tells you whether customer acquisition is actually producing retained users or just trial accounts. The average user activation rate in SaaS is 35 to 40%, meaning the majority of sign-ups never reach the moment where the product clicks.
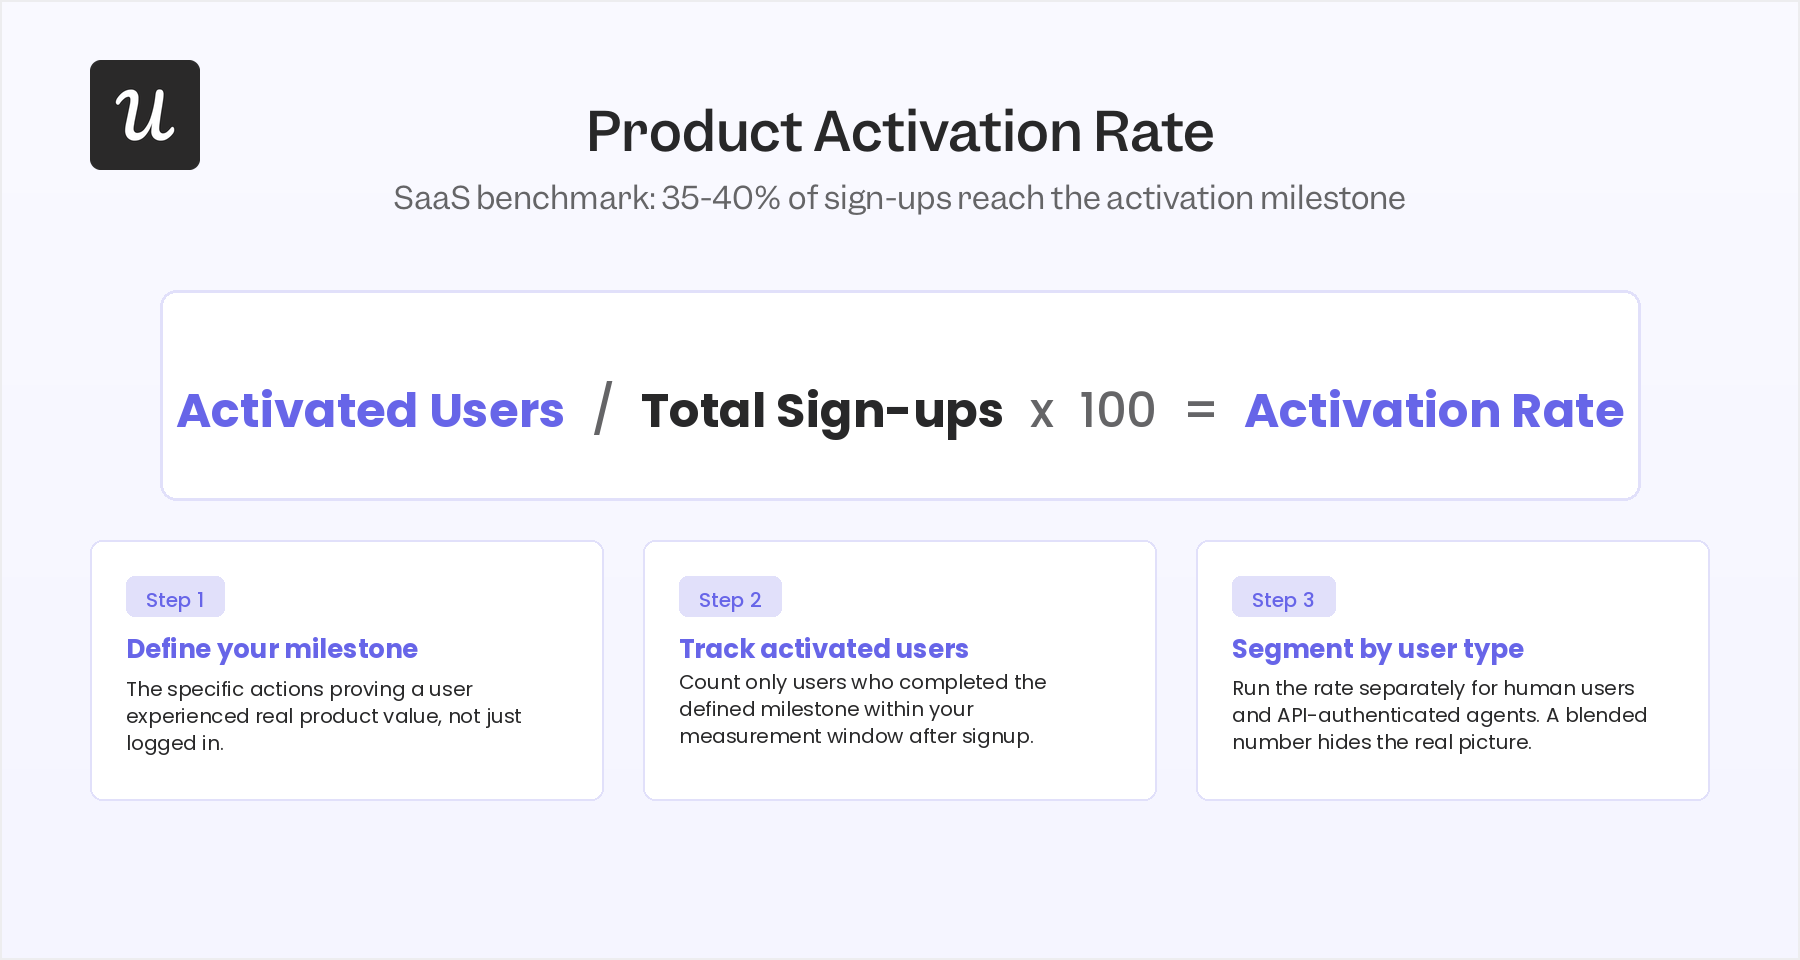
You can calculate activation rate by dividing the number of users who reached your activation milestone by total sign-ups and multiplying by 100. But the number is only useful once you’ve defined your activation milestone precisely: what specific sequence of actions indicates that a user has actually experienced the product’s value, not just logged in.
When the activation funnel shows a sharp drop at a specific step, the fix is often faster than you’d expect. When we launched Userpilot’s email feature, the funnel showed a drop-off at domain verification, a step that’s genuinely technical and easy to get wrong. On noticing this drop-off, I built a targeted tooltip and a checklist directly in Userpilot and deployed them to users who were stuck at that step:
“Within a few hours, I just created a targeting tooltip and showed it to users and highlighted the correct steps for them to make it clear what to do next. That helped a lot on reducing friction and supporting users in real time without involving our dev team.”
Net Promoter Score
The Net Promoter Score (NPS) measures how likely your customers are to recommend your product to someone else, on a scale of 0 to 10. You subtract the percentage of detractors (0 to 6) from the percentage of promoters (9 to 10). The average NPS for SaaS companies sits around 40, though the benchmark varies by segment and maturity stage.
A high product NPS means your users are satisfied enough to stake their reputation on recommending you. A negative NPS is a signal to dig into the qualitative feedback through feedback analysis to understand what’s creating friction.
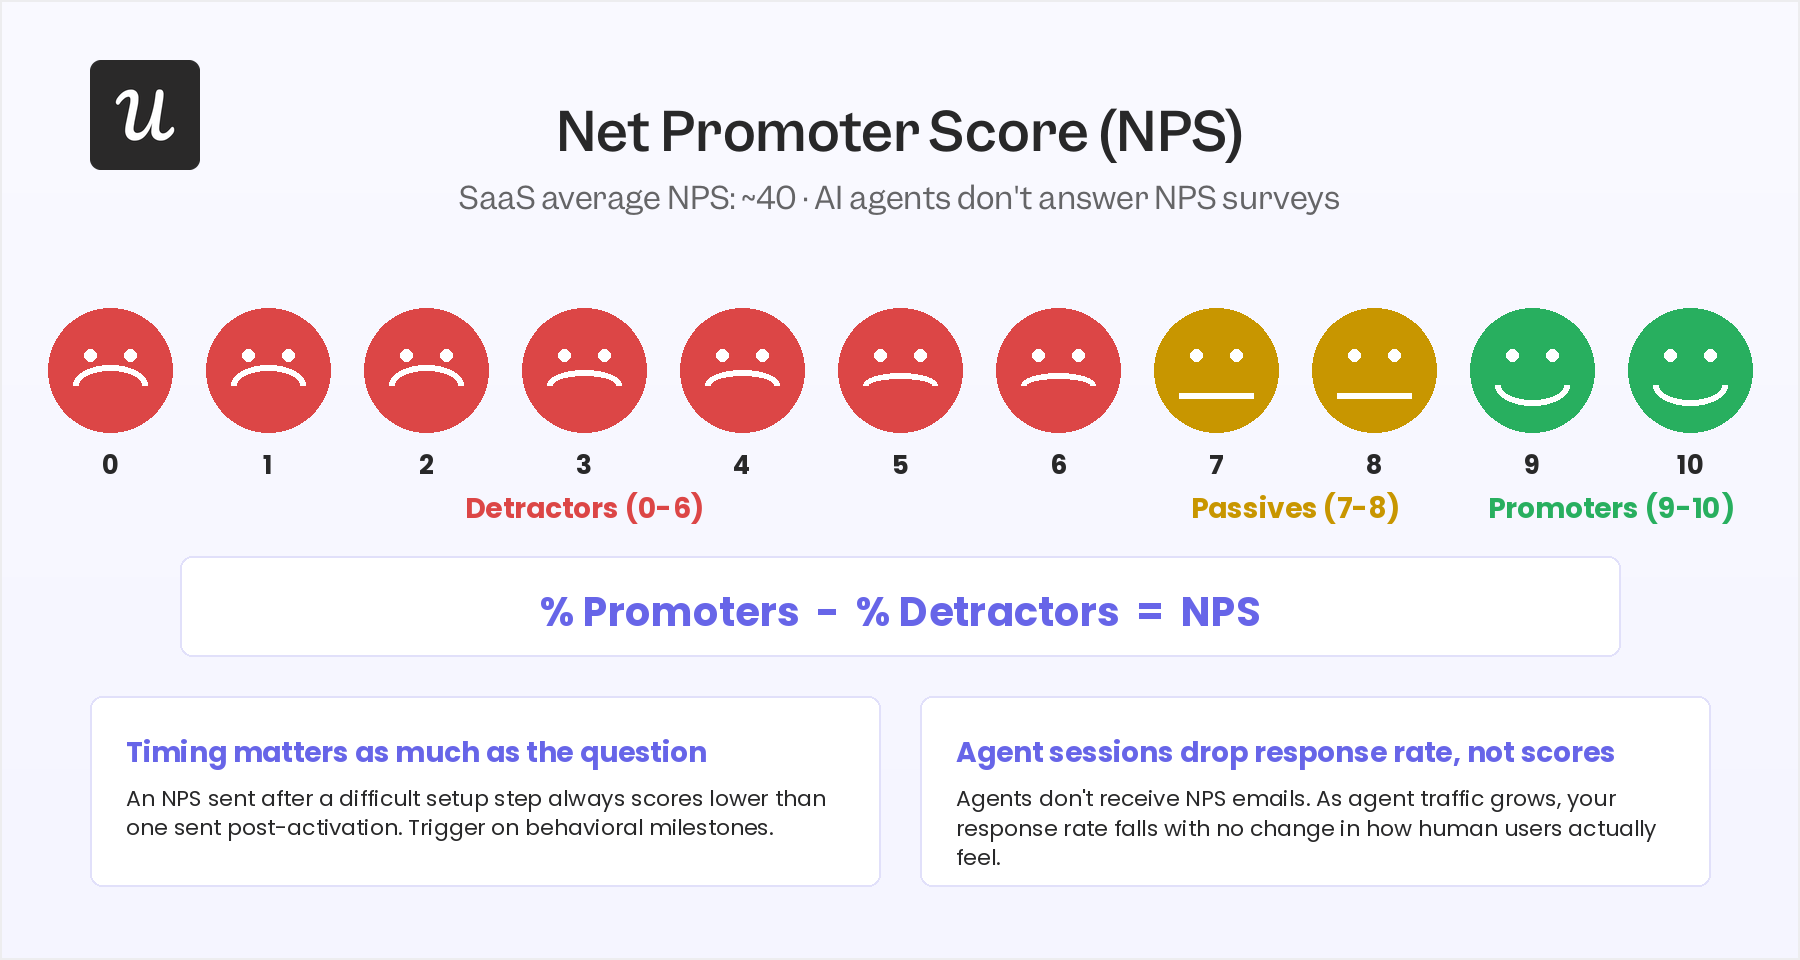
NPS is one of the most widely used behavioral analytics signals because it captures sentiment at a specific moment in the user journey rather than as a one-time survey. The timing of when you send it matters as much as the question itself: an in-app NPS survey sent immediately after a difficult setup step will produce a lower score than the same question sent after the user has shipped their first successful workflow.
How AI agents are changing behavioral KPI measurement
The six metrics above are still the right things to track. But there’s a new user category that doesn’t scroll, click, or hover on elements in your SaaS product.
Agentic traffic doesn’t trigger the events your analytics tool tracks
When a human user navigates your product, they generate a trail of JavaScript events: page views, click events, hover events, form changes. Your analytics tool (Userpilot, Mixpanel, Amplitude, whatever you’re using) was built to capture that trail. AI agents accessing your product through MCP servers or direct API calls don’t generate any of it. They authenticate, call a function, get a response, and disconnect without ever touching your front-end event layer.
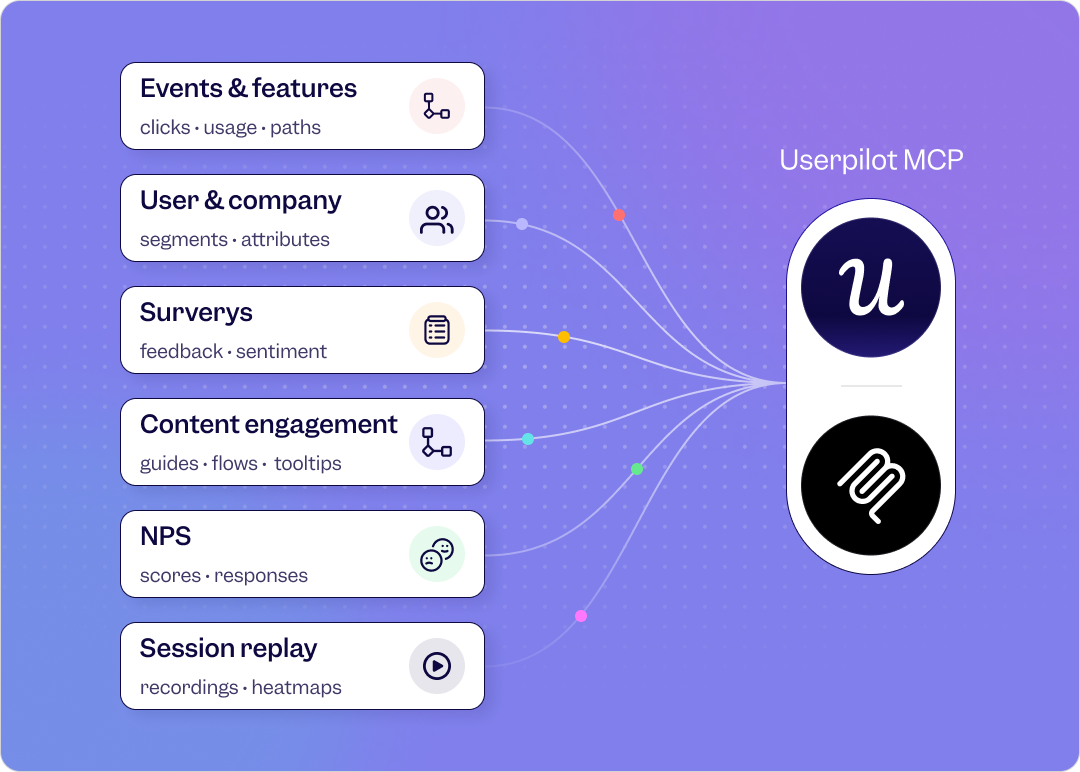
The consequence for behavioral KPIs is a data quality problem. Here’s how each behavioral KPI gets impacted:
-
Time to Value (TTV): Because automated agents complete function calls instantly without experiencing value, their sessions artificially deflate your average TTV and makes human onboarding look more effective than it is.
-
Feature Adoption Rate: Agents target narrow API endpoints rather than exploring your product, which skews your data to show a much lower breadth of feature adoption than your human users actually have.
-
Help Documentation Usage: Since agents never read support articles, a rise in agent traffic will cause your documentation usage rates to drop even if human users remain completely confused.
-
Conversion Rate: AI agents can bypass freemium tiers by authenticating via enterprise API keys, which distorts your total user denominator and requires you to isolate human accounts for accurate conversion calculations.
-
Activation Rate: Agents completely skip onboarding flows, meaning they either register as instantly activated or never activated depending on your metrics, making the data unreliable for product decisions.
-
Net Promoter Score (NPS): Agents cannot receive surveys, so your NPS response rates will only reflect human user sentiment.
The way to separate the two populations is to track API-based sessions and UI-based sessions as distinct streams from the start. API authentication events, endpoint call frequency, and task completion rates are the behavioral KPIs that apply to agent users. Blending them with the human behavioral KPIs is a mistake to avoid.
How Lia turns behavioral KPI tracking into a conversation
While AI agents complicate behavior tracking, they also bring distinct advantages.
Building a custom report in any analytics tool takes time: you define the events, scope the dates, filter the segments, and interpret the output. For routine KPI checks, that overhead is manageable. For fast-moving product decisions, it’s a bottleneck.
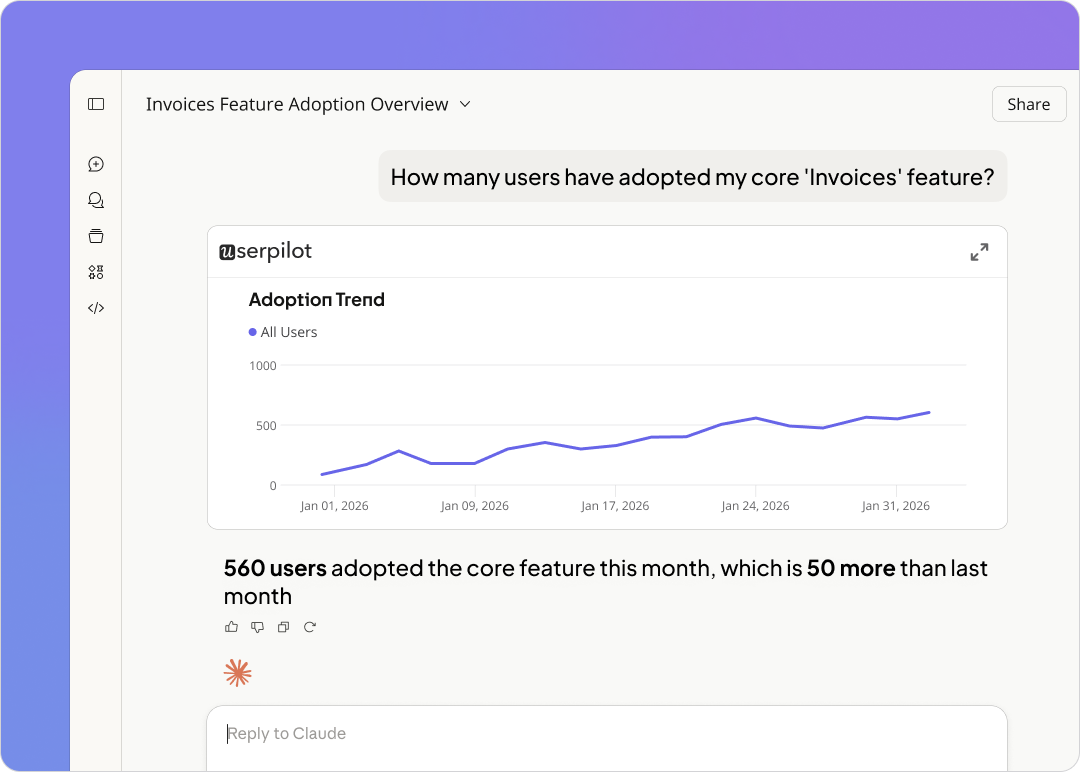
Lia, Userpilot’s AI agent, is designed to sit on top of all of your behavioral data (session replay, NPS scores, product usage events, and survey responses) and lets you query it through conversation. The shift Yazan Sehwail, Userpilot’s CEO, describes is about collapsing that reporting overhead:
“If you as a marketer wanted to see, using session replay, NPS data, survey data, and product usage data, you’re able to get your answer without having to go to Userpilot, without having to pull data and upload it to someone. So this is why MCP is gonna be a game changer.”
For behavioral KPI tracking specifically, this means you can ask Lia what your activation rate looks like this week for users who signed up after the last feature release, without building the report manually. You can ask it which user segment has the longest TTV, or whether NPS scores dropped after a specific product change. The behavioral data is already in Userpilot. Lia is the interface that makes it queryable without an analytics background.
How to track and optimize behavioral KPIs
Here’s how you can easily implement the best practices and strategies for all the behavioral KPI examples we’ve discussed.
-
Feature Tagging: Tracks clicks, hovers, and inputs without custom code to reveal exactly where users spend time and where they lose momentum, helping you uncover overlooked drop-off points.
-
Custom Events: Combine multiple in-app interactions into high-value behavioral signals, allowing you to track multi-step workflows as single milestones and trigger automated, timely user nudges.
-
Behavioral Segmentation: Groups users by their actual actions rather than firmographic traits, making it possible to deliver targeted onboarding flows and identify churn risks by pairing usage patterns with survey responses.
-
Consolidated Product Analytics: Fast querying of funnel reports and event trends across one unified dashboard eliminates data wrangling, allowing you to quickly trace a dropping metric from the funnel report down to the individual session replay.
-
Lia AI Querying: Provides a conversational interface to your behavioral data, allowing you to ask direct questions and get immediate answers without needing to build traditional, time-consuming reports.
The behavioral KPIs do the triage work: they tell you a problem exists and narrow down where. Lia accelerates that triage by letting anyone on the team query the data conversationally, without requiring them to know how to build a funnel report. The qualitative research that follows is more targeted and faster to execute because the behavioral context is already there.
Start tracking behavioral KPIs for your SaaS
The six behavioral KPI examples above have been the product analytics standard for years, and they still are, with one important update for 2026. They were designed for human users, and your product now has a growing population of AI agents that don’t behave like humans. Getting accurate data-driven decisions from behavioral KPIs means knowing which product success metrics apply to which population and tracking them separately.
Userpilot lets you capture behavioral events from human sessions and query them through Lia without building reports from scratch every time. If you want to see how that works in practice, get our 14-day free trial and see what your current behavioral data looks like.
FAQ
What is the difference between behavioral KPIs and performance KPIs?
Performance KPIs typically measure outputs: revenue, conversion rate, customer acquisition cost, and gross profit margin. Behavioral KPIs, on the other hand, measure the actions that generate those outputs: how users navigate your product, how quickly they reach value, and how often they return. Performance KPIs are lagging indicators that confirm what happened. Behavioral KPIs are leading indicators that tell you what’s about to happen to your performance metrics.
Which behavioral KPI is most important for SaaS products?
Product activation rate is the highest-leverage behavioral KPI for most SaaS products because it directly predicts retention and expansion revenue. A user who activates is exponentially more likely to stick around, upgrade, and recommend the product than one who signed up and never reached their first meaningful outcome. If you had to pick one behavioral KPI to optimize first, start with activation. Everything downstream gets better when you fix that step.
How do behavioral KPIs change when AI agents use your product?
The six behavioral KPIs themselves don’t change: they’re still the right things to measure. What changes is that you need to run them on two separate user populations: human users and AI agents. Agents don’t respond to NPS surveys, don’t go through onboarding flows, and don’t generate UI events. Including agent sessions in your human behavioral KPIs produces numbers that look fine but reflect a mix of two completely different usage patterns.
About the author