What is Time-to-Value & How to Improve It + Benchmark Report 2024


According to our Product Metrics Benchmark report, the average Time-to-Value (TTV) in SaaS is about 1 day, 12 hours, and 23 minutes.
But how does your business fare against companies in your industry or at the same revenue stage?
Let’s explore our product metrics benchmark and learn:
- What Time-to-Value is and its significance for SaaS businesses.
- Key TTV benchmarks across various segments.
- Effective strategies to shorten TTV and boost user engagement.
Time-to-value benchmark metrics
- Time-to-value (TTV) is the duration it takes for a new user to experience the core value of a product, indicating the efficiency of the onboarding process.
- TTV directly impacts customer relationships, leading to benefits like accelerated onboarding, increased satisfaction, reduced churn, enhanced retention, improved customer success efficiency, and faster revenue growth.
- The average TTV for SaaS companies is 1 day, 12 hours, and 23 minutes. It has significant variations across different segments, including:
- By industry: Different industries show varying TTV benchmarks, with CRM & Sales achieving faster TTVs due to straightforward onboarding processes. While industries like Insurance and Martech have longer TTVs due to the complexity of their products.
- By company size: Smaller companies often have shorter TTVs due to agility and focused engagement strategies. While larger companies face challenges scaling onboarding.
- By growth model: Sales-led growth (SLG) companies exhibit slightly shorter TTV compared to product-led growth (PLG) companies. Probably due to personalized onboarding and support, while PLG models rely on independent user exploration.
- Here are some effective strategies to shorten TTV:
- Streamline your onboarding process with interactive walkthroughs: Implement interactive walkthroughs to reduce friction and guide users through initial setup and key features.
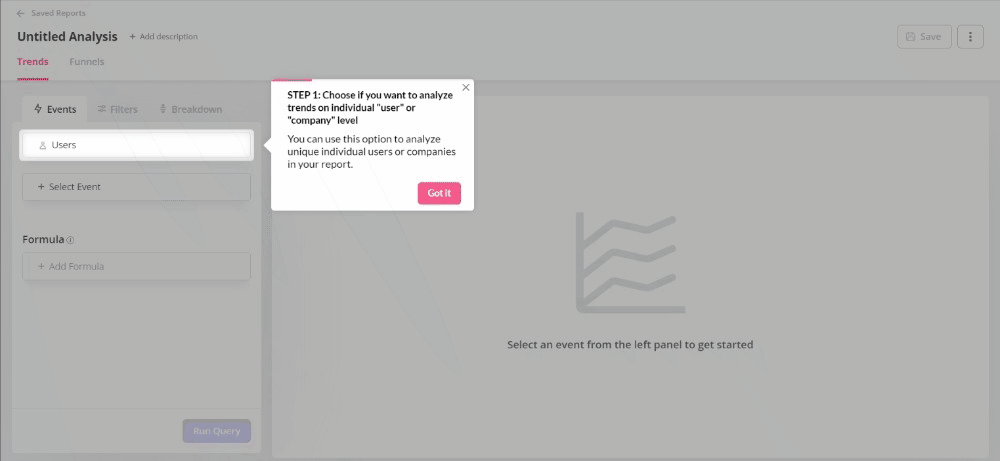
- Identify and remove friction points: Use analytics tools to identify and address points of friction in the onboarding process, making it smoother and reducing TTV.
- Provide continuous support with a resource center: Create an in-app resource center to offer immediate support and prevent users from leaving the app.
- Why not book a Userpilot demo today to see how you can control the onboarding process without coding?
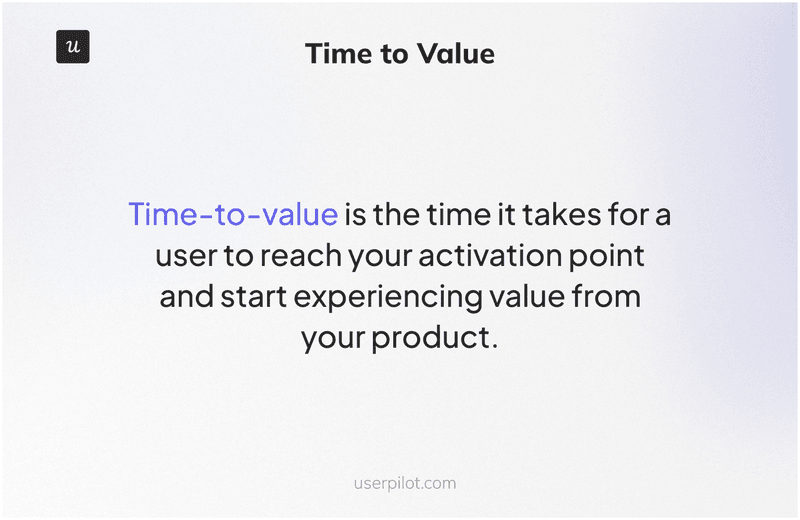
What is Time to Value?
Time to Value (TTV) is the duration it takes for a new user to experience the core value of a product after starting to use it. It measures how quickly a product can deliver its promise to users, indicating the efficiency and effectiveness of the onboarding process.
Why is Time to Value important for SaaS businesses?
Time-to-value (TTV) directly impacts user satisfaction and retention. The shorter your TTV, the quicker users can see the benefits of your product.
This way, you can meet customer expectations and foster a positive relationship right from the start—leading to multiple benefits, including:
- Accelerated user onboarding and adoption.
- Increased customer satisfaction by delivering quick wins.
- Reduced churn rates by engaging users early.
- Enhanced product stickiness and long-term retention.
- Improved the efficiency of customer success teams.
- Faster revenue realization and growth.
What is an average TTV for SaaS companies?
Understanding the average TTV in SaaS can provide valuable benchmarks to gauge your performance and see where you can improve.
That said, let’s explore the results from our product metrics benchmarks and see what the TTV statistics say. Here are the general numbers:
- Average Time to Value (Activation): 1 day, 12 hours, 23 minutes.
- Median: 1 day, 1 hour, 54 minutes.
- Standard Deviation (SD): 1 day, 9 hours, 28 minutes.
Plus, here are the ranges within 1 Standard Deviation:
- Low “norm” range (1 SD above the mean): From 1 day, 12 hours, 23 minutes to 2 days, 21 hours, 51 minutes.
- High “norm” range (1 SD below the mean): From 2 hours, 55 minutes to 1 day, 12 hours, 23 minutes.
In a nutshell, the average TTV indicates that users generally experience the core value of a product within a day and a half. The median TTV, being slightly lower than the average, suggests that many companies can deliver value even faster.
Now let’s go deeper and look at the average TTV among different segments to find more nuanced insights:
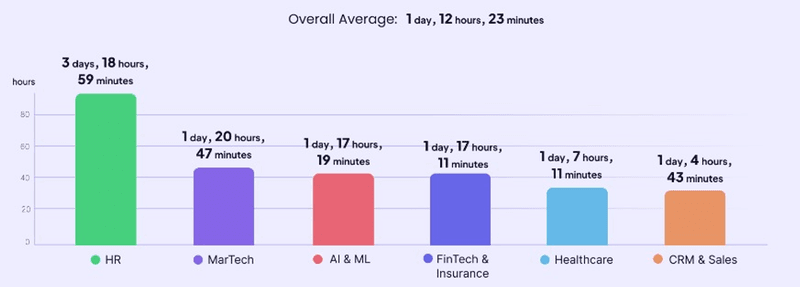
Average TTV by industry
As expected, different industries exhibit varying TTV benchmarks due to the nature of their products and user expectations.
However, the differences aren’t actually drastic. Here’s how different industries performed:
- HR: 3 days, 18 hours, 59 minutes.
- Martech: 1 day, 20 hours, 47 minutes.
- Fintech and Insurance: 1 day, 17 hours, 11 minutes.
- Healthcare: 1 day, 7 hours, 11 minutes.
- CRM & Sales: 1 day, 4 hours, 43 minutes.
- AI & ML: 1 day, 17 hours, 19 minutes.
💡 Note: Only one HR company with a niche (a job marketplace for developers) was tracking time-to-value, so it might not be representative of the rest of the industry.
That said, industries like CRM & Sales achieve faster TTVs, likely due to their more straightforward onboarding processes and immediate utility in business operations. Plus, industries such as Insurance and Martech exhibit longer TTVs, possibly due to the complexity and customization required in these sectors.
So, considering that these industries present a TTV higher than a day, following industry-specific strategies might not be the most impactful factor (although still required to stay as efficient as possible).
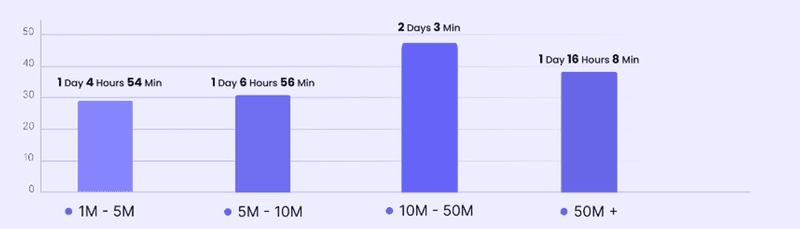
Average TTV by company size
Company size does present a significant impact on TTV, with smaller companies often enjoying more efficient onboarding processes.
But there’s a twist; here are the TTV statistics segmented by company size:
- $1,000,000 – $5,000,000 annual revenue: 1 day, 4 hours, 54 minutes.
- $5,000,001 – $10,000,000: 1 day, 6 hours, 56 minutes.
- $10,000,001 – $50,000,000: 2 days, 3 minutes.
- $50,000,001+: 1 day, 16 hours, 8 minutes.
The data suggests that companies tend to have a higher TTV as they grow, and then improve a little after surpassing the $50M milestone.
This is probably because smaller companies are more agile and focused on customer engagement strategies. While mid-sized companies often face challenges scaling their onboarding processes as they grow in size, leading to longer TTVs.
However, large companies can leverage their resources to streamline onboarding with dedicated teams and so on—resulting in relatively shorter TTVs despite their size.
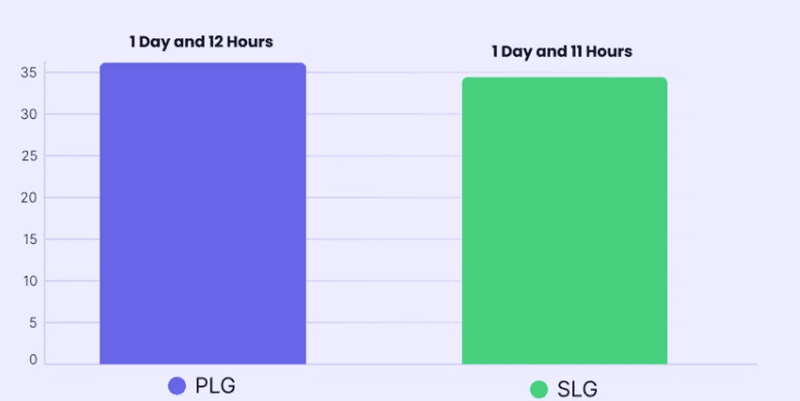
Average TTV by PLG and SLG
We also segmented our sample by their growth strategy to see if it also influences TTV.
That said, the TTV statistics segmented by Product-Led Growth (PLG) and Sales-Led Growth (SLG) strategies resulted as follows:
- PLG: 1 day, 12 hours.
- SLG: 1 day, 11 hours.
Surprisingly, SLG companies exhibit a slightly shorter TTV compared to PLG companies. This might be due to the personalized onboarding and support provided in SLG models, which can accelerate the realization of value.
On the other hand, PLG models rely on users exploring the product independently, which can sometimes extend the TTV.
How to shorten Time-to-Value?
Reducing TTV is crucial for enhancing user satisfaction and driving faster revenue growth. Here are some effective strategies to shorten TTV:

Streamline your onboarding process with interactive walkthroughs
An efficient onboarding process can significantly reduce friction and help users achieve the activation stage faster.
For this, implementing interactive walkthroughs can guide users through initial setup and key features without overwhelming them with information they won’t retain.
Here’s how you can do it:
- Highlight Key Features: Focus on the critical functionalities that provide immediate value to users, helping them understand the product’s benefits quickly.
- Use Onboarding Tools: Employ no-code platforms that provide customizable walkthroughs (like Userpilot, to guide users through essential tasks.
- Provide Contextual Assistance: Trigger the walkthroughs contextually as users navigate the platform, addressing their potential questions in real-time.
For example, a project management tool might use interactive walkthroughs to guide new users through setting up their first project, adding team members, and assigning tasks—ensuring they quickly understand the core functionalities.
Identify and remove friction points
Friction will inevitably increase TTV, so analyzing user behavior to identify and address points of friction can help you make the onboarding process smoother.
This involves using analytics tools to gather insights into user interactions and their journey through the product.
- Path Analysis: Understand common user pathways and where they encounter obstacles.
- Funnel analysis: Track how users interact via predesigned funnels and at which steps they drop off.
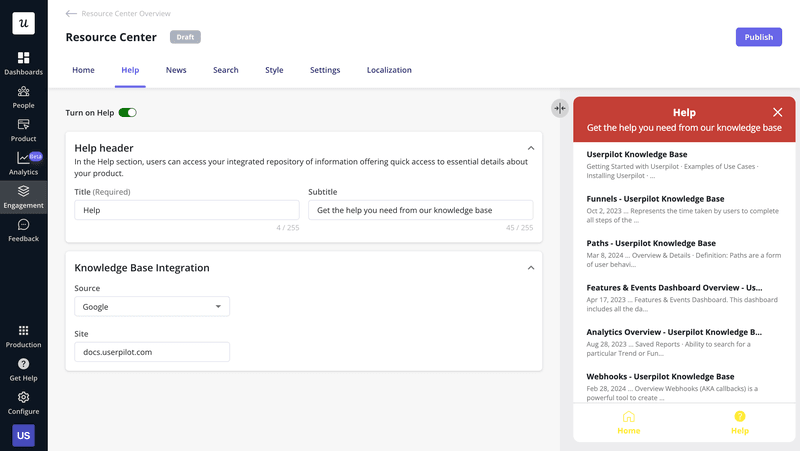
Provide continuous support with a resource center
A great opportunity to offer a top-notch user experience and reduce TTV is through an in-app resource center. It prevents users from leaving your app to solve their issues and experiencing friction.
That said, the process to create an effective knowledge base is simple:
- Identify common issues that make customers drop off and disengage.
- Survey your users, review your support tickets, and examine your usage data to see what’s causing friction and pushing customers away.
- Create help resources in different formats to directly tackle these challenges. It can include FAQs, tutorial videos, step-by-step guides, or help articles.
- Organize your resources in content modules so users can find resources that are relevant to them.
For instance, a SaaS analytics tool might offer a resource center with tutorial videos on generating reports, FAQs about data integration, and step-by-step guides on customizing dashboards.
Conclusion
Time-to-Value (TTV) is a crucial metric for SaaS businesses, as it can directly impact user satisfaction and retention.
By learning from our benchmarks and applying good practices, you can deliver value faster, enhance user engagement, and drive growth.
That said, why not book a Userpilot demo today to see how you can control the onboarding process without coding?
About the author