
Period-over-period analysis is one of the key ways to drive sustainable SaaS growth.
The data obtained from the process lets you adapt and refine your strategies, ensuring you make proactive moves to improve key growth metrics.
This article shows you:
- Five simple steps to perform period-over-period analysis.
- How to choose the date range for your analysis?
- The best visualization types to make actionable decisions from your analysis.
Try Userpilot Now
See Why 1,000+ Teams Choose Userpilot

What is a period-over-period analysis?
Period-over-period (PoP) analysis is a business intelligence technique that compares metrics in a recent period to the same period in the past. The analyses are typically conducted over sequential periods such as months, quarters, or years.
You can use PoP analysis to measure key metrics like adoption, retention, customer lifetime value, etc. The main advantage here is that you’ll keep tabs on business performance and have enough data to make changes where necessary.
How to conduct a period-over-period analysis with Userpilot
Userpilot’s robust analytics features let you conduct PoP analysis and collect valuable data to inform strategic decisions. Here’s a 5-step process on how to begin:
1. Select the metrics you need to analyze
Begin by identifying the KPIs that align with your business objectives. These might include metrics like revenue growth, user growth, user engagement, customer satisfaction, churn rates, and other relevant indicators tied to your product’s growth.
Ensure the metrics you choose directly contribute to your overarching goals or at least represent your current needs as a company.
2. Determine the right analysis report to use
Once you have selected the metrics to analyze, you need to determine the analysis report to employ.
Userpilot offers Trends, Funnels, and Retention analysis reports, depending on your goal. You’ll find these under the Analytics menu, as shown in the image below.
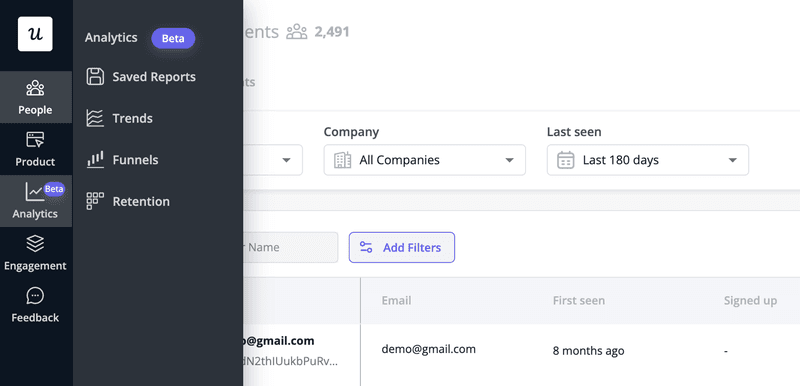
Click on any of the analytics to begin tracking. If you’re unsure, here’s a brief overview of what each analysis type does:
Trend analysis
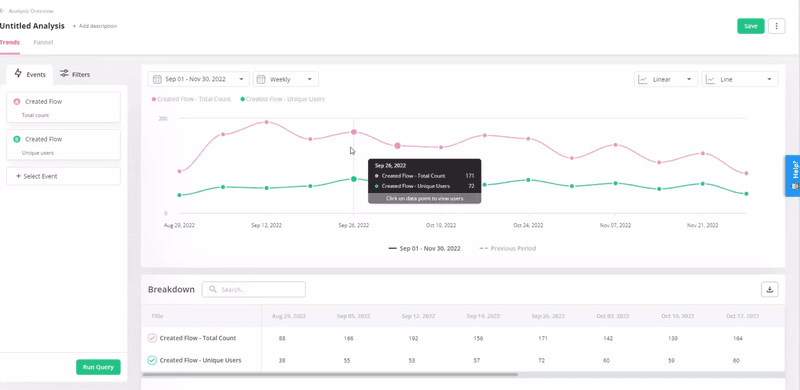
Userpilot’s trend analysis helps you track day-to-day changes in key metrics. By examining trends reports, you can see the rise and fall of each KPI, allowing you to spot abnormalities easily.
This report is particularly useful when you make changes to your product or conduct an experiment and want to see how it impacts results. Generally, you can use trends analysis to track changes in user growth, revenue growth, product adoption, etc.
Funnel analysis
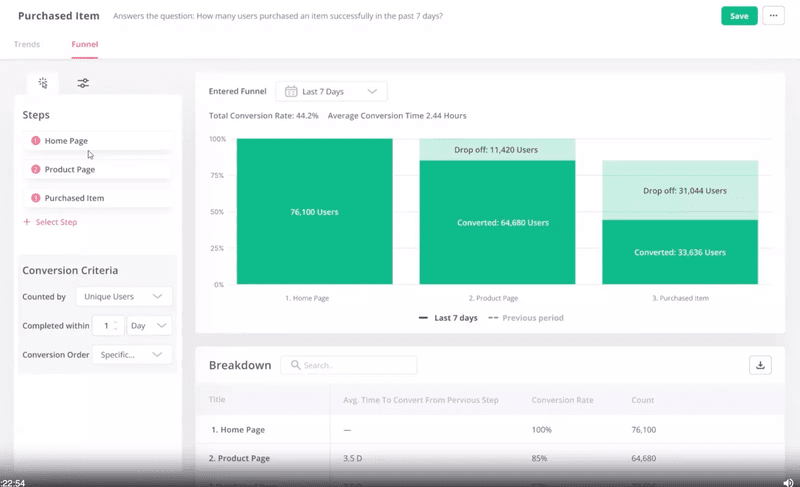
A funnel analysis shows you conversion rates and progress at each predefined step.
Conduct funnel analysis at your most critical conversion points to track friction and monthly drop-offs. With this, you’ll spot changes and make quick adjustments. For instance, if you noticed a drop in conversion from the previous month, you can investigate further and find if it’s a technical issue or if users are simply finding your tool difficult to use.
Armed with this information, you’ll make changes to enhance the user experience and improve conversion.
Retention analysis
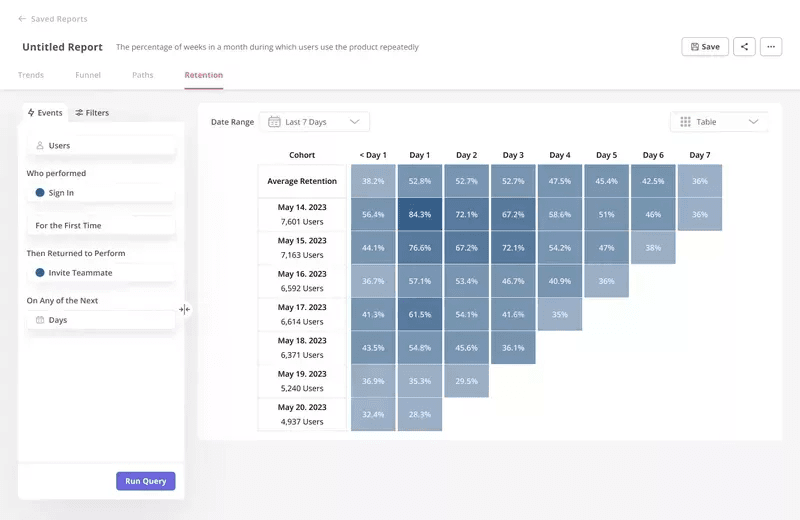
Implement retention analysis to understand user loyalty and engagement over consecutive periods.
By examining different cohorts and their retention rates, you can identify patterns and changes in user behavior. For instance, assessing how well your product retains users from one month to the next or from one quarter to the next provides actionable insights into the effectiveness of your retention strategies.
To gain granular insights, you can check retention for each of your events. If retention is low over time, you can make the features in question more valuable, motivating users to engage more.
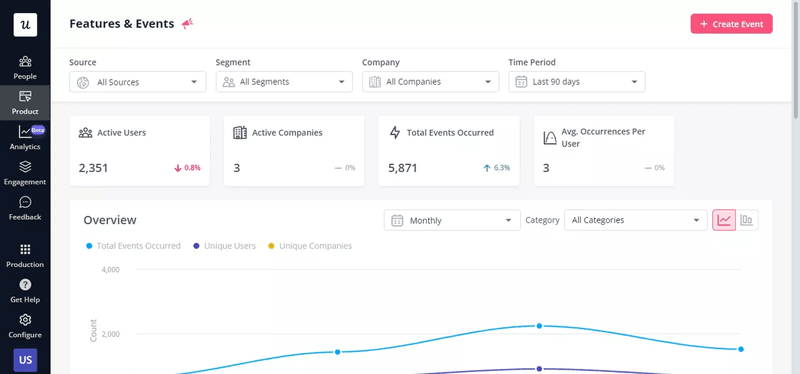
Feature usage analysis
Use this report to track feature usage, discovery, and engagement for your SaaS. You can also use feature usage analysis to track events, allowing you to get deeper insights into user behavior.
By comparing feature usage metrics between different periods, you can gauge the success of feature releases and updates. This insight is pivotal for prioritizing development efforts, optimizing user experiences, and tailoring growth strategies to highlight the most valued features.
3. Customize data points
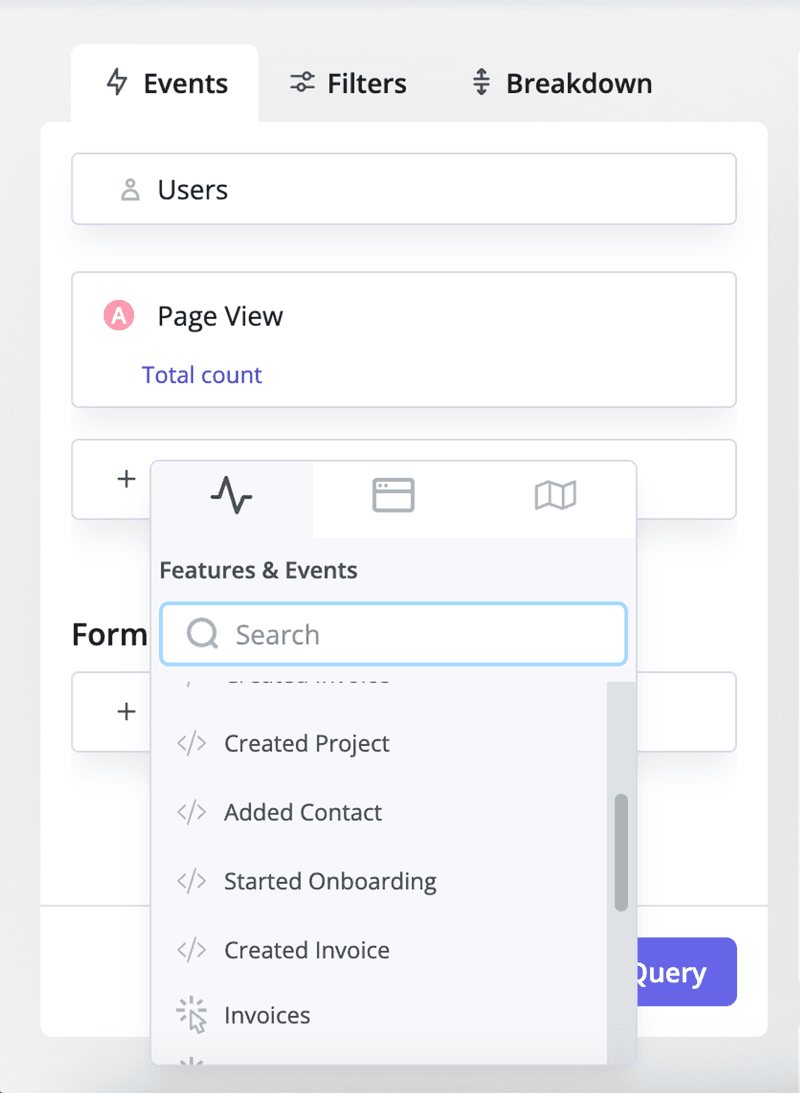
Include various event data points in your analysis to track all your important metrics in one comprehensive view. You could also compare two or more metrics to see how one performs against the other.
Some examples of what you could track in your period-over-period analysis:
- Page views: Keep a vigilant eye on page views over time to swiftly identify fluctuations in feature engagement.
- New users: Gauge the growth in new accounts as it evolves over time, providing insights into the trajectory of user acquisition.
- Added users: How many accounts are inviting team members to collaborate?
- Session duration: How long are users engaging with your app?
- Custom events: How many users are creating key events—specific to your product—that drive product adoption?
Measuring your most important metrics will let you get actionable insights for proper decision-making. For instance, when you track session duration, you can filter it for new users and see how valuable they find your solution. If new user engagement drops over time, that’s a sign you need to dig further and address the issue before churn happens.
4. Select the date range for the time periods you want to analyze
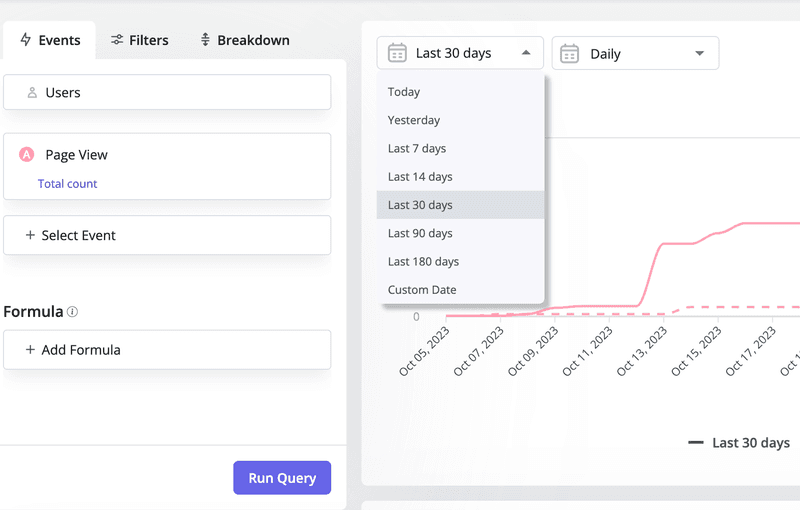
Userpilot lets you analyze your metrics over different periods. You can do it weekly, monthly, quarterly, yearly, or any custom date of your choice.
The date range you choose boils down to your goals.
Tracking week-by-week performance is helpful for internal team meetings. You can use the data to discuss how small enhancements are improving user engagement and how to pivot.
When you just rolled out new features or in-app flows, weekly performance tracking won’t cut it because the date range is too short to notice any significant difference. Compare monthly instead.
When it comes to revenue growth, it’s best to track monthly and yearly. Doing this will give you a short and long-term view of your company’s health and progress.
That said, when unsure of the date range to use, just experiment. Start with weekly tracking and increase the range if the 7-day period doesn’t deliver the results you need.
5. Use the previous time period option to compare data points visually
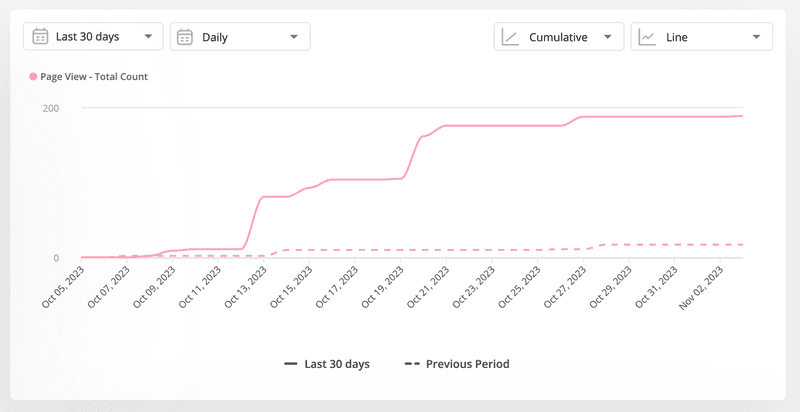
This feature on Userpilot lets you check performance for two time periods in one place. By visualizing the result, it becomes easier to make data-driven decisions.
Consider this page view analysis. Notice how the current period (straight line) outperforms the previous period (broken line). By seeing these results, you can know you’ve made much progress in the past 30 days, and your strategies have worked.
Period-over-period analysis visualization types
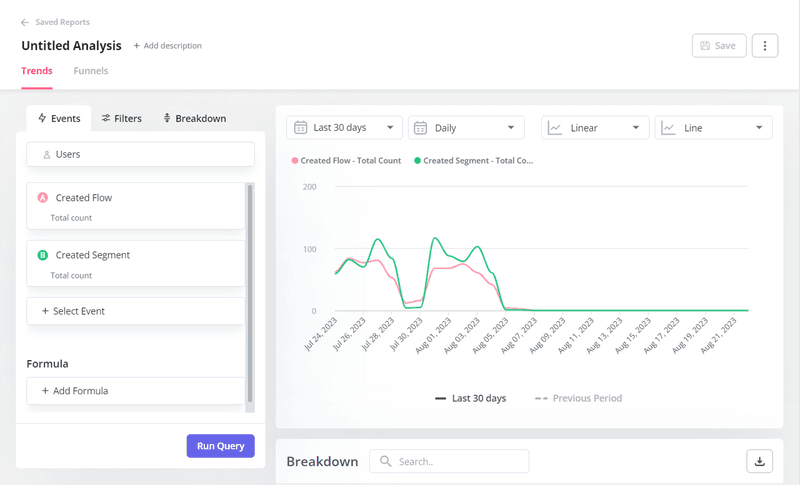
We touched a little on PoP visualization in the previous section. When you check the last image closely, you’ll see a tab for “line” at the top right. By clicking it, you can change from the line chart to your preferred chart type. Here are the different styles you can choose from:
Line graph
The upside of line graphs is that they let you track data points over short periods. You can see day-to-day changes and quickly spot ups and downs in data.
For example, if you own a project management tool, you could track how many users are creating specific tasks daily. This gives you an idea of your daily active users. If you want, you can then compare your daily active users (DAU) with your monthly active users (MAU) to understand product stickiness.
Bar charts
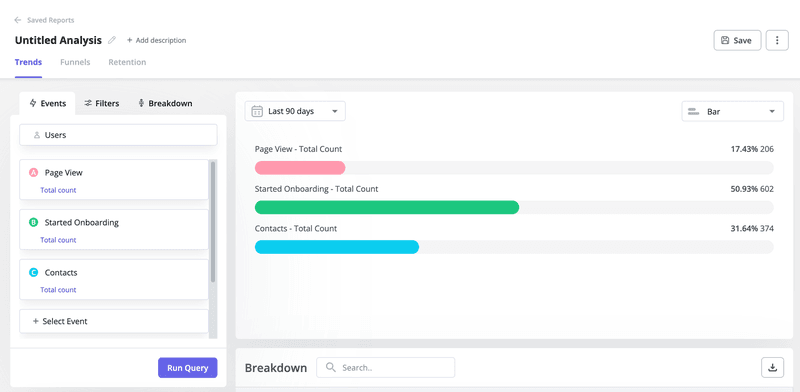
Bar charts are ideal when comparing multiple data values at the end of a period.
This visualization type won’t show you insights regarding day-to-day changes, but you can see cumulative data and know what exactly happened.
For example, the chart below compares the contacts added with how many got onboarded and how many visited certain pages.
Pie chart
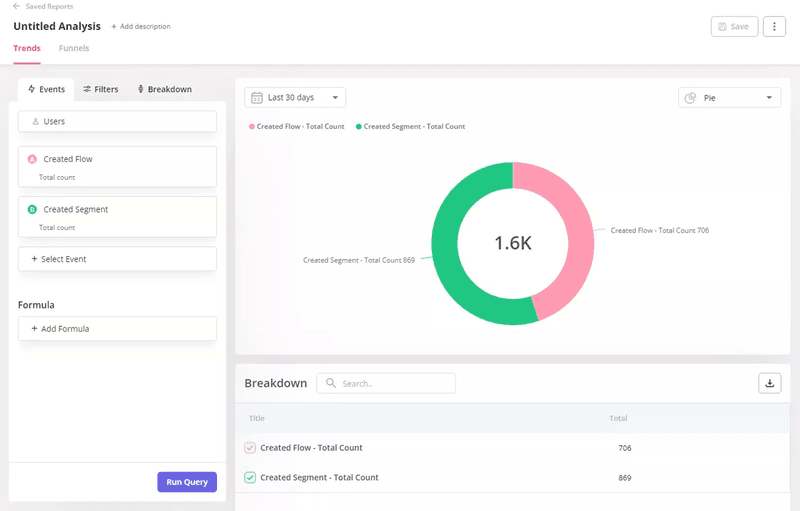
This visualization type is perfect when comparing different data values in the same category at the end of a period. A good use case of this is when comparing free customers with paid customers in a given period.
Here’s another example comparing users who created a flow vs those who created a segment in 30 days.
Conclusion
Whether it’s measuring user retention, optimizing conversion funnels, or gauging the impact of feature releases, PoP analysis provides a roadmap for informed decision-making.
To be effective, ensure you choose your metrics and report types meticulously. Also, compare different data points so you get a comprehensive understanding of what’s going on in your product.
Ready to get started with period-over-period analysis? Book a Userpilot demo now to choose your preferred time period and begin tracking.


