Actionable Analytics 101: How to Collect and Use Actionable Data Insights in SaaS
If you are wondering how actionable analytics can help you boost product growth in 2023, this post is for you!
In this article, we cover everything about different types of actionable analytics, how to collect those actionable insights and the best tools you can use to harness the analytical data.
Let’s get started.
Try Userpilot Now
See Why 1,000+ Teams Choose Userpilot

What is actionable data in data analytics?
Actionable data in data analytics are the insights that are ready to be implemented into improvements. The data is processed into a format that you can easily access and understand.
Which analytics can provide actionable insights?
Four main types of customer data can provide actionable insights:
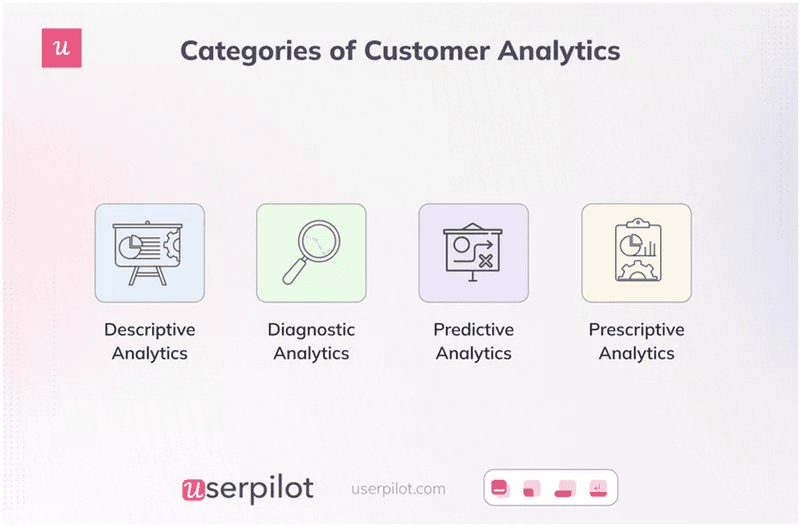
Descriptive analytics
Descriptive analytics makes sense of historical data about customers. It gives insights into trends and patterns by considering past actions within your product. It also gives you valuable feedback on how different user segments behave. That way, you can enhance your decision-making when improving your product.
For example, when analyzing your historical data, you may notice that your enterprise customers have a pattern of churning after onboarding. You can assume that your onboarding experience is not tailored to their enterprise-specific needs.
Going forward, create and trigger a customized onboarding flow for them. You can A/B test your onboarding flows to see which one reduces friction and result in a higher conversion rate.
Descriptive analytics tools
Business intelligence tools like Power BI, Tableau, and Google Analytics can simplify many steps of the descriptive analytics process.
Power BI is a business intelligence and data visualization software that uncovers insights into your enterprise data.
Tableau is a visual analytics platform for business intelligence as well. It helps you gather and visualize data so your team can understand it better.
Google Analytics is a free web analytics tool that tracks your website performance based on factors such as site traffic, user behavior, and advertising ROI.
Are your analytics actually actionable?
Data is useless if you can’t use it to improve your product. Take this 4-step assessment to see if you’re getting real value from your actionable analytics.
Diagnostic analytics
Diagnostic analytics involves finding the root cause behind customer data trends. After collecting data, diagnostic analytics uses data mining to interpret the metrics and make sense of the “why” behind them.
It is helpful for businesses because you can take action on your data and improve the product with insights into the reasons behind data trends.
For example, after surveying customers, you may find that the customer satisfaction score for a specific feature is low. With diagnostic analysis, you can learn the reasons behind such a low score: the feature may have a bug, may not be functional enough, or doesn’t provide the value expected.
Diagnostic analytics tools
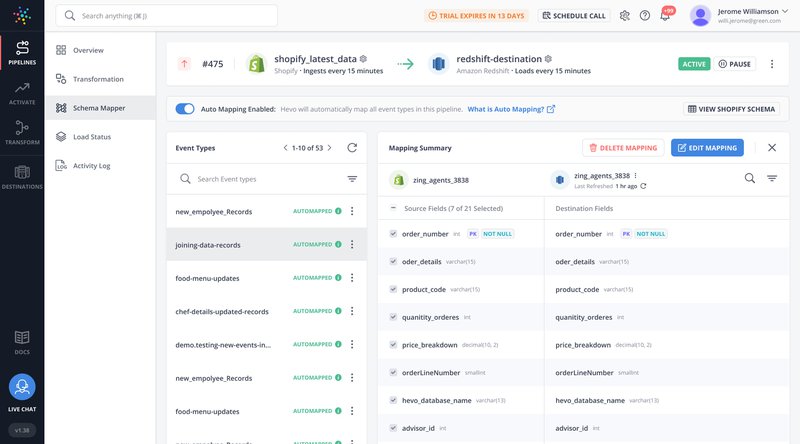
HEVO is a diagnostic analytics tool that uses an end-to-end data pipeline platform to give you business insights.
Predictive analytics
Predictive analytics is a strategic process of projecting future results based on current and past data.
It’s excellent for helping decision-makers shape the future of a product by reviewing what happened in the past (especially within specific user segments).
For example, say that your sales are projected to drop in the next quarter. You can use predictive analytics to understand why sales are expected to drop (based on current and previous trends) and then be proactive to prevent the drop.
Predictive analytics tools
There are a few great predictive analytics tools on the market to make the job easier.
H2O Driverless AI uses machine learning workflows to help you make business and product decisions. It has capabilities such as feature engineering, data visualization, and model documentation – all with the help of artificial intelligence.
IBM Watson Studio is another tool that uses machine learning models and data visualization to help you make business decisions. It uses all four styles of actionable analytics – descriptive, diagnostic, predictive, and prescriptive.
Microsoft Azure Machine Learning is a data science tool that helps you create machine learning models at scale so you can prepare data, build and train models, deploy, and then monitor results.
Prescriptive analytics
Prescriptive analytics offers recommended next steps based on relevant data. This type of actionable insight is helpful for both marketing and product teams who need to know the best path forward.
For example, marketing teams can use prescriptive analytics to get recommendations on the best channels they should use. That way, they can double down on what works and do less of what doesn’t.
Prescriptive analytics tools
There are three main prescriptive analytics tools that you should consider.
Improvado is a tool that centralizes your marketing and sales data in one easy-to-access dashboard, pulling actionable insights for future campaigns.
Alteryx is a platform for data scientists and data analysts. It also centralizes data in one place and then runs a statistical analysis to help you decide on the best course of action.
RapidMiner is an AI prescriptive analytics platform that processes all the data you collect so you can create predictive models that help you make business decisions.
How to collect actionable insights for data-driven decisions in SaaS
Here are eight ways to collect actionable insights from your data in SaaS:
Track product usage data with click tracking
Click tracking helps you see usage patterns, such as which features are more popular than others.
To complete click tracking, employ Userpilot’s feature tagging to tag different UI elements in your product and see how users interact with them (clicks, hovers, etc.).
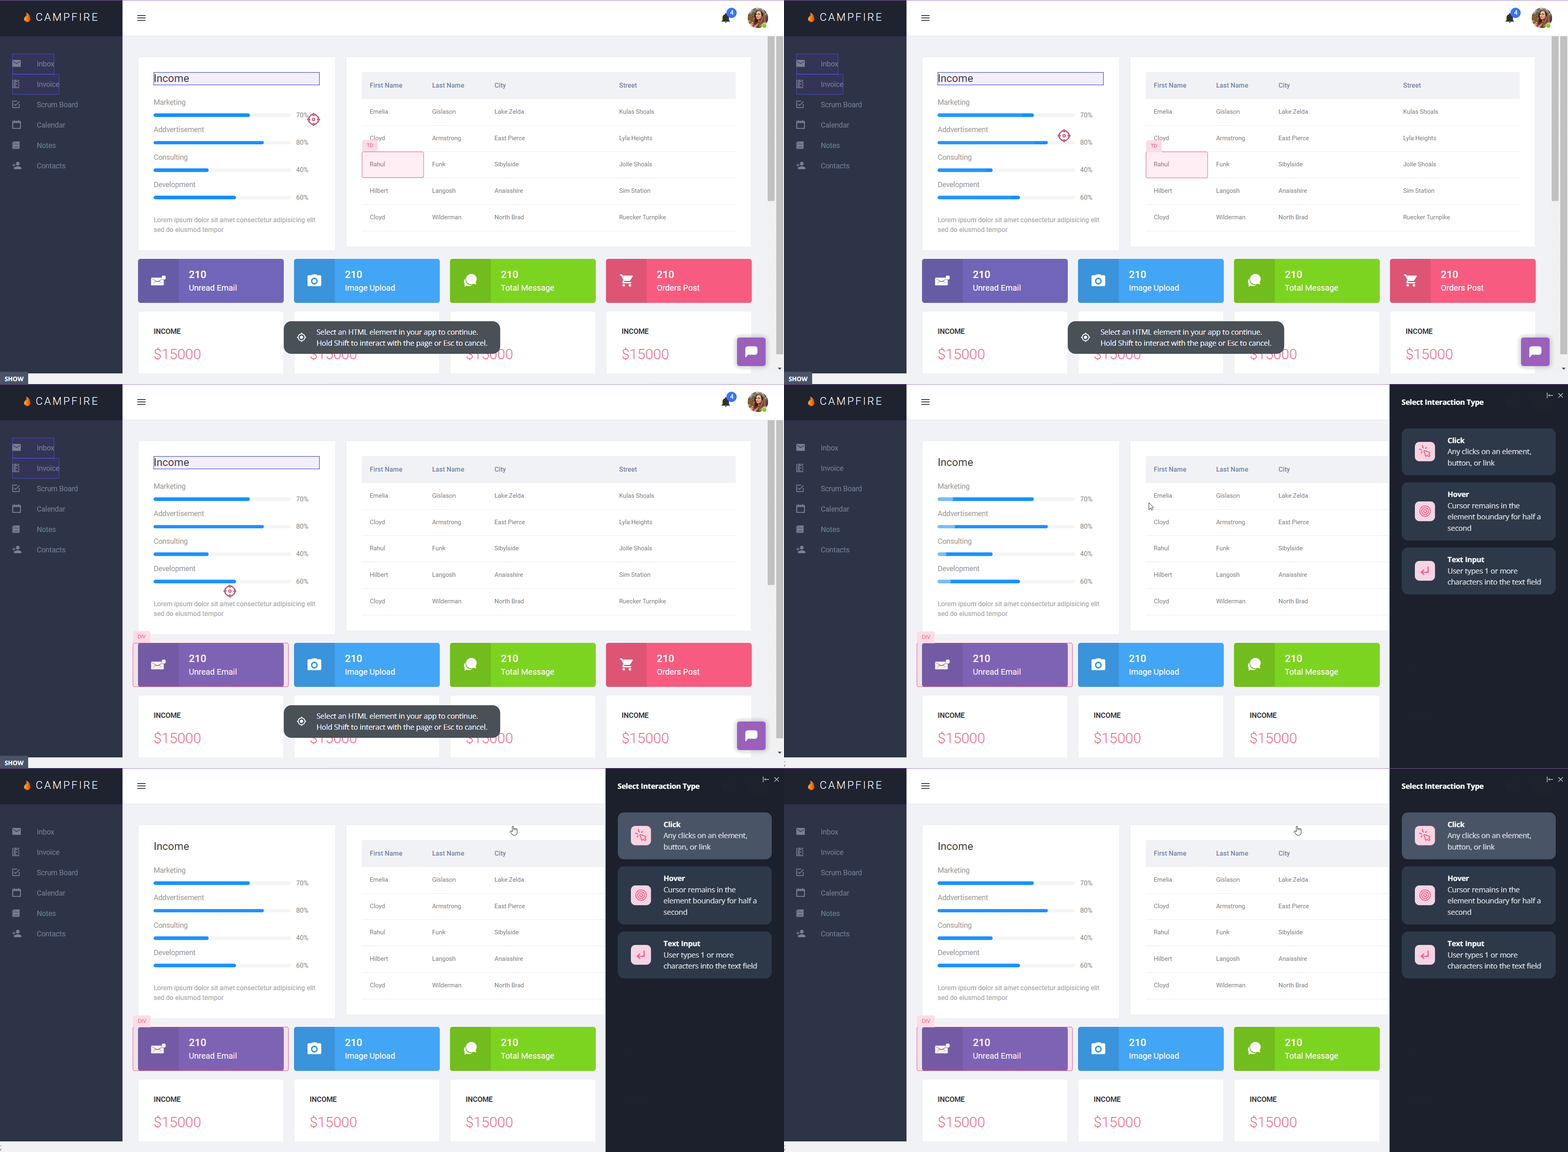
How to use the data from click tracking to gain actionable insights
After you’ve set up click tracking in your product, complete a feature audit to see the features users engage with the least. Filter the results by user segments to see if product usage differs from group to group.
Suppose you find that some user segments are underutilizing a feature they need to complete their goals. Create a secondary onboarding flow encouraging inactive users to test out these features so that more of your customer base becomes power users.
When you give your customers resources to learn the benefits of a feature and how to use it, they’re more likely to adopt it as part of their workflow.
Set custom event tracking to understand user engagement
Instead of creating feature tags for each element, you can create a custom event with multiple user actions (consecutive ones). That way you can see if your customers are reaching product milestones, like completing onboarding or inviting new users.
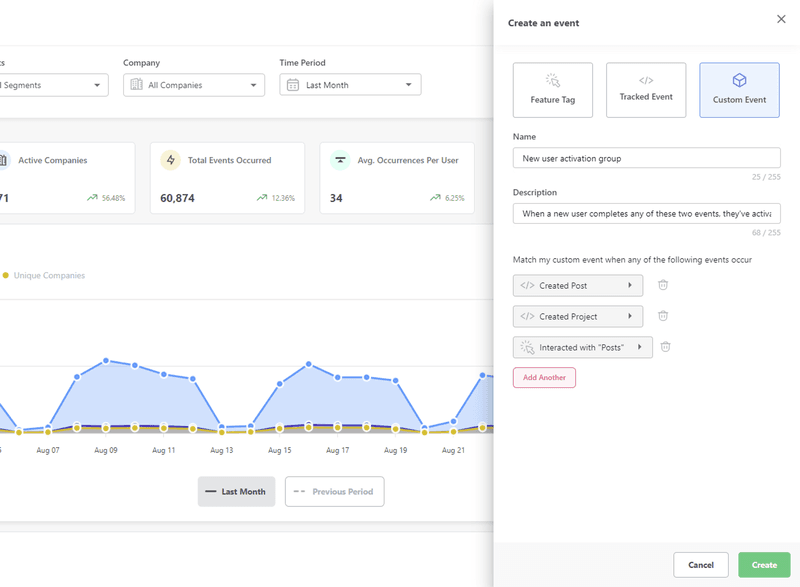
How to use the data from custom event tracking to gain actionable insights
To improve onboarding success and mobile onboarding with custom event tracking, A/B test with different onboarding paths. You’ll see what path users choose. Do they follow the path you have created for them, or do they choose a different route? The answer will help you streamline your customer activation efforts.
Use session recording to find insights into user behavior
Record user sessions with a heatmap and recording software to see how users are spending their time on your product.
You can see how long their session lasts, what they click on, and what is left behind.
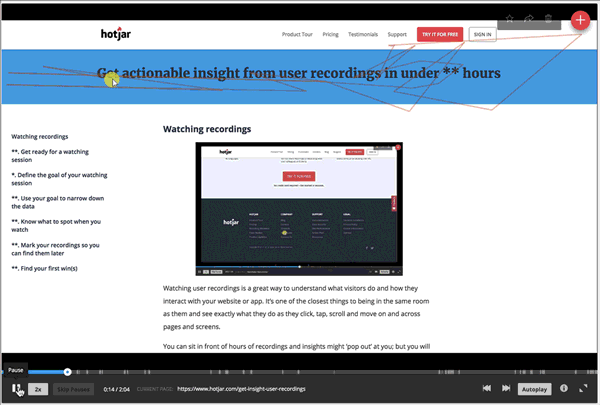
How to use the data from session recordings to gain actionable insights
You may find that people click on non-clickable elements. If that’s the case, change your UI.
You may see rage-clicking – maybe some element is not working correctly or is slow to respond. This is good to know so you can fix the bug ASAP.
Maybe people are not scrolling down to the content you need. In that case, change the structure of your page so higher priority content is immediately visible.
Collect customer loyalty insights with NPS surveys
NPS surveys collect data about customer loyalty. After collecting responses, organize customers into segments based on their responses:
- Promoters: Scored 9-10 (happy customers).
- Passives: Scored 7-8 (neutral customers).
- Detractors: Scored 6 or below (unhappy customers).
In addition to running the score-based NPS survey, add a follow-up question to find the reason behind the score they’re giving. This extra context will give you even more insight into how to improve.
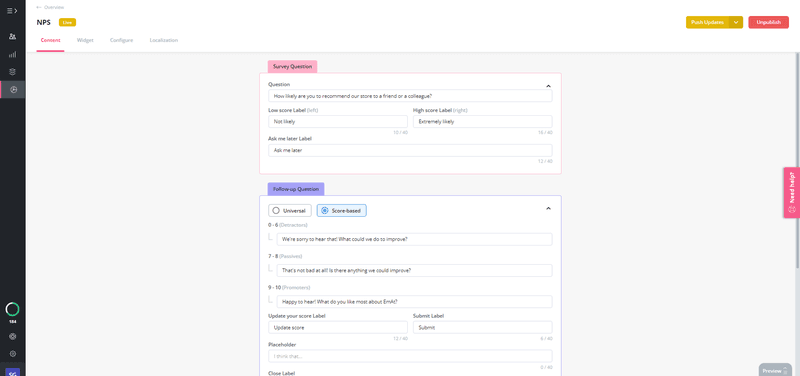
How to use the data from NPS scores to gain actionable insights
Look at the answers of your detractors to find out the reason behind their dissatisfaction and fix it.
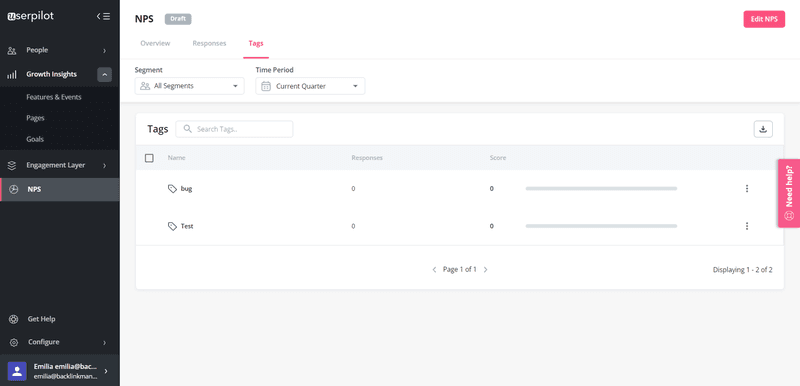
Also, take a look at what promoters are saying so you can replicate their process across all of your customers. This will increase customer satisfaction and loyalty.
How to collect churn insights with churn surveys
Churn surveys (also known as cancellation surveys) are triggered when a customer asks to cancel their plan. It’s a great tool to find out the reasons behind customer churn so you can prevent it.
In addition to giving customers a multiple-choice list of reasons for their cancellation, leave some room for qualitative feedback where they can type their responses.
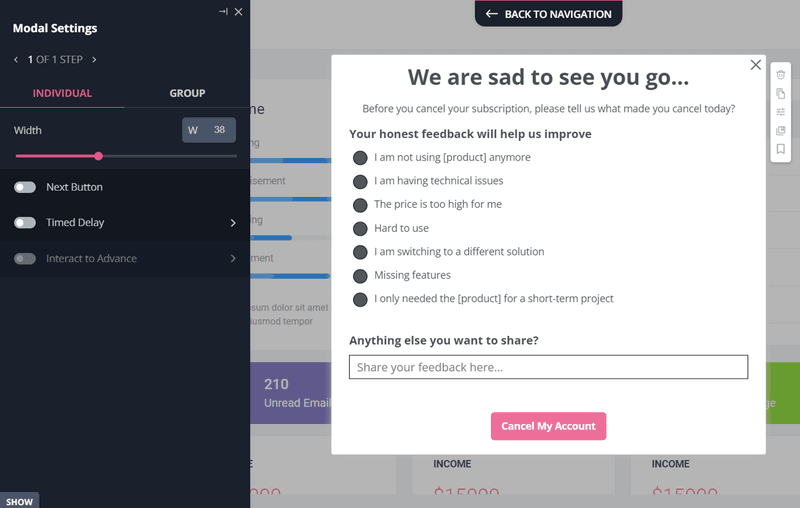
How to use the data from churn surveys to gain actionable insights
Survey responses speak for themselves. If customers are canceling because they listed your tool as “hard to use”, it’s a good idea also to employ session recordings to see what’s causing friction.
By analyzing all survey responses, you can identify churn risk factors that you didn’t know about.
Use natural language processing (NLP) tools to understand user sentiment
Natural language processing (NLP) is an AI-based customer service tool that learns natural human language and then replicates it in its responses.
It’s mostly used in customer support chatbots to offer automated responses to frequently asked questions.
Natural language processing tools are also excellent for gaining actionable analytics since they can pick up on user sentiment in their conversations with your customers.
How to use the data from NLP to gain actionable insights
Analyze data and see what users ask about the most. What topics or issues come up often?
Create educational materials that support on these topics and add them to your resource center. Make them available to your customers 24/7 so they’re never stuck waiting for a response.
How Userpilot can help you collect actionable analytics and improve user engagement
Userpilot is a product growth platform that helps you deliver personalized in-app experiences, track user behavior, and collect customer feedback.
You can onboard and engage mobile app users by creating personalized messaging, push notifications, and surveys.
Userpilot helps you segment your customer base so you can get more actionable data.
You can segment customers based on over a dozen characteristics, including their demographic qualities, location, in-app behavior, and more.
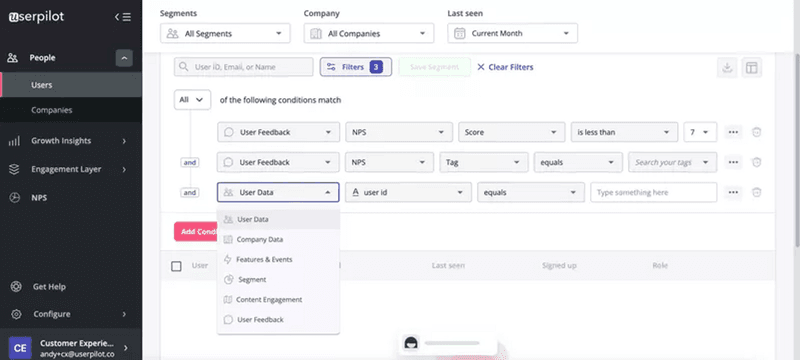
Segmenting customers lets you recognize patterns and trends. It gives you insights on how to improve the product experience for individual segments so that you’re giving meaningful value to everyone.
With Userpilot, you can also create in-app surveys, code-free. Add different elements to your survey, customize it to match your brand, trigger them for specific user segments and tag and analyze survey responses.
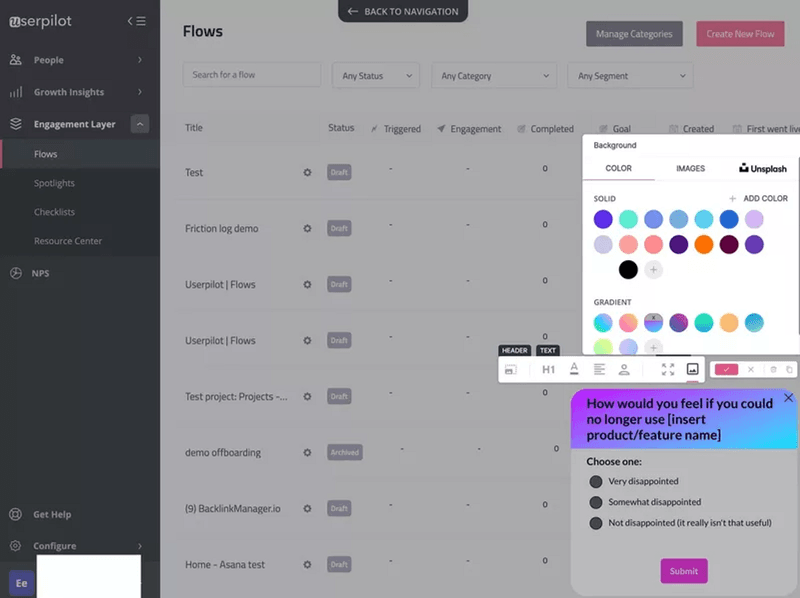
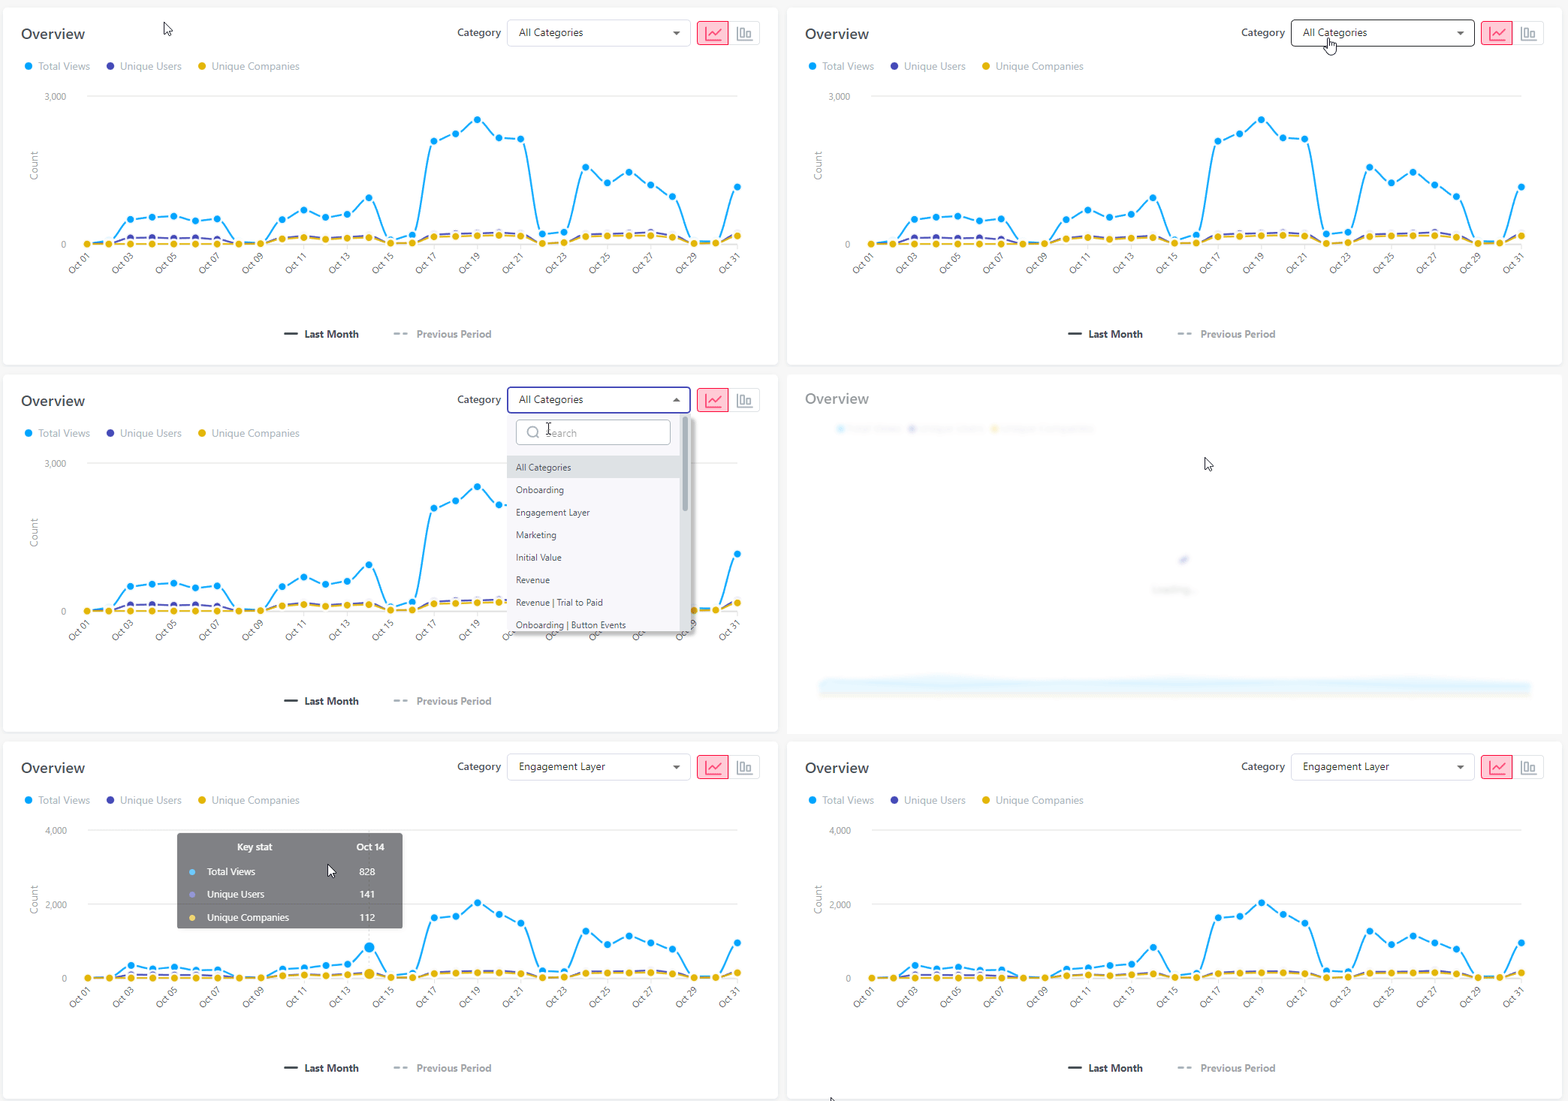
Get actionable analytics about your customers in-app and improve underperforming pages with contextual flows.
Conclusion
Collecting and using actionable analytics in SaaS is a no-brainer to make informed business decisions that have a lasting impact on revenue and growth.
Want to get started with collecting actionable insights? Get a Userpilot Demo and see how you can track user behavior, create code-free surveys, and act on your insights by building in-app experiences.


