How to Identify + Prevent Churn Risk Factors in SaaS


What is customer churn risk?
It’s the possibility that a customer will stop doing business with you. SaaS companies determine churn risk mainly through in-app activities.
Why is identifying churn risk important?
Identifying and preventing churn can sometimes be arduous, particularly when you have a handful of customers. Here are three reasons why it’s worth the effort:
Improve customer retention
Some customers will invariably churn, no matter what you do. That’s just the reality of running a business.
But here’s where it gets interesting: unless your product is particularly bad or you haven’t hit PMF, the majority of your customers are churning for avoidable reasons.
Identifying churn risk helps you prevent customer attrition due to factors under your control. Your retention rates and net revenue will rise as a result. You’ll also strengthen customer loyalty by addressing friction points early.
Proactively act on data sources to reduce churn
The churn reduction process involves analyzing customer data to predict churn effectively. With these valuable data points at your disposal, it becomes easy to use customer segmentation to proactively target and retain customers.
For example, you might notice a particular segment has been inactive for a while. You could reach out through tooltips, guides, or other communication channels to reengage and turn them into active users.
Prevent negative reviews
When customers churn, they are more likely to tell others about their bad experience with your product or service. Knowing that SaaS buyers actively research a product before signing up, the last thing you want is to have negative reviews all over the place.
You can turn the table on its head: prevent churn from happening and focus on increasing customer satisfaction. With this, you won’t even have to ask before customers leave positive reviews on social media and review sites.
How to identify churn risk factors
Now that you’ve seen the value of churn prevention, it’s time to get to the meat of this article. Use the strategies below to identify churn risk in your product.
Talk to your customer success team
If there’s any department in your company that can correctly predict customer churn and suggest ways to prevent it, it’s your customer success team. Not because they’re magicians but because they regularly interact with customers. They understand customer pain points and can see whether or not users are getting value from your product.
The CS team can enhance retention by providing good customer service and promoting a continual value realization among your customers. They should also suggest changes when they notice customers aren’t getting enough value from the product.
Identify decreasing product usage data
Tools like Userpilot allow you to tag pages and view customer activity. By analyzing the product usage data, you can find important pages with reduced or no visits and examine them further.
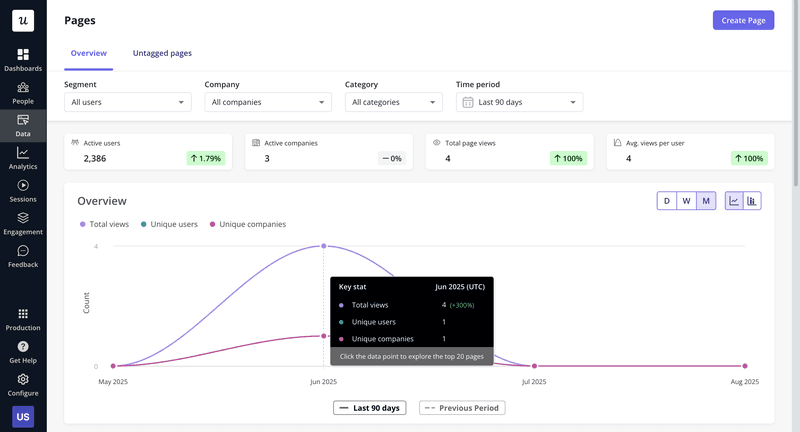
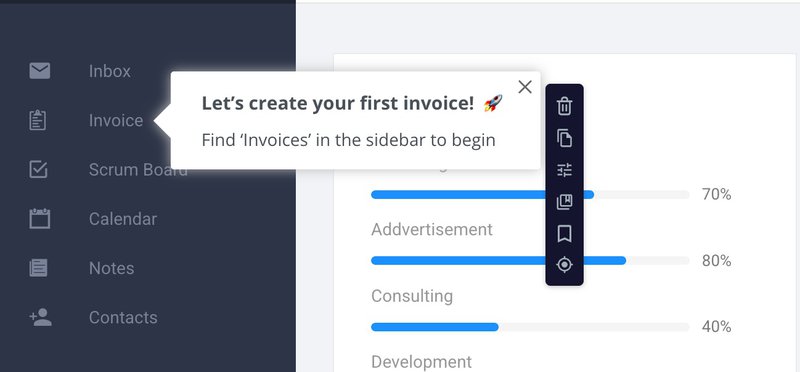
After deciding there’s a likelihood of churn because users are not getting optimal value, you can reach out via a tooltip to help them discover that page and improve their productivity.
Collect customer feedback at every stage of the customer lifecycle
Reach out to your customers to learn about their experience. Behavioral data can show you trends, but hearing from the horse’s mouth provides a special kind of insight.
Send your product surveys regularly, and try to include open-ended questions so customers can speak their minds. Don’t ask, “Our XYZ feature is good, yes or no?”.
Okay, that was a joke, but you get the idea.
Also, be responsible and act on the collected data by closing the feedback loop. There’s no point in gathering customer opinions when you don’t act on them.
Proactively monitor customer satisfaction
Use CSAT and NPS surveys to measure customer satisfaction. The trick is to run the surveys regularly and keep track of customer responses to analyze trends.
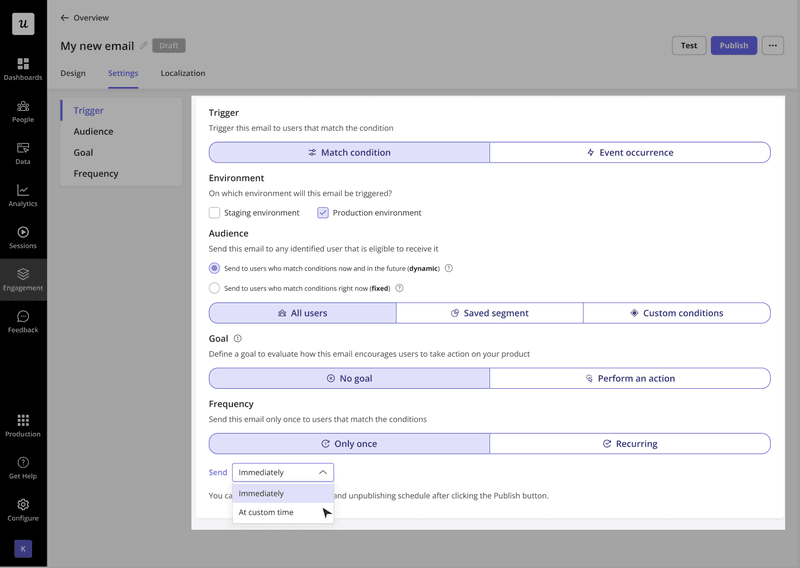
For better results, you can trigger satisfaction surveys in-app after the user interacts with a specific feature. You can even do so via email if they haven’t logged in for a while or recently downgraded their plan.
If you notice user satisfaction drops over time, it can be a sign of churn. Investigate to learn more and find ways to improve it.
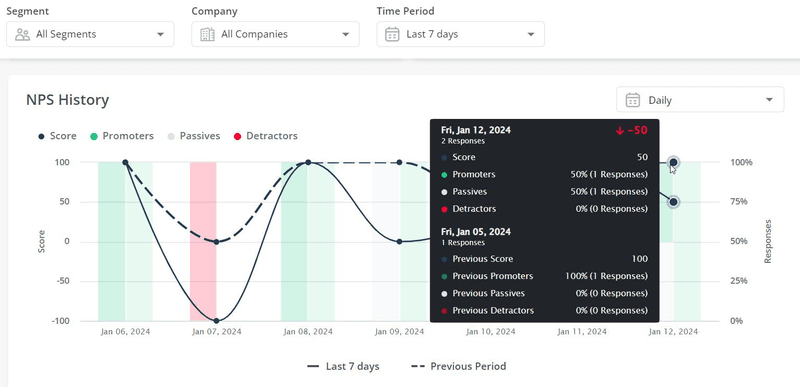
Investigate low NPS responses
After using NPS to measure user satisfaction and loyalty, segment the responses so you can better act on them.
Your focus should be on detractors — your current customers who gave low NPS scores. Analyze their responses to determine the reasons for churn, and reach out to learn more about their dissatisfaction. This is particularly useful if it stems from poor service or a weak value proposition
Take Unolo, for example.
They’re a field service management platform helping businesses track sales teams, manage tasks, and handle expenses. But Unolo was struggling with churn, averaging 3% month over month, and their feedback channels weren’t helping. Email surveys had low engagement, and support chat wasn’t scalable.
So they switched to Userpilot’s in-app surveys and started with NPS.
What changed? A lot.
They saw a 44% completion rate on surveys. More importantly, the NPS dashboard helped them catch negative feedback fast, forward it to customer success, and follow up with users before they churned. Within a few months, they reduced churn by up to 1%.
As Subhash Yadav, their product marketer, put it:
“We got feedback almost instantly… which helped us get in touch with customers more quickly and understand their concerns with the product.”
Identify patterns in customer behavior
One of the most effective ways I’ve found to spot churn risk is by analyzing customer behavior trends, especially when you already know what churned customers tended to do (or not do). Once those patterns are clear, you can proactively monitor existing customer segments showing similar signals and intervene early, especially for high churn risk customers.
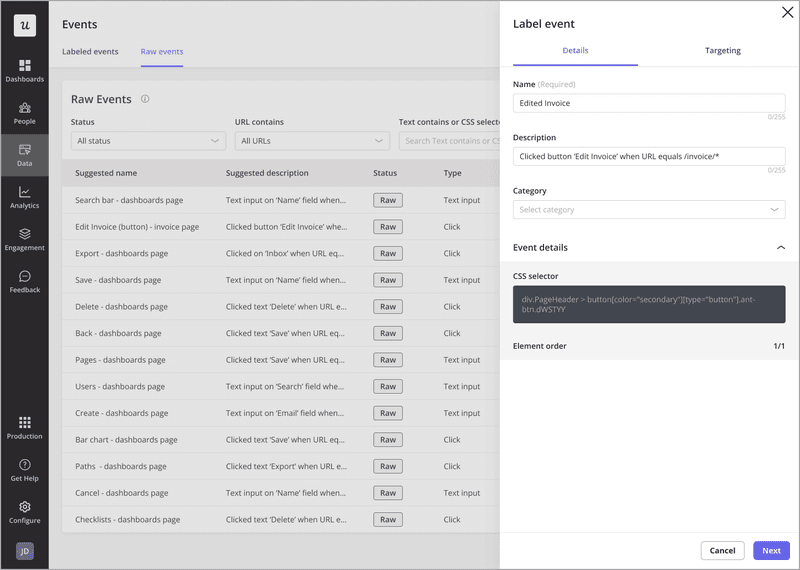
In the past, this kind of analysis required tagging features in advance. If you didn’t set it up from the beginning, you’d miss valuable data. That’s no longer the case.
With Userpilot’s autocapture and visual labeling, you don’t need to pre-tag anything. All raw events are tracked automatically, and you can label them later whenever you’re ready to dig in.
That means you always have access to historical data and can analyze patterns retroactively. It’s a huge win for spotting churn risk signals in real time and going back to investigate what happened.
Conduct customer churn analysis
Churn analysis is about understanding why they left, what they did before leaving, and how you can stop others from following the same path. This is the foundation of building a churn prediction model.
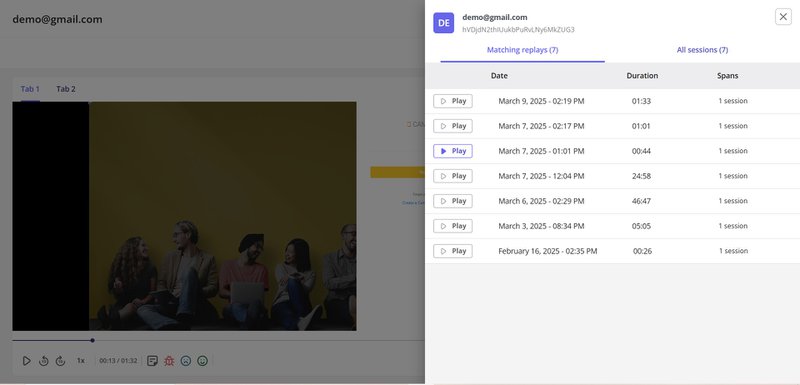
When I look into churned accounts from exit survey data, session replays give me the clearest picture. It’s one thing to see a drop-off in customer churn data, but watching users struggle with a feature or abandon a flow midway tells me exactly where the friction is happening.
Funnels help me confirm that at scale. If most users are dropping off at the same step in onboarding or activation, that’s a signal that something needs to change. Either we need to improve how we guide users, or the product itself.
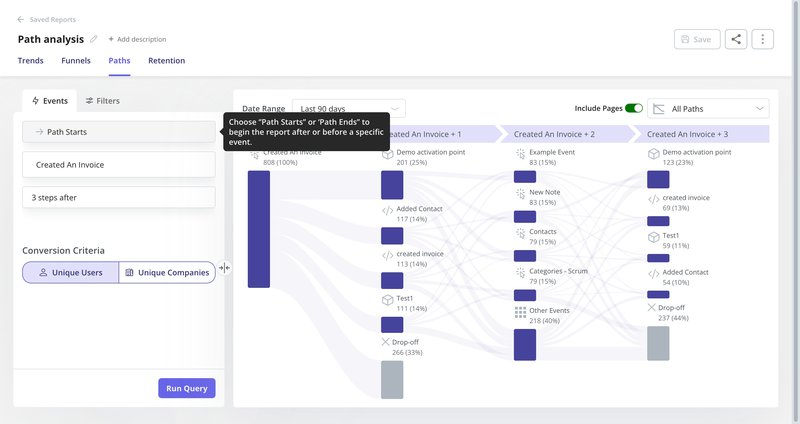
I also rely on path analysis to spot odd behavior patterns that might lead to churn. For example, if users are bouncing between two or three features without completing any meaningful action, it usually means they’re lost or not getting value.
Take a look at the support tickets
The next thing customers do after encountering problems is open a support ticket, especially when there’s no self-serve resource they can visit.
Look into your support tickets to find recurring customer complaints, as they’re often pointers of attrition. Also, ensure customer issues are resolved quickly, and tickets closed before customers churn. Unresolved support requests often correlate with lost revenue due to frustrated users walking away.
Metrics you should be tracking to identify churn risk factors
It’s not just enough to identify churn risk; you need a holistic way of knowing how successful your retention strategies are.
Below are three important churn metrics to help you keep track of product health.
Customer churn rate
The customer churn rate is the ratio of customers you lost during a specific time frame to customers you had at the start of the period, multiplied by 100.
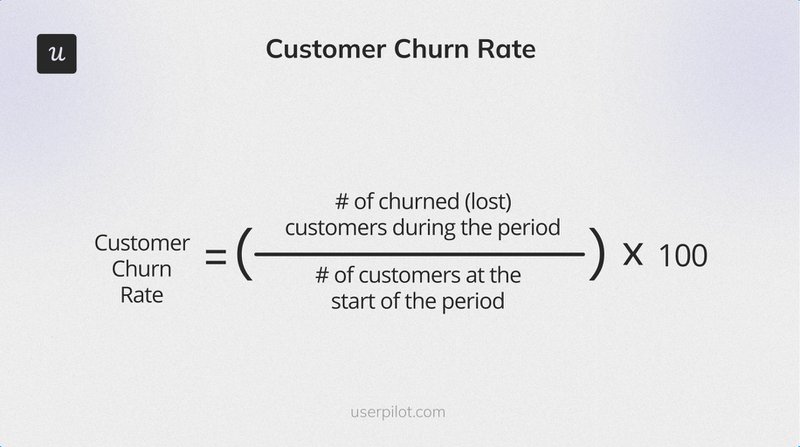
For example, imagine you began the last quarter with 600 customers, and the figure dropped to 520 by the end of the period. You’ve lost 80 users, so your customer churn rate is 80/600 x 100=13.33%
Average churn rates vary for many reasons, but around 5-7% is considered okay for SaaS. Of course, aim to have lower churn rates as your company grows.
Net MRR churn rate
Net Monthly Recurring Revenue (MRR) churn shows you how much you’re losing monthly due to churn.
It’s a more accurate indicator of your growth than customer churn because Net MRR includes both cancellations and downgrades.
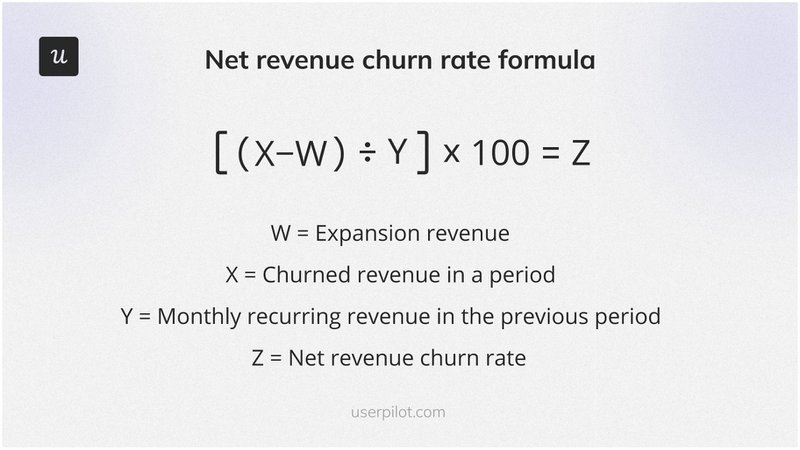
To calculate your Net MRR rate, subtract the expansion MRR from the churned MRR. Then divide the result by the starting MRR and multiply by 100.
Confused?
Let’s consider an example to give you some clarity:
If your MRR for the month is $70,000 and you recorded churn of $5000 with account expansion of $1200, your Net MRR churn rate is:
$5000-$1200/$70,000 X 100 = 5.43%
Revenue churn
The revenue churn figure is how much money you lost over a specific period because of your churned customers.
It’s calculated by dividing the revenue lost from existing customers by your total revenue at the start of the period. Multiply it by 100 to get the percentage.
If you had $500K in recurring revenue at the start of the year and lost $120K due to churn from existing customers, your revenue churn is:
120K/500K X 100 = 24%
About the author