Top 6 Behavioral KPI Examples & How To Track Them?


Do you need some behavioral KPI examples to understand what metrics to track and why? You’ve come to the right place!
Behavioral key performance indicators (KPIs) can help you understand user experience and measure feature adoption. Then, you can use its valuable insights to make data-driven decisions for your SaaS business.
In this article, we will discuss the top 6 behavioral KPI examples and how you can track them to improve your product and drive business growth.
Behavioral KPI examples summary
- Behavioral KPIs refer to metrics that track and measure customer behavior and engagement with your products or services.
- Tracking behavioral KPIs is essential for understanding customers and improving their user experience with your products.
- The top 6 behavioral KPI examples you should track are – time-to-value (TTV), breadth of adoption, number of times help and documentation used, freemium to premium conversion rate, product activation rate, and net promoter score (NPS).
- Track behavioral KPIs by autocapturing events, creating custom dashboards and analytics reports.
- You can also segment customers based on customer behavior, and get powerful behavioral analytics in a single place.
What are behavioral KPIs?
Behavioral KPIs refer to a set of metrics that track and measure customer behavior and their expected engagement with your products or services.
Why should you track behavioral key performance indicators?
If you want to understand your customers better and improve their overall user experience with your products then you need to track behavioral KPIs.
Behavioral KPIs provide valuable insights that help you better understand your user’s behavior and needs. You need to develop a strategy to regularly observe these metrics that can help you see common patterns and trends in your user’s behavior.
By tracking these KPIs, you can easily use behavioral targeting and analytics to provide your customers with a more relevant and hyper-personalized experience, from onboarding to retention.
Tracking behavioral KPIs can also help you identify the friction points in the customer journey. Once you know what they are, it’s easy to take steps to get rid of why customers might stop using your product.
Moreover, it can act like a custom competency framework to bring out more collective efforts from your different teams. So it can be a powerful way to improve the user experience with a more cohesive effort and shorten the time-to-value for your customers.
6 Most important behavioral KPI examples to understand user behavior
Behavioral metrics are about tracking user behavior, monitoring the changes, and optimizing the user experience. For example, they can help you know how long it takes users to adopt a feature, how often they need support in a month, how they give feedback, etc.
You can use these metrics to look at a specific user or user segment, compare it to another, and then incorporate the insights into your future strategies.
However, not every behavioral KPI can have a positive influence on your strategies. So it is crucial to know which behavioral KPIs are the most necessary for your products.
Let’s go through the top 6 important behavioral KPI examples to help you better understand user behavior.
Time to Value
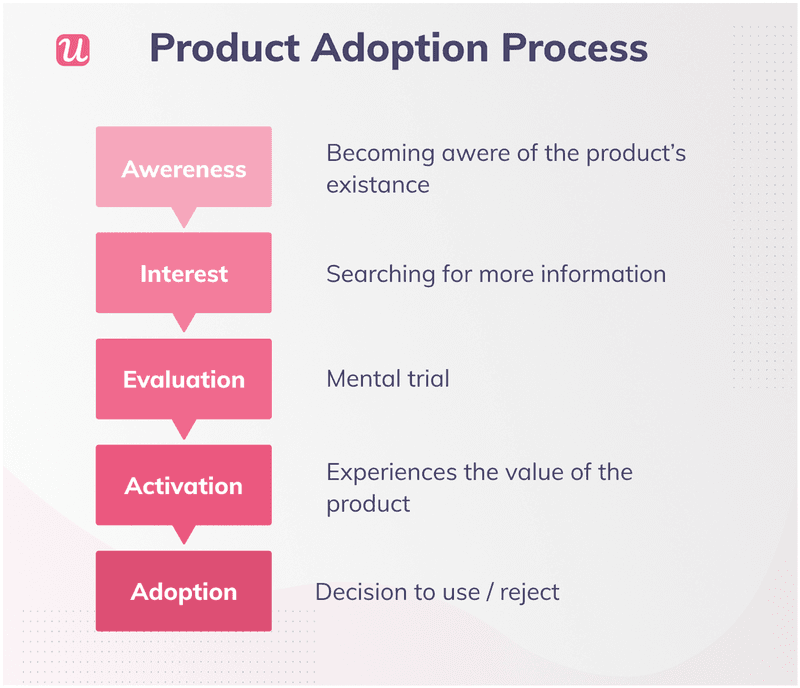
In SaaS, time-to-value (TTV) refers to the time it takes for a user to realize the value of your products or services.
It helps you determine how effectively your product or service delivers value to the customers. You can use it to track early customer satisfaction and identify improvement areas to reduce time-to-value.

TTV can provide insights into how long customers take to see value in your product. And while doing this, it lets you identify problems delaying value realization and evaluate onboarding and customer success efforts.
A short TTV indicates that the product is easy to use and understand. And a long TTV may indicate your onboarding process or product design needs improvement.
You can find the TTV by determining the time a user requires to reach the Aha! moment and start experiencing value from your product or service.
The average rate of TTV varies depending on a specific product in the SaaS industry.
Breadth of adoption
The breadth of adoption (aka the depth of adoption) measures how widely your customer base has adopted your products or services.
With it, you can track how users behave or engage within the product to understand product adoption and specific feature adoption better.
A wide breadth of adoption for your product may imply that your customers are using it for multiple cases. It also indicates you have a large and diverse group of customers.
But a narrow breadth of adoption can indicate that a small and specific group of customers are using the product. It generally happens if your product fails to meet your customers’ needs.
Number of times help and documentation used
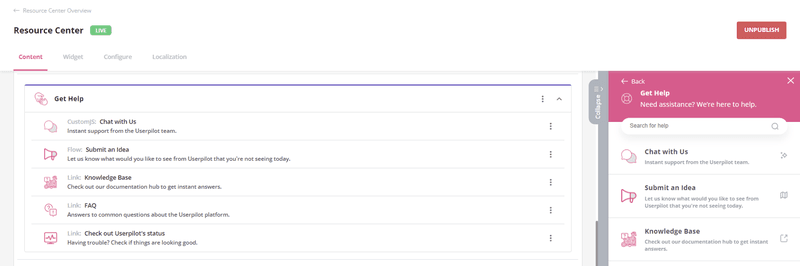
The number of times help and documentation are used measures how often your customers access your help and documentation resources. It can help you understand the effectiveness of your customer support facilities.
In most cases, high usage indicates customers are having trouble finding the information they need or that the product is difficult to use. A low usage rate might imply your product is relatively easy to use and customers find what they need without assistance. But the indications might sometimes not be this much black and white.
It can provide insights into essential aspects like user experience, product complexity, and the effectiveness of support resources. You can use the data to optimize the help center with the knowledge base, widgets, micro videos, improved self-service support, etc.
Freemium to premium conversion rate
The freemium-to-premium conversion rate measures the percentage of freemium users who convert to paying customers.
A high conversion rate suggests your product’s free version effectively shows its value and your business’s pricing strategy is working well. But a low rate shows your freemium version isn’t working as expected. You can then decide which works best for you – a freemium model, a free trial, or any other strategy.
This metric lets you analyze the conversion rate across different customer segments. Using the insights from the analysis, you can better focus on your marketing efforts and resources. It also provides insights into the effectiveness of your pricing models and whether you need to change them.
The average freemium to premium conversion rate in the SaaS industry is around 1 – 10%.
Product activation rate
The product activation rate measures the percentage of users who take specific key actions within your product, experience its value, and convert to paying customers.
With this crucial KPI, you can figure out the success of the money and effort you put into customer acquisition. If you can have more users activate your product, your monthly recurring revenue (MRR) will grow significantly.
A high activation rate implies that users find value in your product and are more likely to continue using it. And a low rate can suggest that users might face friction in the onboarding process or at any other point in the user journey.
You can calculate the product activation rate by dividing the number of users who reached the activation milestone by the number of users who signed up and multiplying the ratio by 100.
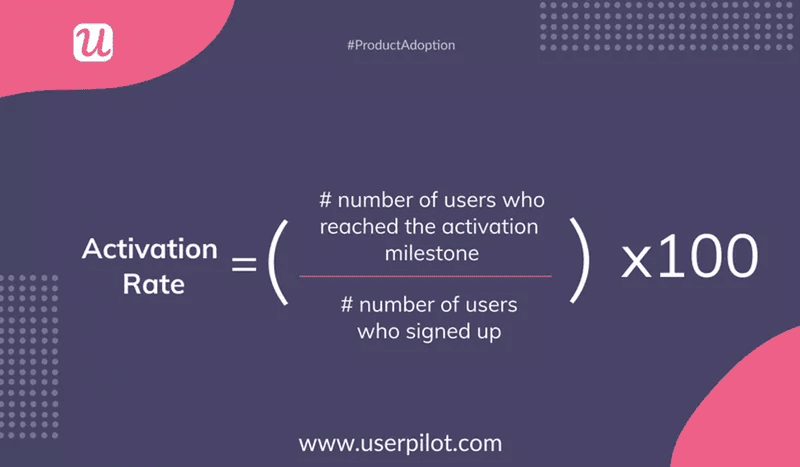
For example, you have 2,000 users who have reached the activation point and 10,000 signed-up users. Then, your activation rate was (2,000/10,000)*100, or 20%.
The average product activation rate in the SaaS industry is around 35 – 40%.
Net Promoter Score
The net promoter score (NPS) measures the likelihood of your customers recommending your product or service to others.
This popular metric helps you measure and understand customer satisfaction and loyalty better.
If you have a high NPS, your customers are happy with your product and will likely bring in new customers by promoting it to others. But a low NPS can indicate that you should remove the pain points in the customer experience.
You can use an NPS survey to rate customers’ likelihood of recommending your product or service on a scale of 0 to 10. Then subtract the percentage of detractors from the percentage of promoters to get the NPS score.
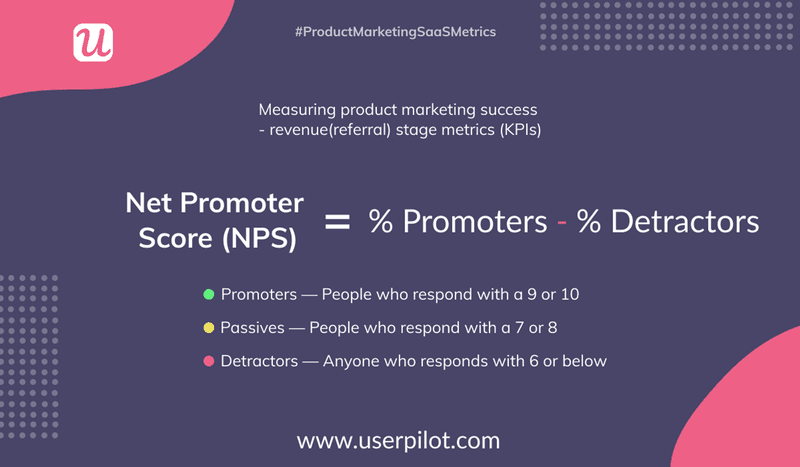
Suppose your percentage of detractors is 12% and that of promoters is 73%. Then your NPS score is (73-12) or 63.
Generally, a positive NPS score indicates your product is doing fine. But the average NPS for SaaS companies is around 40%, which you should target.
How to track and optimize behavioral KPIs
Here’s how you can easily implement the best practices and strategies for all the behavioral KPI examples we’ve discussed.
Use feature tagging to understand how customers are using the product
You can easily set up in-app tracking to monitor what users are doing and how they behave within the product. Once you have it, you can look for behavioral patterns and use them to make the user experience better.
Using the feature tagging, you can keep track of clicks, hovers, and text inputs to find out more. With these insights, you will have a detailed view of how your users interact with your product’s features.
You can then identify the most popular features, where users may get stuck, and how they navigate your app. It can help you make more informed product decisions and eventually retain more customers by satisfying them.
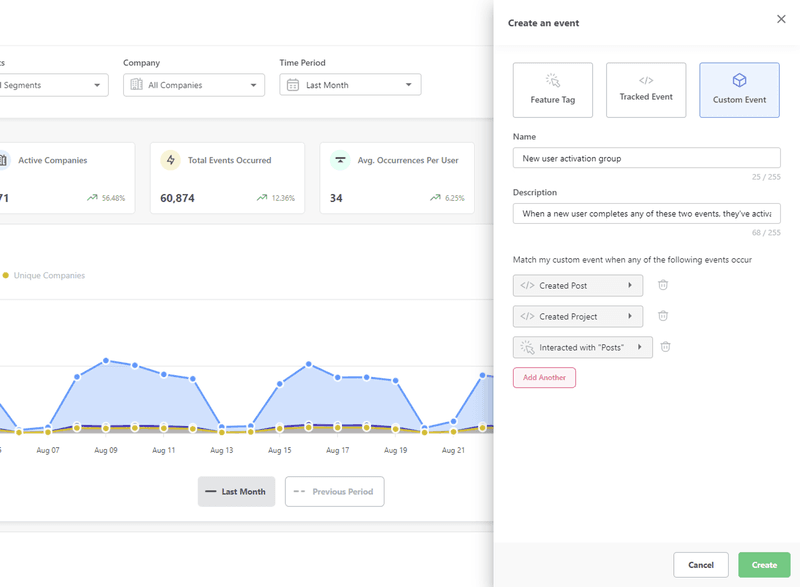
Use custom events to figure out what’s going on
Custom events are a powerful tool for figuring out what’s going on with your products. Although feature tagging is a great way to understand how customers interact with specific features, custom events allow you to combine distinct in-app events and gain a more comprehensive understanding of product adoption.
Custom events also let you set up automated triggers and notifications depending on user behavior.
For instance, you can set up a notification that users will get when they finish a certain task or reach a certain point in the product.
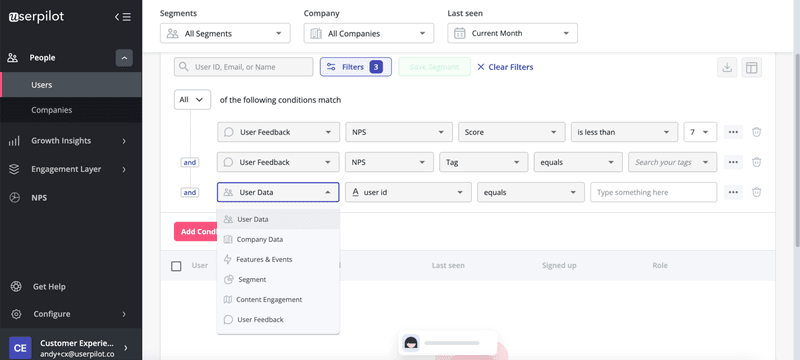
Segment customers based on in-app behavior
Behavioral segmentation is an effective way to segment customers depending on their in-app behavior. It can help you understand how different segments of customers interact with your product.
Collect data about users, your company, features and events, user feedback, etc. It also lets you easily use this data to create user segments with similar behaviors.
You can offer personalized experiences to different user segments and increase user engagement. It will bring you more upsells, cross-sells, and customer retention opportunities.
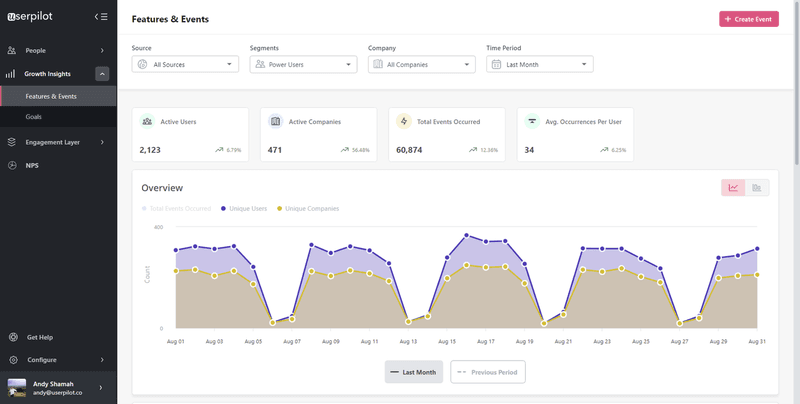
Access powerful product analytics in one place
With behavioral analytics, you can understand user behavior with real-time data. You can then access more insights into how to optimize user engagement.
And with mobile features, you can create intuitive mobile app KPI metrics and dashboards that provide clear insights into user behavior, engagement, and retention, specifically for your mobile applications.
Its user funnel analytics can help you track user activities and behavior through every step of the customer journey. You can also pull out the unique and total number of views by users and companies over time by tracking the pages’ activities.
It lets you monitor how your users go through their predefined user funnels. While doing so, you can also track customers’ every navigation in your app.
Conclusion
As you can see, tracking the 6 critical behavioral KPI examples can be a gold mine of opportunities for your SaaS business. We hope you use the insights from this article to implement the best practices while tracking and optimizing these KPIs.
Want to track in-app user behavior code-free? Book a Userpilot demo and see how easily you can do it.
About the author