![Data Analyst Salary [+ Resources to Advance]](https://blog-static.userpilot.com/blog/wp-content/uploads/2024/07/Data-Analyst-Salary-Resources-to-Advance.png)
How much does a data analyst make?
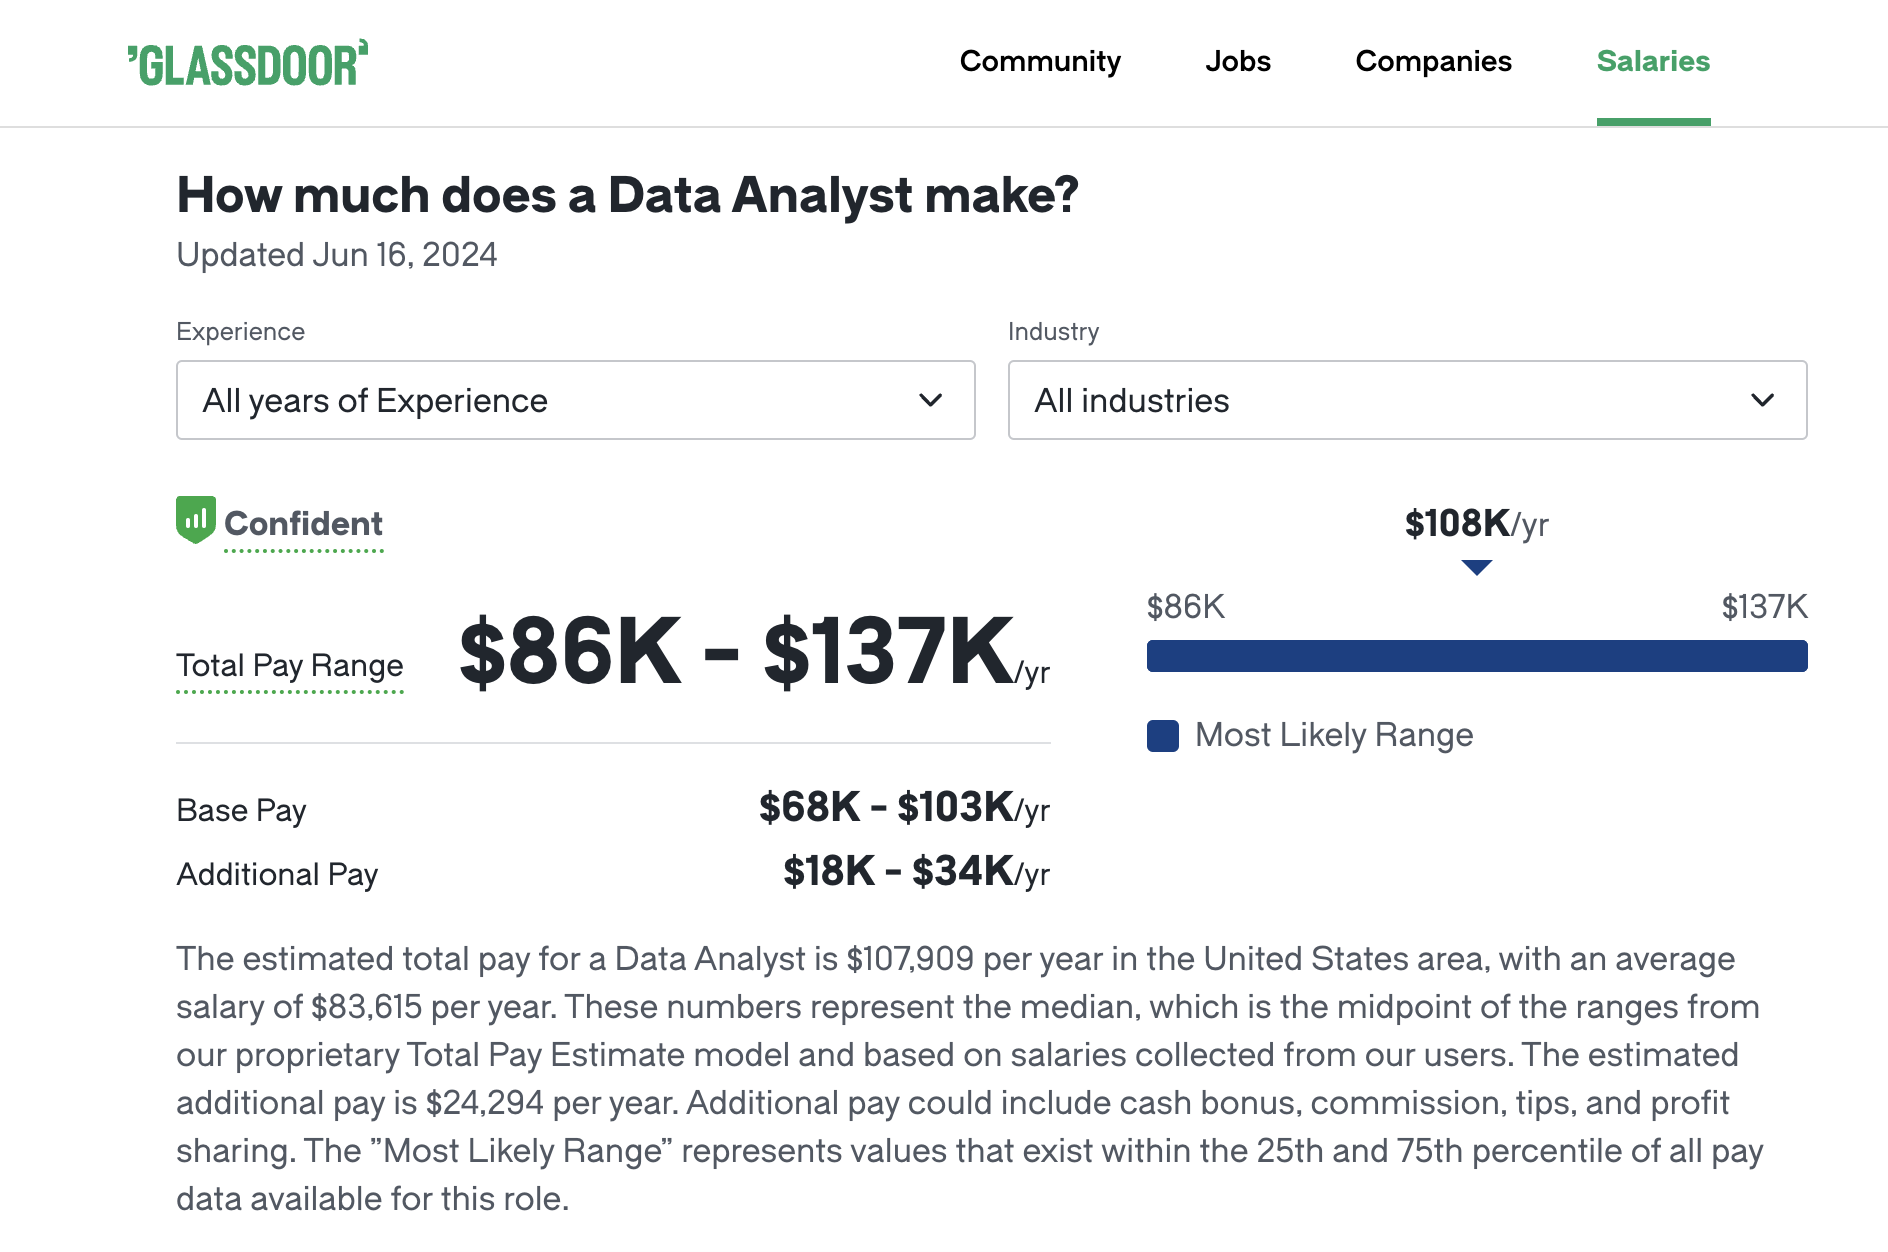
According to Glassdoor, the average base salary for a data analyst in the United States is $76,293 per year. However, salaries can range widely based on experience level:
- 2 to 4 years (Data Analyst): $82,288 per year
- 5 to 7 years (Senior Data Analyst): $109,880 per year
In addition, data analyst salaries tend to be higher in major tech hubs and metropolitan areas with a high cost of living. For example:
- San Francisco Bay Area: $90,000 – $130,000+ per year
- New York City: $80,000 – $120,000+ per year
- Seattle: $85,000 – $125,000+ per year
Salaries in smaller cities or rural areas may be lower than the national average.
Apart from these main factors, your skill set, educational background, and the specific company you work for can also influence your salary. Having expertise in in-demand tools and technologies like Python, SQL, or machine learning can boost your earning potential.
Try Userpilot Now
See Why 1,000+ Teams Choose Userpilot

Data analyst career path
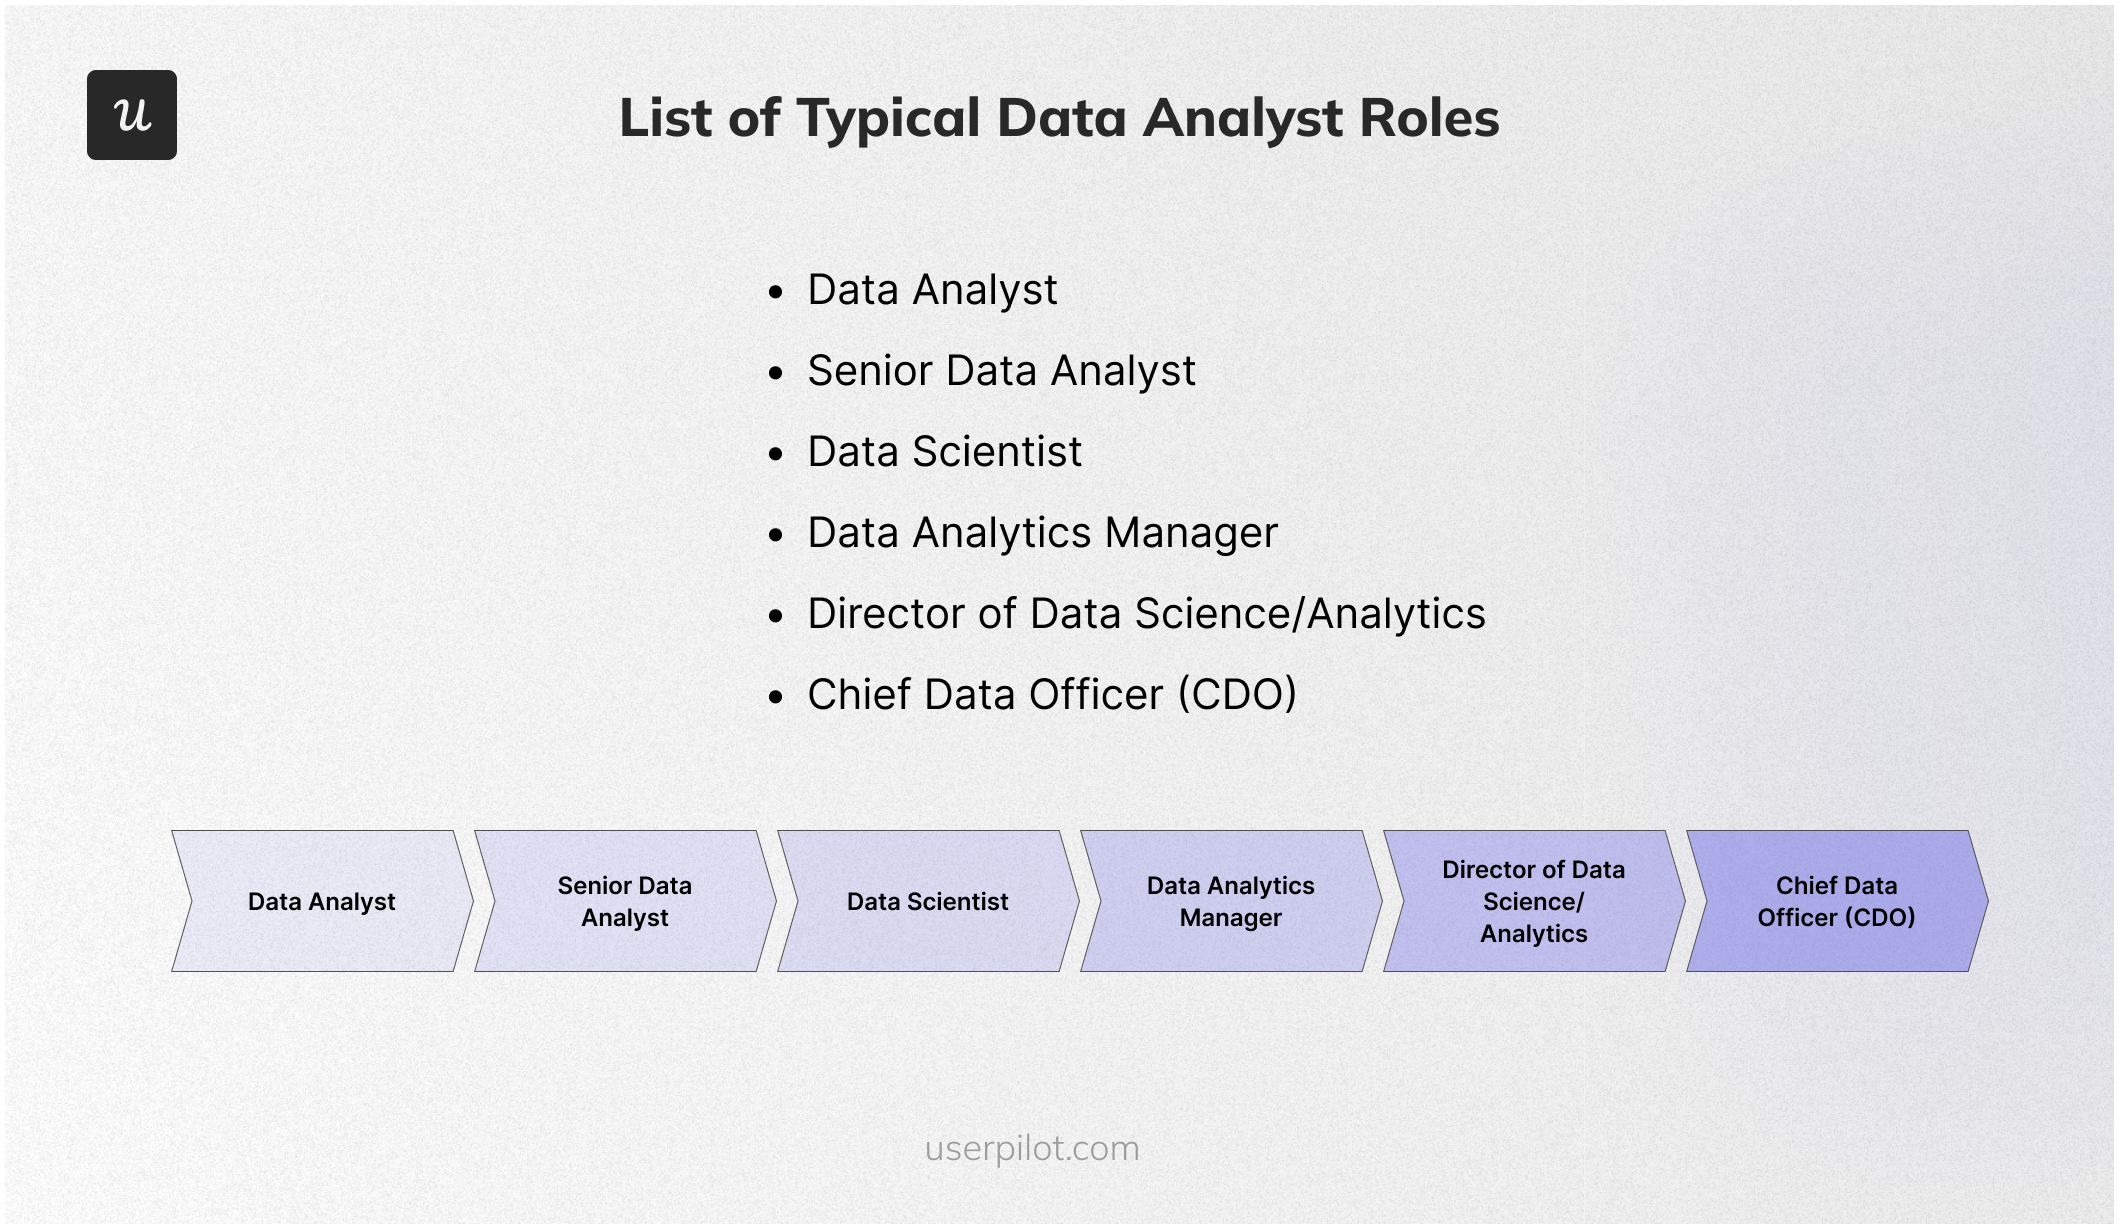
The specific paths may vary depending on your interests and the organization you work for. Nonetheless, here’s a breakdown of typical positions and growth opportunities as a data analyst:
- Data Analyst (0-3 years): Entry-level position focused on data collection, cleaning, and basic analysis. Responsibilities include creating reports, dashboards, and visualizations to support decision-making.
- Senior Data Analyst (3-5 years): Takes on more complex projects involving advanced statistical techniques and data modeling. May lead small teams of analysts and mentor junior colleagues.
- Data Scientist (5-8 years): Applies machine learning and statistical modeling to predict future trends, optimize processes, and solve business problems. Strong programming skills (Python, R) are often required.
- Data Analytics Manager (8-12 years): Oversees a team of data analysts and scientists, setting goals, managing projects, and ensuring the team’s work aligns with business objectives.
- Director of Data Science/Analytics (12+ years): Leads the entire data organization, defining the overall data strategy, developing data-driven products, and fostering a data-driven culture within the company.
- Chief Data Officer (CDO): A C-suite executive responsible for the company’s data assets and strategy. This role is typically found in larger organizations with mature data functions.
Alternative paths:
- Business intelligence analyst/developer: If you enjoy building dashboards and reports, this could be a good fit. Requires strong visualization skills and an understanding of data warehousing concepts.
- Data engineer: If you’re passionate about building data pipelines and infrastructure, this is a technical route. Requires strong programming and cloud skills.
Best practices to be a great data analyst
Data analysis is a multi-stage process, with each step contributing to the overall quality of the insights. With that in mind, we’ve outlined several best practices to make your job easier along the way:
- Define clear objectives: Every analysis should have a goal. What questions are you trying to answer? What decisions will the insights inform? Having a clear target keeps your analysis focused and avoids getting lost in the data
- Understand the business context: Don’t analyze data in a vacuum. Learn the industry, the company’s goals, and how your analysis fits in. Talk to stakeholders to understand their needs.
- Embrace iteration: Data analysis is rarely a linear process. Be prepared to revisit your approach, refine your questions, and try different techniques as you gain insights.
- Document everything: Keep thorough records of your data sources, cleaning steps, analysis methods, and findings. This ensures transparency and reproducibility.
- Automate when possible: To save time and reduce errors, repetitive tasks can be automated with scripts (Python, R).
- Choose the right tools for the job: There are many data analysis tools – both code (i.e. Amplitude, Heap, etc.) and no code options (i.e. Userpilot), but you can choose the one that best suits the task. For example, you can use Userpilot to visualize data and generate actionable insights leveraging reports such as funnel, path, etc.
- Focus on actionable insights: Don’t just present numbers, but tell a story with your data. Translate your findings into clear recommendations for action.
- Communicate effectively: Tailor your communication to your audience. Use simple language, visualizations, and narratives to make your findings accessible to everyone. This is where no-code options like Userpilot become useful when it works for both technical and non-technical teams.
Best resources for data analysts
In this section, we’ll explore some of the best resources for data analysts, including educational books, insightful blogs, and other resources designed to help you excel in your career and keep up with industry advancements.
Best books for data analysts
Data is everywhere, and the ability to analyze it is a highly sought-after skill. If you’re taking your first steps in data analysis, building a strong foundation is crucial.
These recommended books offer a practical and accessible way to learn the essentials, from basic concepts to more advanced tools and techniques:
- “Naked Statistics: Stripping the Dread from the Data” by Charles Wheelan: A fun and accessible introduction to statistics, explaining complex concepts in a way that’s easy to understand.
- “Storytelling with Data: A Data Visualization Guide for Business Professionals” by Cole Nussbaumer Knaflic: Highly recommended for mastering the art of presenting data in a clear, concise, and engaging manner.
- Practical Statistics for Data Scientists: 50+ Essential Concepts Using R and Python” by Peter Bruce, Andrew Bruce, and Peter Gedeck: Covers essential statistical concepts with practical examples in R and Python, making it a great resource for data analysts who are comfortable with programming.
- “SQL Practice Problems: 57 beginning, intermediate, and advanced challenges for you to solve using a “learn-by-doing” approach” by Sylvia Moestl Vasilik: A practical guide to mastering SQL with hands-on exercises, perfect for data analysts who need to work with databases.
- “Designing Data-Intensive Applications” by Martin Kleppmann: A comprehensive guide to building scalable and reliable data systems, covering topics like data storage, distributed systems, and batch processing.
Best webinars for data analysts
As a data analyst, you need to constantly update your skills and knowledge to keep up with the fast-paced world of data. Webinars offer a convenient way to do just that, allowing you to learn new techniques, tools, and industry trends from the comfort of your own desk.
So, here’s a list of useful webinar sources that you should keep an eye on:
- Userpilot Events: Userpilot’s webinars often focus on product analytics, user onboarding, and behavior-driven insights. They’re excellent for analysts interested in the intersection of data and user experience.
- BrightTALK: This platform hosts a massive selection of webinars on various topics, including data analysis, business intelligence, and data science. You can filter by your interests and level of expertise.
- DataCamp: While primarily known for its courses, DataCamp also offers webinars on specific data analysis techniques, tools, and career development.
- Orbit Analytics: Their webinars delve into reporting, BI, and data analytics, often focusing on Oracle-related tools and solutions.
Best blogs for data analysts
By reading insightful articles, tutorials, and case studies, analysts can expand their knowledge, learn new techniques, and gain inspiration from industry leaders.
With that in mind, here are a few suggestions from us:
- Userpilot Blog: Userpilot’s blog delves into product analytics, user onboarding, and behavior-driven insights. They offer actionable advice on how to use data to understand and improve the user experience, making it a valuable resource for analysts focused on product growth.
- Kaggle Blog: Kaggle is a renowned platform for data science competitions and collaboration. Their blog features insightful articles, tutorials, and interviews with top data scientists. It’s a go-to resource for learning about cutting-edge techniques and real-world applications.
- KDnuggets: This blog focuses on news and tutorials related to data science, machine learning, and artificial intelligence. It offers a mix of technical and non-technical content, making it suitable for both beginners and experienced analysts.
- DataCamp Blog: DataCamp’s blog complements its online courses with insightful articles on data analysis, visualization, and career advice. Their content is known for its clarity and practical approach, making it ideal for both beginners and experienced.
Best podcasts for data analysts
Podcasts offer a convenient and engaging way to learn on the go, whether you’re commuting, exercising, or simply relaxing. Here we include a list of useful podcasts that can make your data analyst life a bit easier:
- The Analytics Power Hour: This podcast features casual conversations among experienced data analysts and scientists about industry trends, tools, and challenges. You can find it on popular platforms like Spotify, Apple Podcasts, and Google Podcasts.
- Not So Standard Deviations: Hosted by Roger Peng and Hilary Parker, this podcast delves into the world of data science, covering topics from statistics and programming to career advice. It’s known for its in-depth discussions and thought-provoking interviews with experts in the field.
- DataFramed: Hosted by Hugo Bowne-Anderson, this podcast features interviews with industry leaders about data science, machine learning, and artificial intelligence. It explores the broader impact of data science on society and different industries.
- Data Skeptic: This podcast explores the science behind data, covering topics like statistics, machine learning, and data analysis. It offers a mix of mini-episodes and longer interviews that cater to both beginners and experienced professionals.
- Women in Data Science: Features interviews with women working in data science, providing valuable insights and career advice. (Available on Apple Podcasts).
Best tools for data analysts
Data analysts rely on a suite of powerful tools designed to collect, process, analyze, and visualize data. So here’s a list of the top tools that every data analyst should consider:
- Userpilot (Best for no-code product analytics): Userpilot is a no-code product analytics tool that helps product managers and data analysts understand user behavior and track product adoption. It provides features like metrics dashboards, reports (funnel, path, trend, cohort), user feedback, etc. This tool can help foster cross-team communication, bridging the gap between technical and non-technical teams.
- Tableau (Best for data visualization): Tableau is a data visualization tool that allows users to create interactive dashboards and reports. This can help data scientists identify trends and patterns in their data that would be difficult to see in a spreadsheet.
- Power BI (Best for business intelligence): Power BI is a business intelligence tool from Microsoft. It allows users to connect to a variety of data sources, create reports and dashboards, and share insights with others.
- Google Charts (Best for simple data visualization): Google Charts is a free data visualization tool from Google. It allows users to create a variety of charts and graphs, such as bar charts, line charts, and pie charts.
- Amplitude (Best for product analytics): Amplitude is a product analytics tool that helps businesses track user behavior and understand how users interact with their products. It provides features like funnels, user paths, and cohort analysis.
- Heap (Best for digital analytics): Heap is a digital analytics tool that automatically captures all user interactions on a website or app. This makes it a good option for businesses that want to track every user interaction, even if they don’t know what specific data points they are interested in yet.
- Mixpanel (Best for user behavior and predictive analytics): Mixpanel can help data scientists by providing them with a wealth of data on user behavior. This data can be used to improve product design, marketing campaigns, and overall user experience.
- Qualtrics (Best for survey research): Qualtrics can help data scientists by providing them with a way to collect data from a large number of people. This data can be used to identify trends and patterns in customer or employee sentiment.
- Optimal Workshop (Best for user research): Optimal Workshop is a user research tool that helps businesses conduct user testing and gather feedback from users. It provides features like card sorting, tree testing, and surveys.
- UserTesting (Best for user testing): UserTesting is a platform specifically designed for conducting remote user testing. Users can be recruited through the platform itself, allowing data scientists to gather feedback from a diverse range of people.
UX/UI Design and Research Teams Can Use Userpilot to:
![]()
- Recruit Users for Usability Tests with Usage Analytics and Segmentation
- Collect User Feedback with In-App Surveys
- Understand Product Usage with Product Analytics
Conclusion
Now that you have a better understanding of the salary range for a data analyst position, you can take steps to improve your earning potential.
Consider pursuing relevant certifications, developing your skillset, or negotiating effectively during the job offer stage.
Looking into tools for data analysts? Userpilot is an all-in-one product platform with engagement features and powerful analytics capabilities. Book a demo to see it in action!
About the author