Why is event-based analytics important for SaaS businesses?
Event-based analytics allows product teams to gain insights into how customers are using their products. You can identify patterns and trends by tracking user behavior, leading to more informed decision-making about product development and marketing strategies.
In this article, we’ll discuss:
- The benefits of event-based analytics in detail.
- How to collect and use data for analysis.
- The best platforms for getting product growth insights.
Try Userpilot Now
See Why 1,000+ Teams Choose Userpilot

What is event-based analytics?
Event-based analytics is the process used to track and analyze interactions between customers and your product.
Events are any behavior or action a user takes at different touchpoints across the customer journey. Examples of such user interactions in your app include engaging with a feature, completing a checklist, purchasing a subscription plan, or clicking on a help article.
Benefits of tracking event-based analytics
Tracking event involves monitoring most business value metrics. Moreover, it lets you track product metrics and helps you know why it’s happening.
Here’s how event analytics benefits your business:
- Understand how users interact with your app: Event tracking allows you to identify patterns in user behavior within your app. User behavior reflects the motivation and intention behind actions taken by a customer.
- Measure the overall product performance: Conducting event-based analytics at multiple touchpoints throughout the user journey enables you to evaluate the overall product performance.
- Identify opportunities for product improvements: Understanding how users interact with your product helps you identify friction points in the app and improve these areas to improve customer satisfaction.
- Build personalized engagement: Event-based analytics lets you understand user expectations and segment them into groups based on common needs. You can then offer personalized customer experiences to each segment and enhance user engagement.
How to collect data for event-based analytics
Events and users are the two keys to performing event-based analytics. Here’s how you can collect event data to understand what users are doing with your product.
Set up custom events using APIs
You need a developer to set up a custom event using APIs. Userpilot allows you to create and track custom events through Javascript or Rest APIs.
All you have to do is specify the event data you wish to track along with its API key. The APIs will track events about the customers that meet any criteria used to describe the event.
There are two common use cases for tracking events using APIs:
- Tracking server-side events: There are situations where some events can only be reached by your server, such as high-volume critical events like marketing campaigns.
- Importing historical event data: Users usually want to import historical data upon evaluation or migration. This allows you to use APIs for historical user identification.
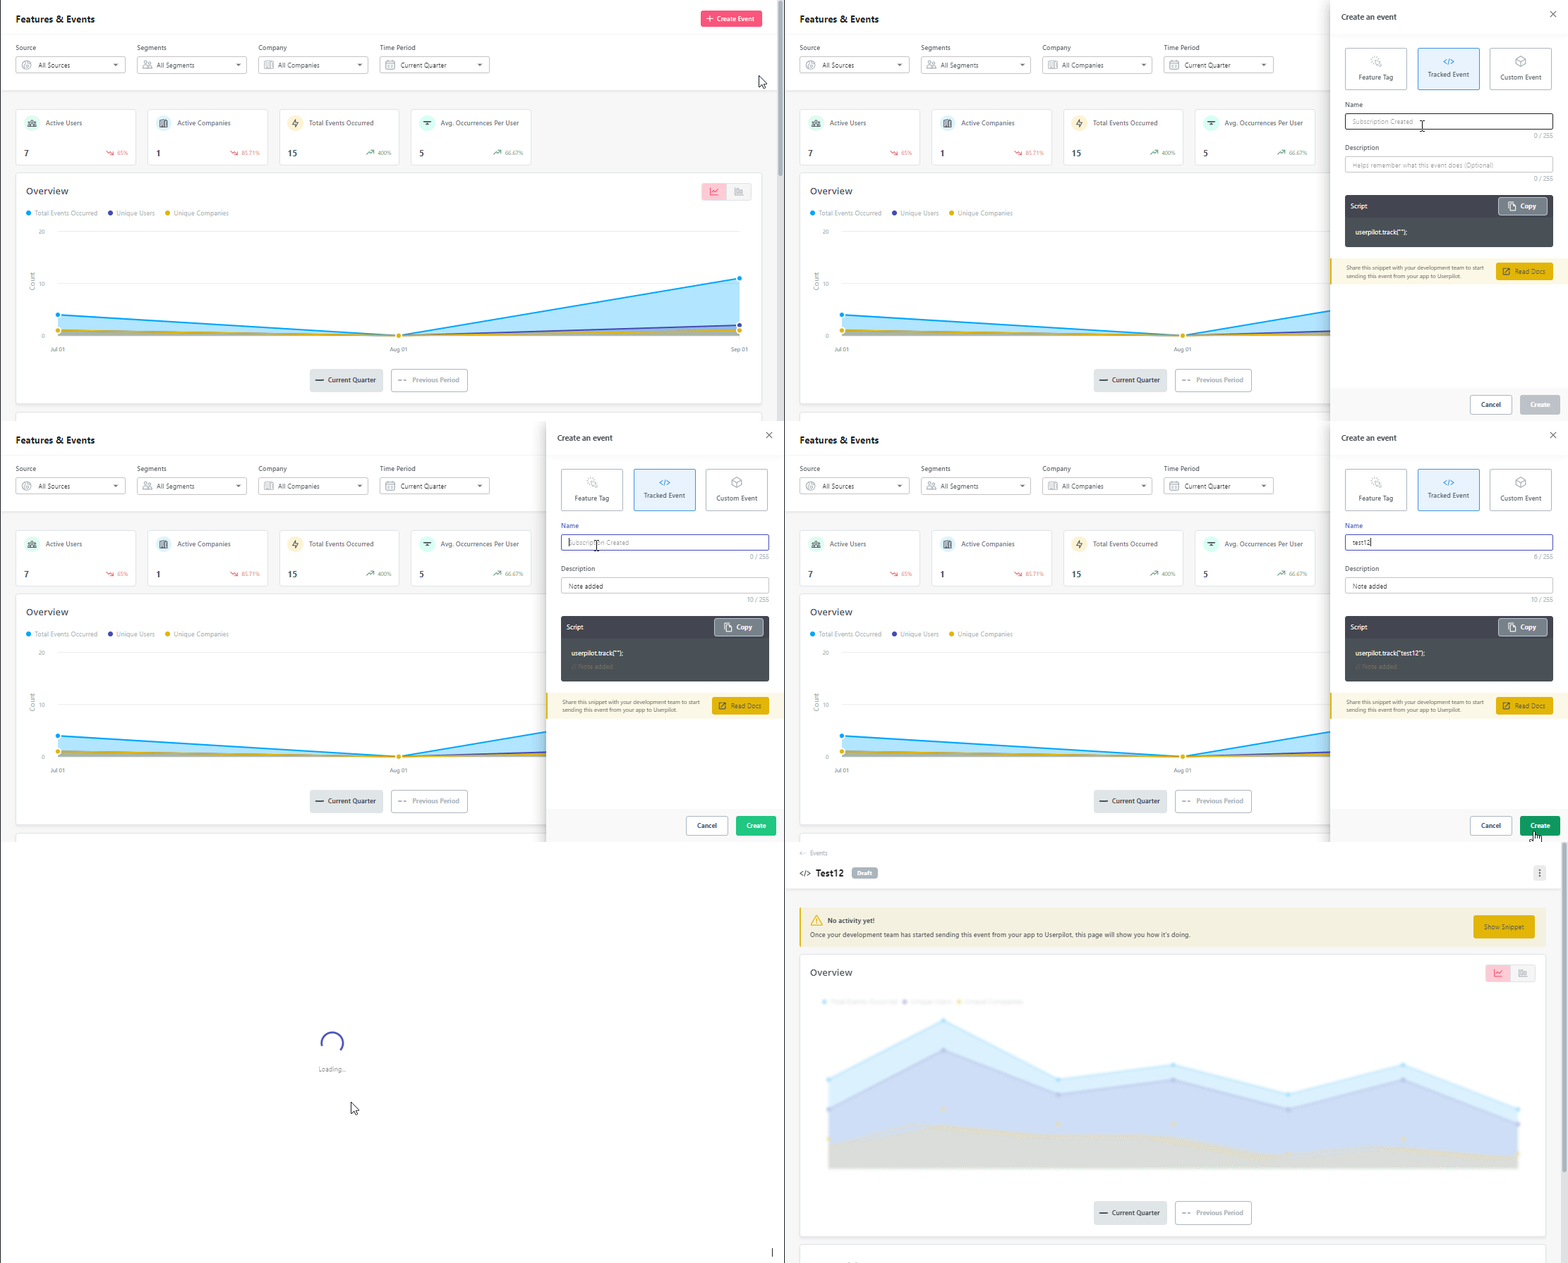
The ‘Tracked Event’ option below is easy and quick to implement. Once the tool completes tracking, you can see the analytics results in the overview tab.
How are you currently approaching event-based analytics?
What’s your biggest challenge with user journey analysis?
How do you currently act on your user insights?
Unlock the power of your event-based analytics.
Stop guessing and start seeing. Userpilot gives you the power to not only track user behavior with no-code event-based analytics but also to act on those insights instantly with targeted, in-app experiences. Understand the complete journey, fix friction, and drive adoption.
Track events with click tracking
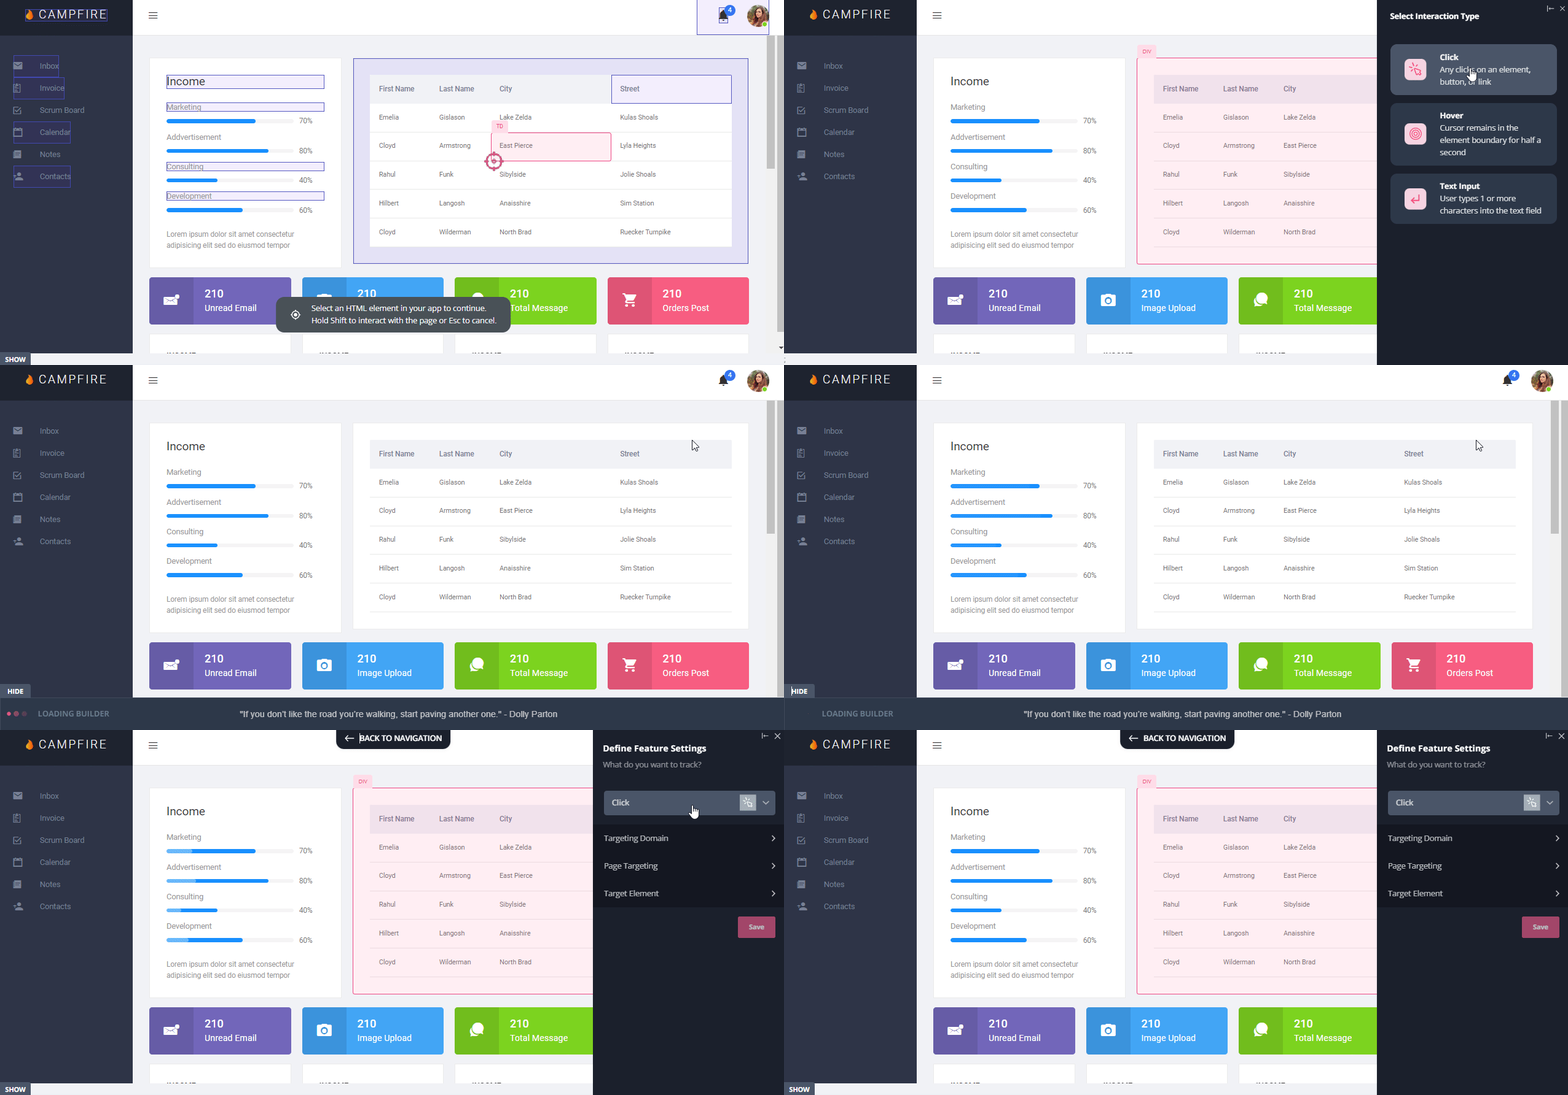
You can tag UI elements to track hovers, clicks, or text inputs made by customers. Userpilot lets you do this without any coding.
However, click tracking through UI tags doesn’t involve server-side events. Therefore, the results may not be as accurate in certain situations.
The GIF below shows how to track clicks using Userpilot’s feature tagging functionality. You can capture clicks on several elements together, and the red borders highlight what the cursor detects.
Track custom events without coding
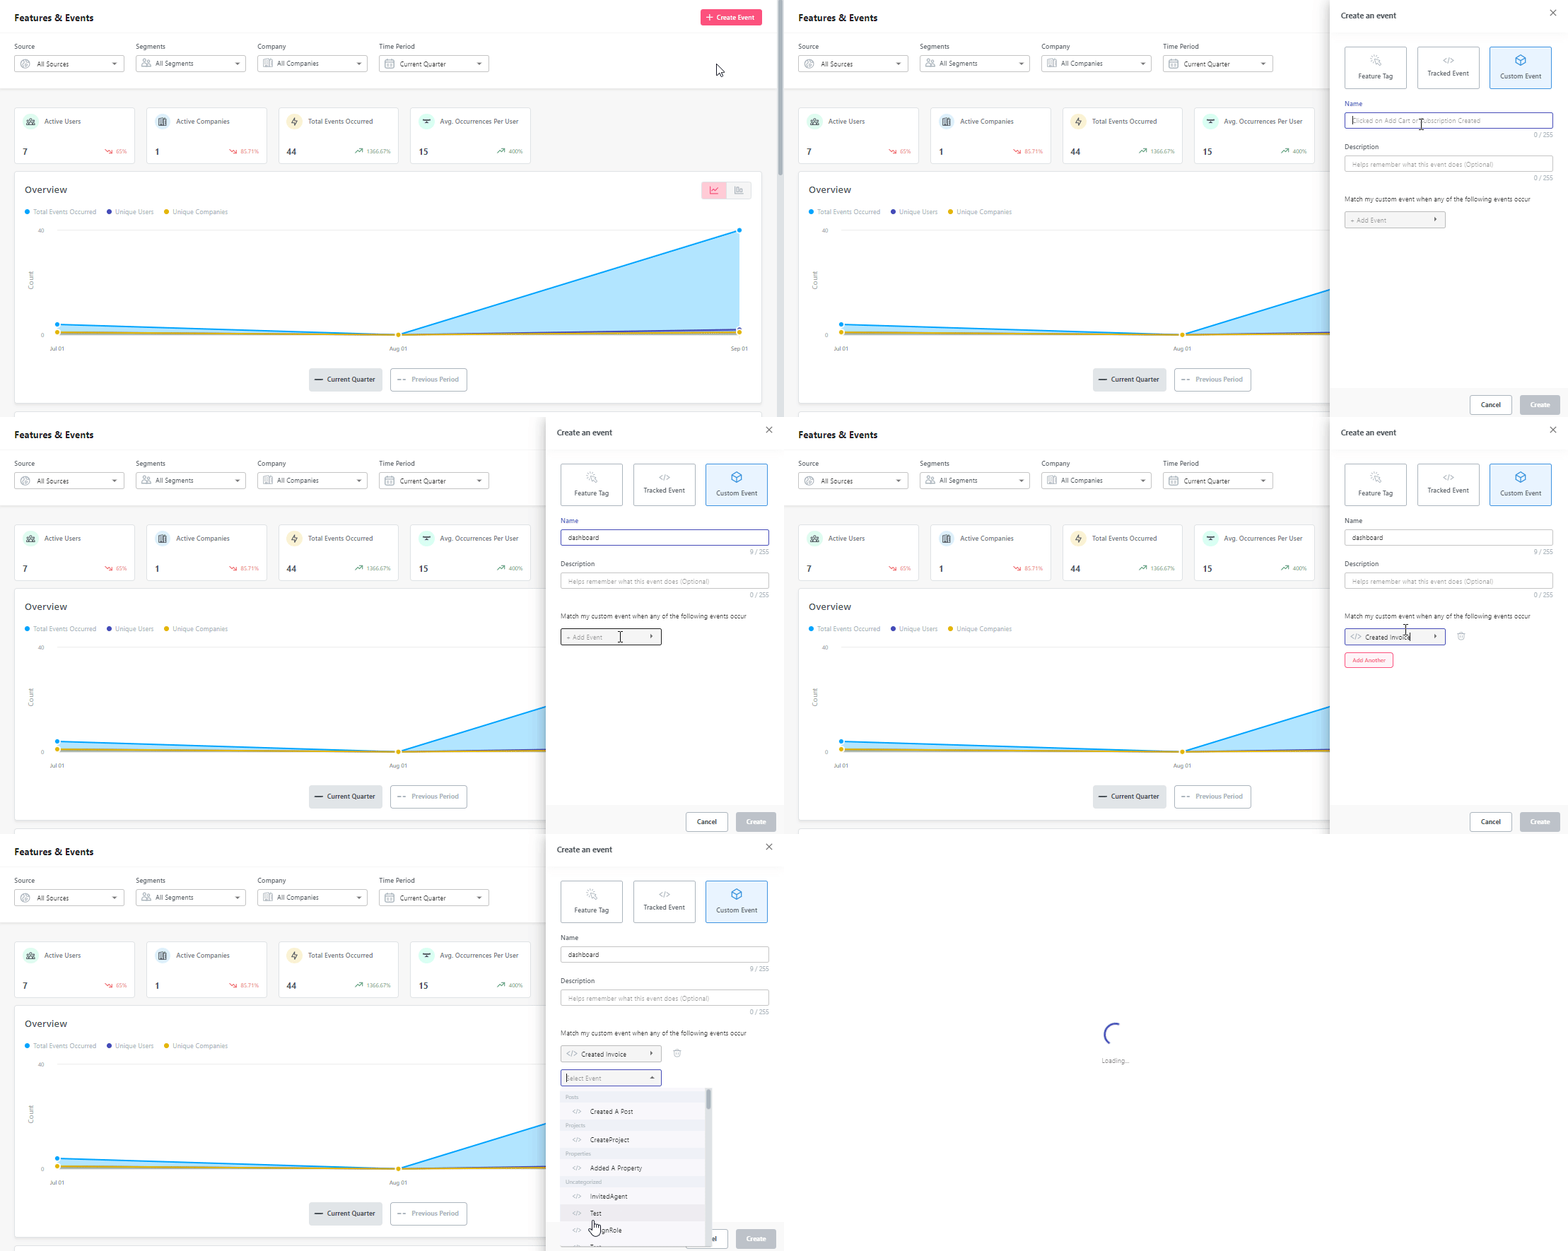
With Userpilot, you can track multiple events by grouping them under a ‘custom event.’ One custom event can consist of any combination of server-side and non-server-side events.
To create a custom event, you only have to name it and choose the events you want to cluster together. The custom event will match when any of the specified events occur.
The gif below illustrates this unique feature of Userpilot.
How to use event data for event-based analytics?
Let’s see how you can leverage all the data for event-based analytics.
Identify friction and drop-off points with funnel analysis
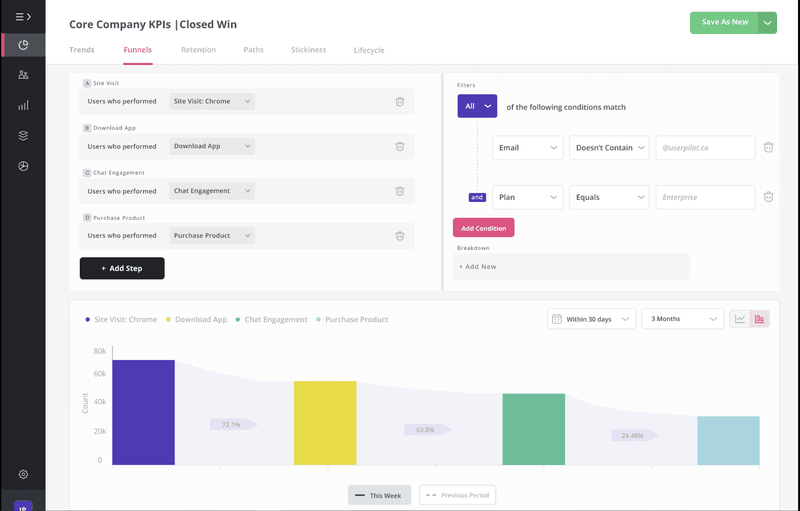
Tracking event data enables you to perform funnel analysis. Use custom events to include all events that sequentially lead to a particular conversion point.
The analytics will help you understand how customers progress through a funnel, such as a conversion funnel or customer activation funnel.
Moreover, conversion funnel analysis can reveal friction points in the journey to conversion. These points create frustration and can even hinder users from meeting their goals. Therefore, these friction points could also cause some customers to drop off.
For instance, you can track key performance indicators such as the number of users visiting your site and making a purchase.
Furthermore, you can use funnel analysis to monitor customer success at various stages of their journey and check how quickly they complete each stage. If they take too long or fail to complete the stage, you have to take steps to optimize your product.
Here’s a view of the upcoming funnel analytics feature in Userpilot.
Understand user behavior patterns using segmentation analysis
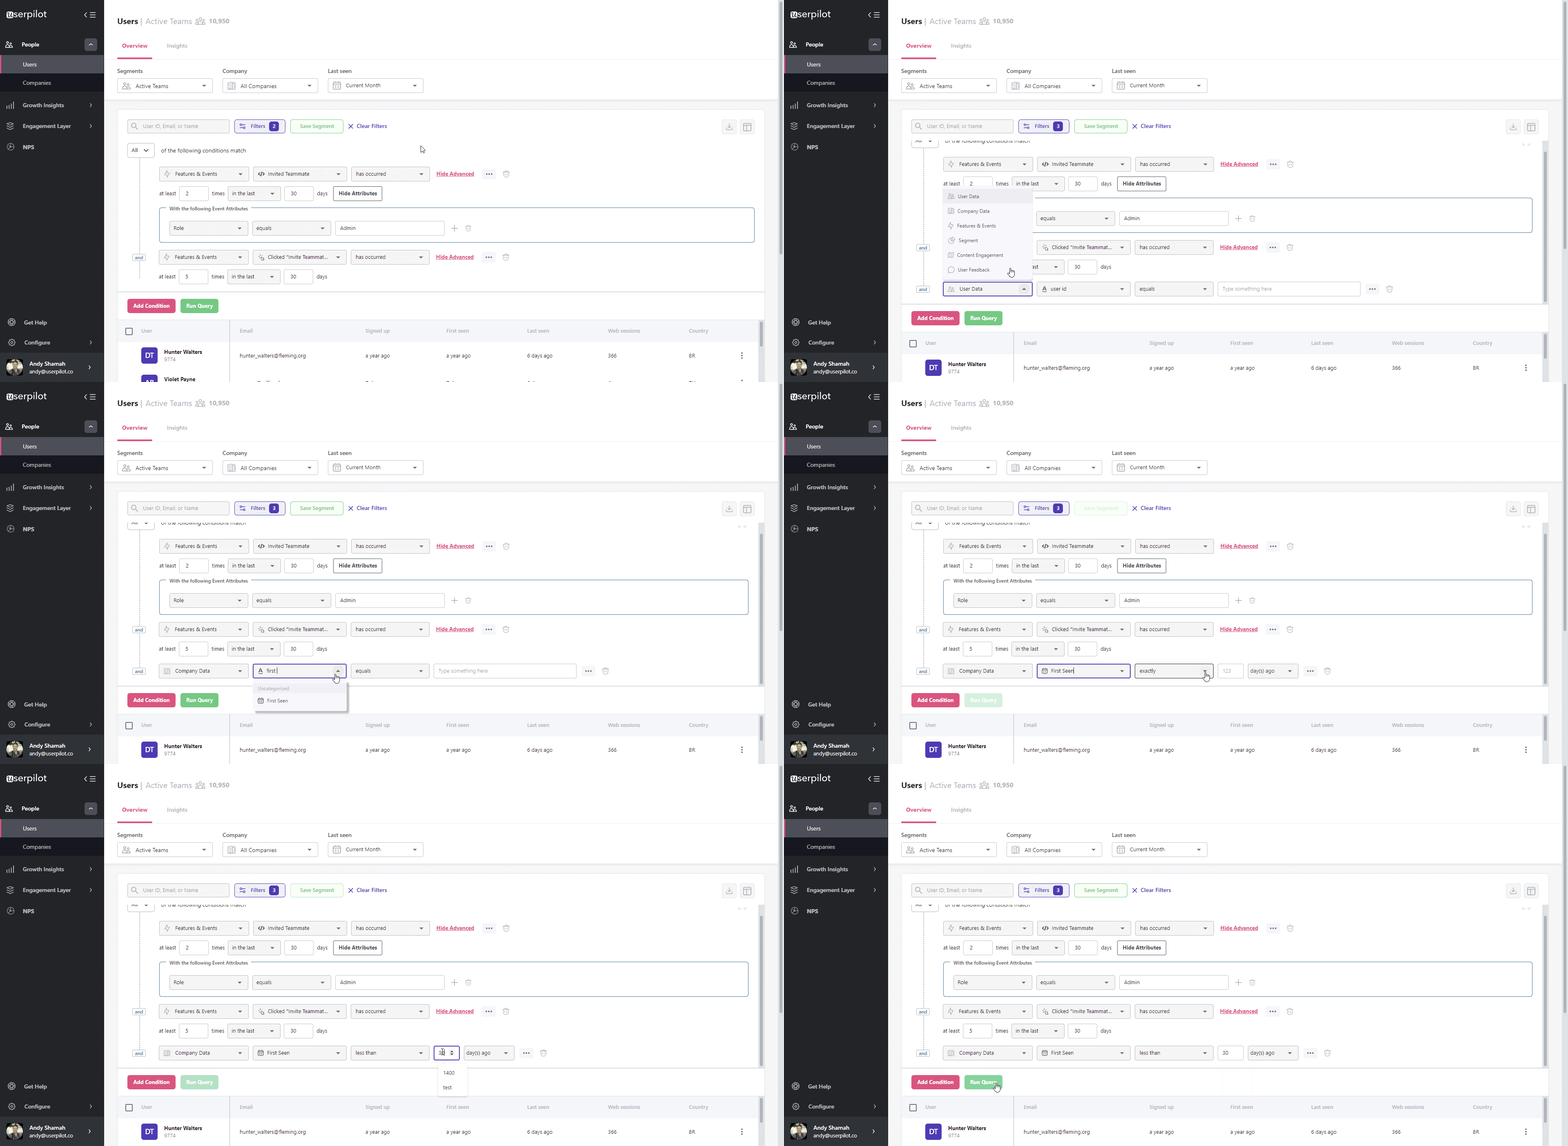
Customer segmentation is the process of dividing users into distinct groups based on certain common characteristics, such as their roles and the jobs to be done. You can collect the required data through customer surveys, such as those in the sign-up flow or welcome screen.
Event-based analytics is a very effective tool for segmentation analysis.
You can track and compare user behavior over time. Analyzing user behaviors help reveal potential churn patterns, and you can proactively reach out to dissatisfied customers.
Userpilot has an advanced segmentation functionality that lets you create user segments based on multiple criteria. You can then track the events each segment completes to find their feature engagement level, helping you identify any inactive user segment.
Use path analysis to understand key user journeys
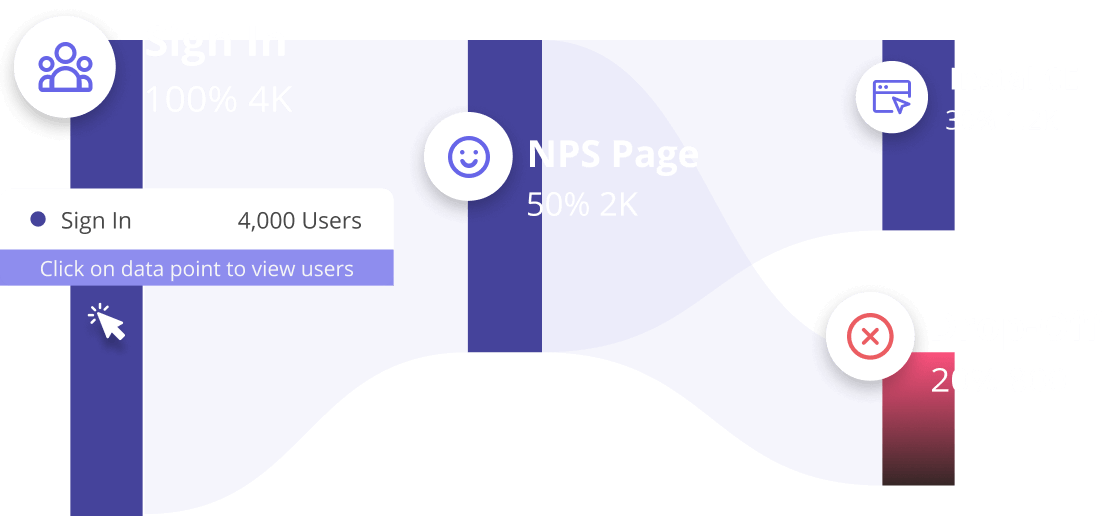
Path analysis dives into the actual steps users take as they move through your product. It helps you understand what happens after a key event or what leads up to a specific outcome.
You can start by mapping the journey after sign-up. Do users explore core features right away? Do they get lost in low-value sections? Alternatively, you might begin with a conversion event such as “Clicked Upgrade” and trace the most common steps users took before reaching it. This helps identify both effective paths and areas where users frequently drop off or loop around without progressing.
Path analysis is especially useful for identifying friction. If users visit the pricing page repeatedly without converting or keep returning to the same settings menu, it suggests confusion or unmet expectations. On the other hand, it can highlight discovery patterns. For example, you might see that users who reach your reporting dashboard tend to come from the integrations tab, revealing an opportunity to streamline that flow.
For better insights, compare paths across different user groups. New users may behave differently from returning ones, and free users may follow less efficient paths than those on a paid plan.
Best event-based analytics platforms for actionable product insights
Your product growth efforts would be incomplete without the right platform. So let’s look at the 3 best event-based analytics tools.
Userpilot – Best for collecting actionable data for event-based analytics
Userpilot is a product growth platform that enables users to increase product adoption and improve the onboarding experience. In addition to its powerful web-based tools, Userpilot also allows you to onboard and engage mobile app users by creating personalized messaging, push notifications, and surveys. It’s the best tool for collecting actionable user data for event-based analytics.
Userpilot supports event data management and lets you gather various types of event-based data:
- Autocapture
- Custom events (through JavaScript and REST APIs)
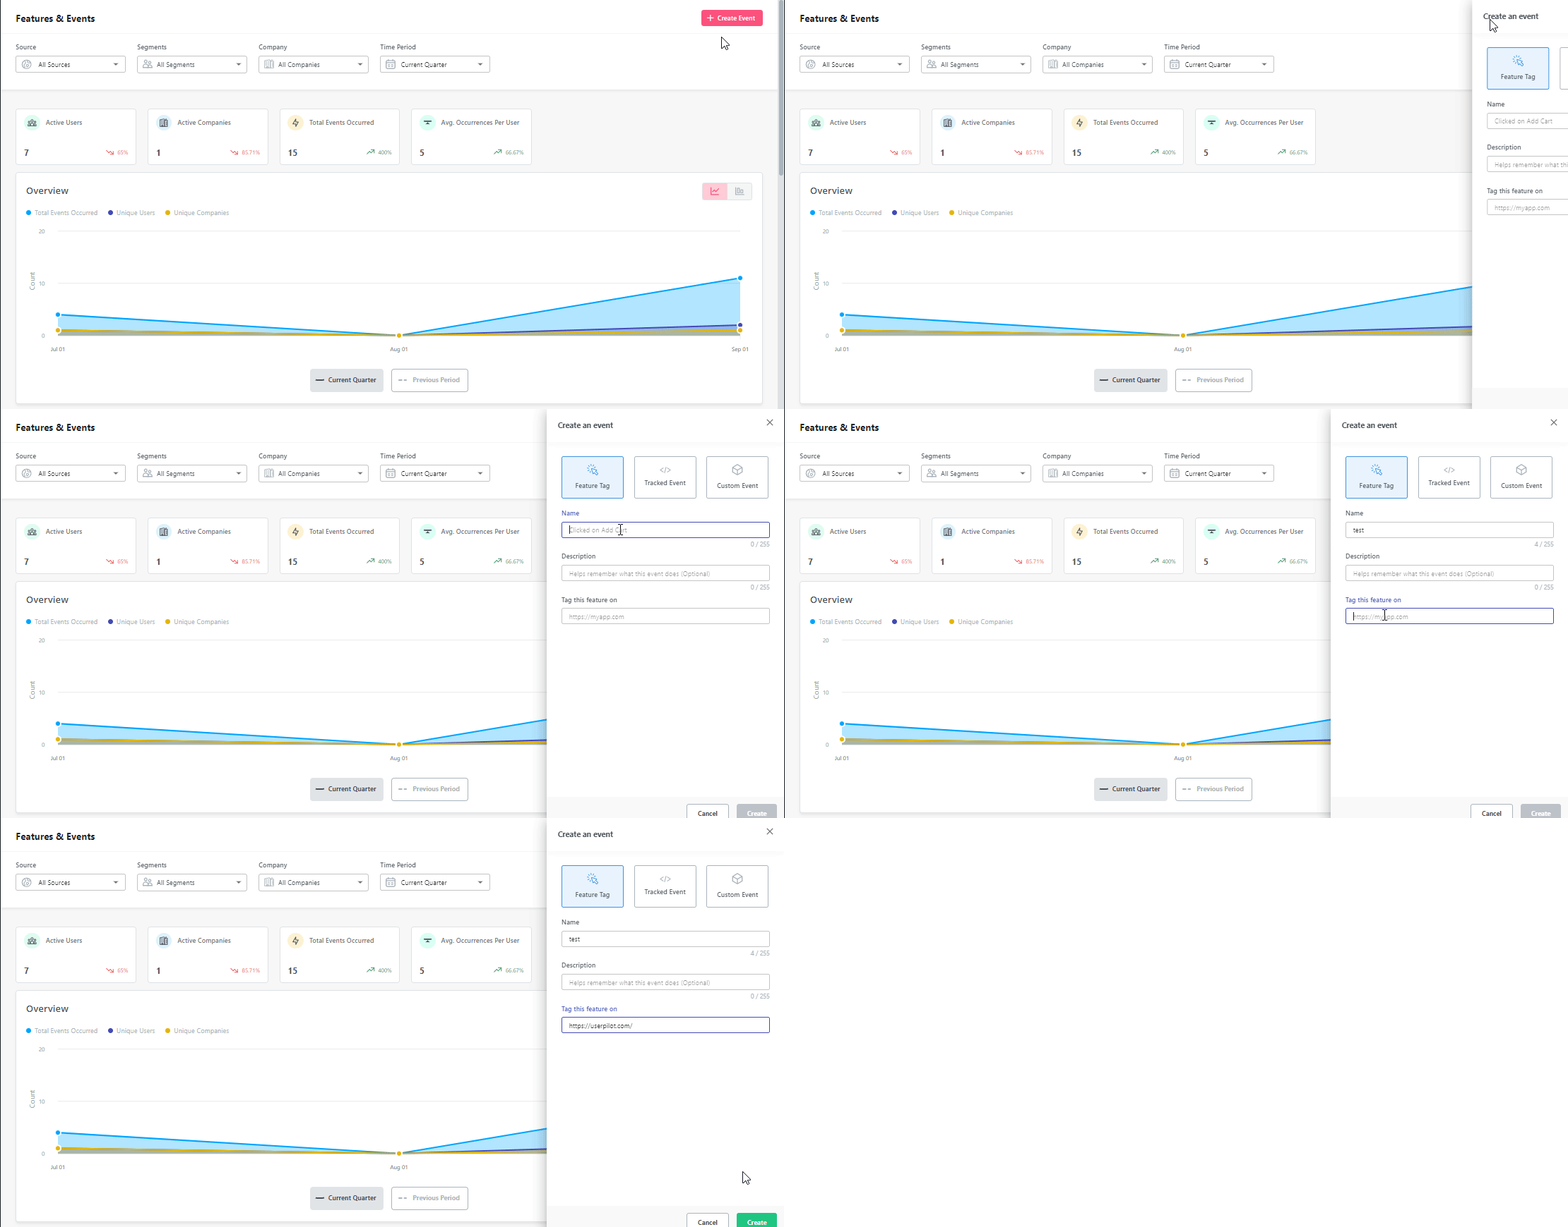
With its powerful product analytics feature, Userpilot allows you to use advanced segmentation and provide hyper-personalized experiences to each segment.
Moreover, Userpilot lets you select and put specific events under a custom event without coding.
Userpilot integrations let users use other event-based analytics tools such as Heap, Mixpanel, Google Analytics, Amplitude, and Segment.
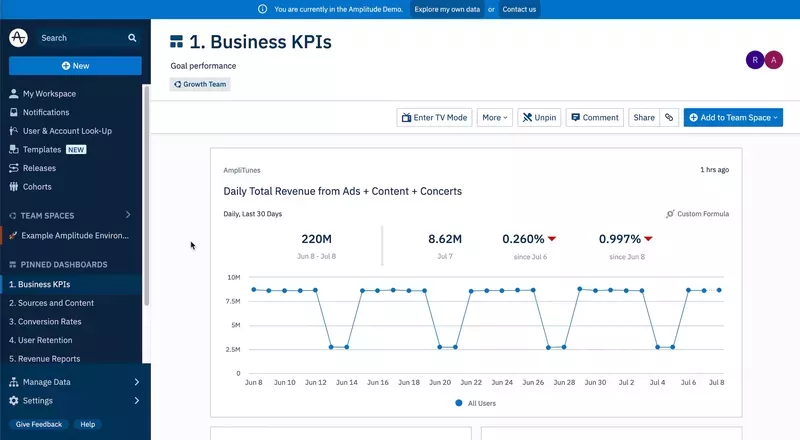
Amplitude – Best for creating event-based analytics dashboards
Amplitude is an analytics platform that includes various analytics dashboards for displaying event-based data. It also lets users build custom dashboards.
Amplitude’s features include:
- Customer segmentation/cohort analysis
- Milestone analysis to track goals
- Funnel analysis and finding conversion drivers.
However, Amplitude Analytics doesn’t offer as many actionable products as Userpilot.
Google Analytics – Best for conducting event-based data analysis for websites
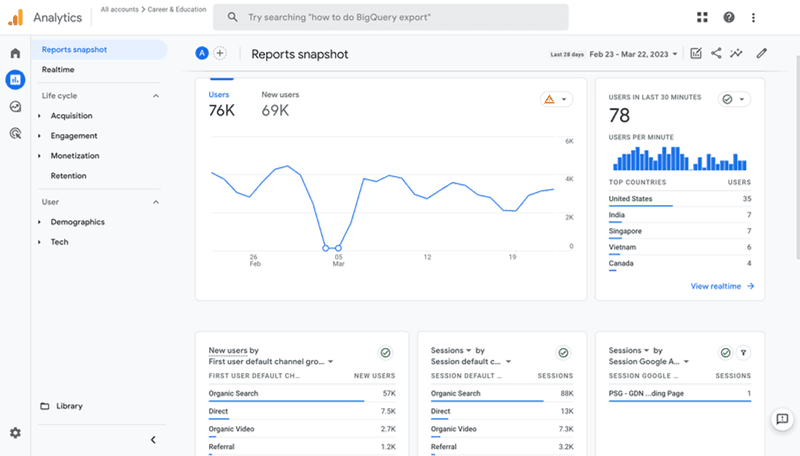
The next generation of Google Analytics GA4 allows users to track event-based analytics, particularly for websites.
Its analytics features consist of the following:
- Event action, event category, and even label filtering
- Goal/Conversion tracking
- Real-time reporting
- Acquisition reports
- Behavior reports
- Audience reports
- Custom dashboards.
Conclusion
Event-based analytics is one of the most crucial analytics for obtaining product growth insights. You can incorporate these insights into growth strategies to enhance the customer experience and boost retention.
Want to get started with event-based analytics? Get a Userpilot demo and see excellent results for your business.


