How to Run Feedback Analysis and Still Ship Features Fast



Feedback analysis is the process of turning customer comments into decisions about what to build next. For product teams, this means mining user feedback from surveys, support tickets, reviews, and interviews for the handful of things worth adding to the roadmap.
However, that decision is getting harder to make on time. Say you spend weeks collecting and analyzing open-ended survey responses about last month’s release. By the time you’re done, three more features have shipped, and none of your findings account for them.
As AI helps ship features in record time, the mismatch between feedback analysis and development won’t go away soon. So, instead of trying to fix it by reading responses faster, I started to automate around it using a set of relevant tools and techniques. Here’s what that actually looks like.

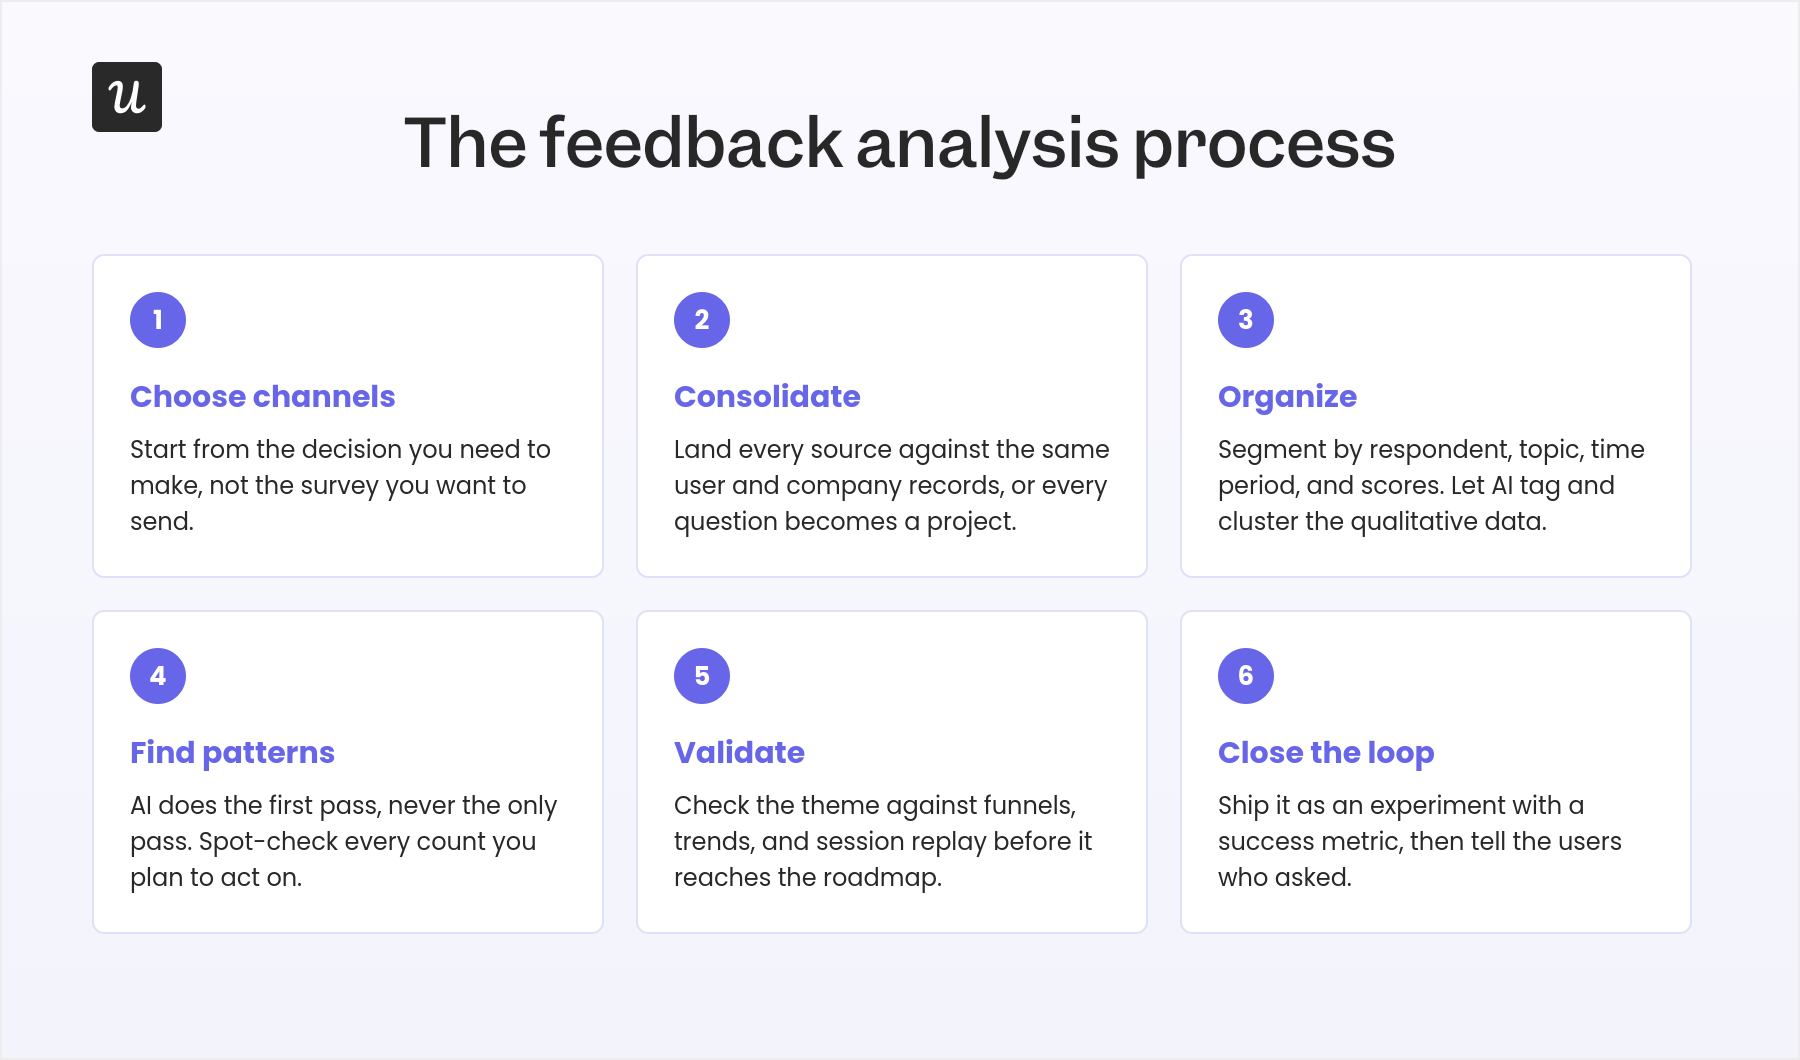
My 6-step feedback analysis process for agile teams
This framework shortens your time to insight, so you can make quick and confident decisions about what matters most to your users.
1. Determine your feedback channels based on your goals
Focusing on a few channels that align with your product’s goals beats collecting all kinds of feedback you won’t even read. It tells your team from the get-go what you’re optimizing for, and why. For instance, if your activation rate is declining, and you want to improve this metric by the end of the quarter, you know you must collect feedback on your onboarding process, signup flow, and early feature discovery.
Here are some sources of feedback that are useful for product teams:
- In-app pulse and microsurveys: These involve one or two questions triggered after a specific action (e.g., achieving a milestone or adopting a feature). Microsurveys that appear in-app are good for analyzing a single moment in the flow, such as why someone abandoned setup.
- CSAT surveys: You can launch a feature satisfaction survey, a type of CSAT, once users have engaged enough to form an opinion. This lets you understand sentiment after a release and informs future iterations.
- CES surveys: Measure how much mental or physical effort users spend to interact with specific features. The customer effort score is the one I trust most for onboarding and workflow decisions because effort usually correlates more strongly with friction and churn.
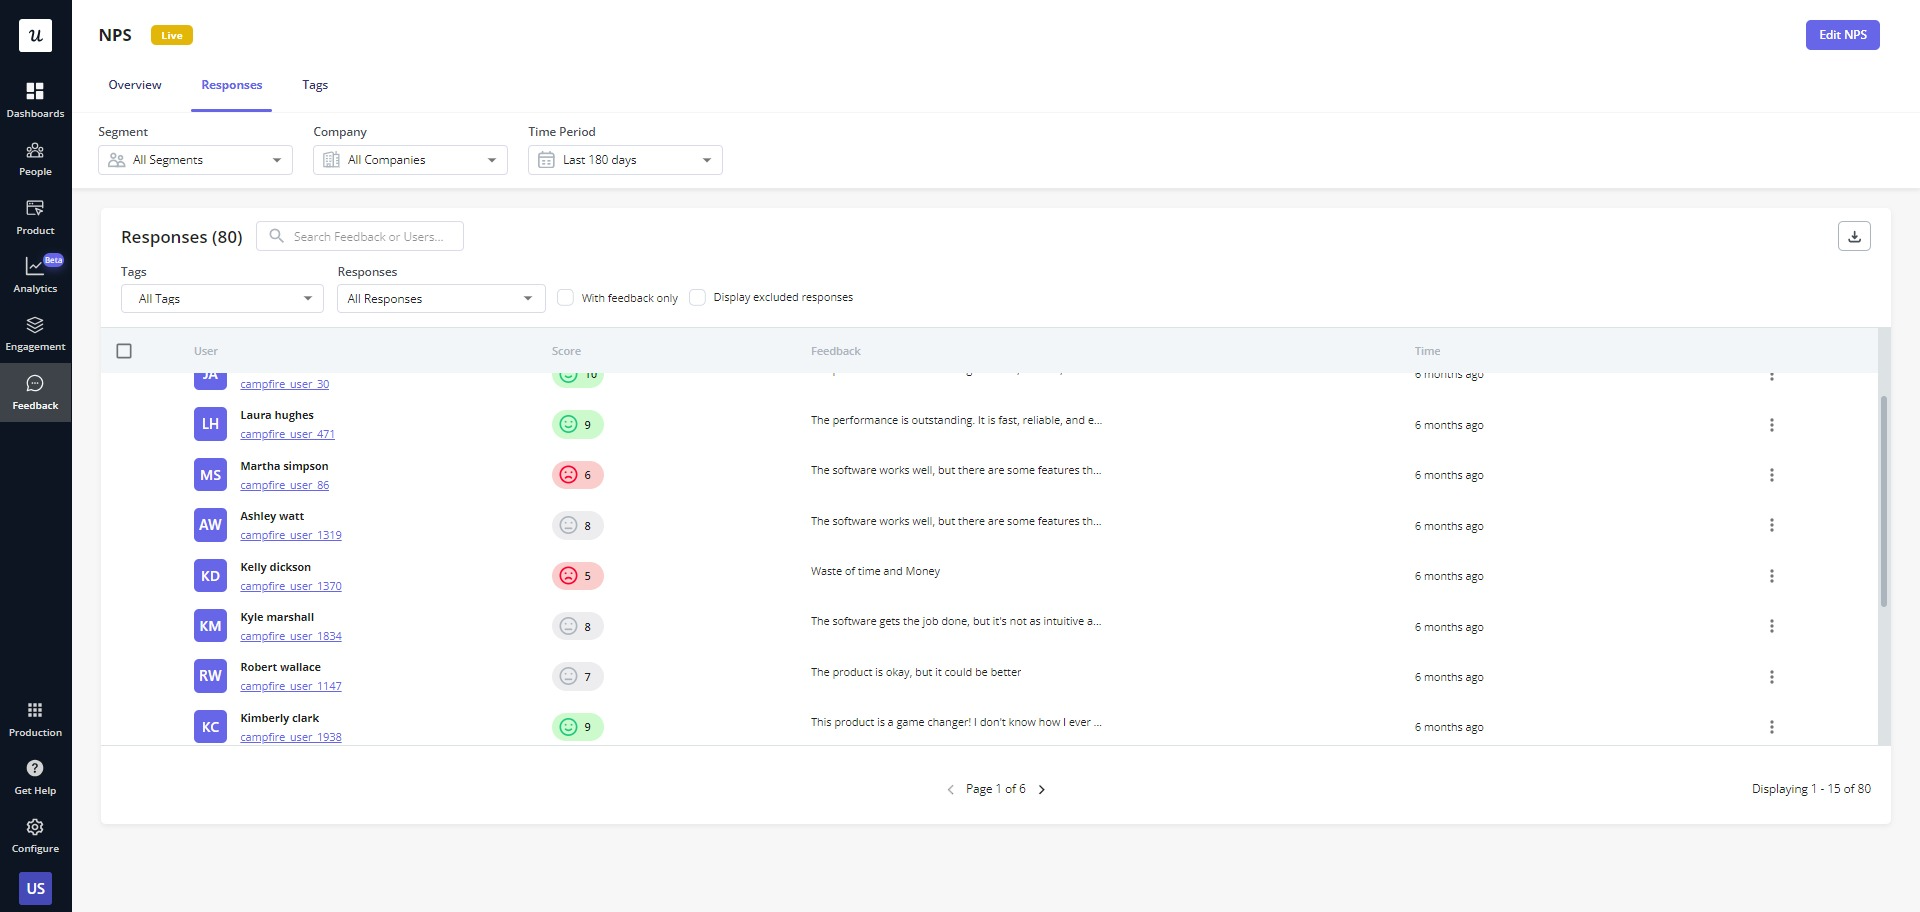
- NPS surveys: Net Promoter Score traditionally measures customer loyalty. I’ve found it more useful for segmenting detractors/passives/promoters, and for collecting qualitative data through follow-ups.
- Passive feedback widgets: These in-app widgets usually display as a side tab or floating button that users can click on demand. Passive feedback is good at catching bug reports and feature requests, and problems your surveys never considered.
- Support tickets and conversations: The highest-intent qualitative source you own. Recurring ticket categories are usually a UX problem wearing a support costume.
- Public reviews and community spaces: These include public platforms such as G2, Reddit, and your own community. Feedback can come in more slowly, but these channels reveal how your product compares with competitors and let you ask for reviews proactively rather than wait for them.
2. Consolidate your feedback channels in one place
Good feedback analysis starts with good instrumentation, and this is the step many product teams struggle to put together. Survey responses live in one tool, tickets in another, reviews in a spreadsheet somebody maintains manually. Behavioral data, the record of what users actually did instead of what they said, usually sits in a fourth system nobody outside the data team can query.
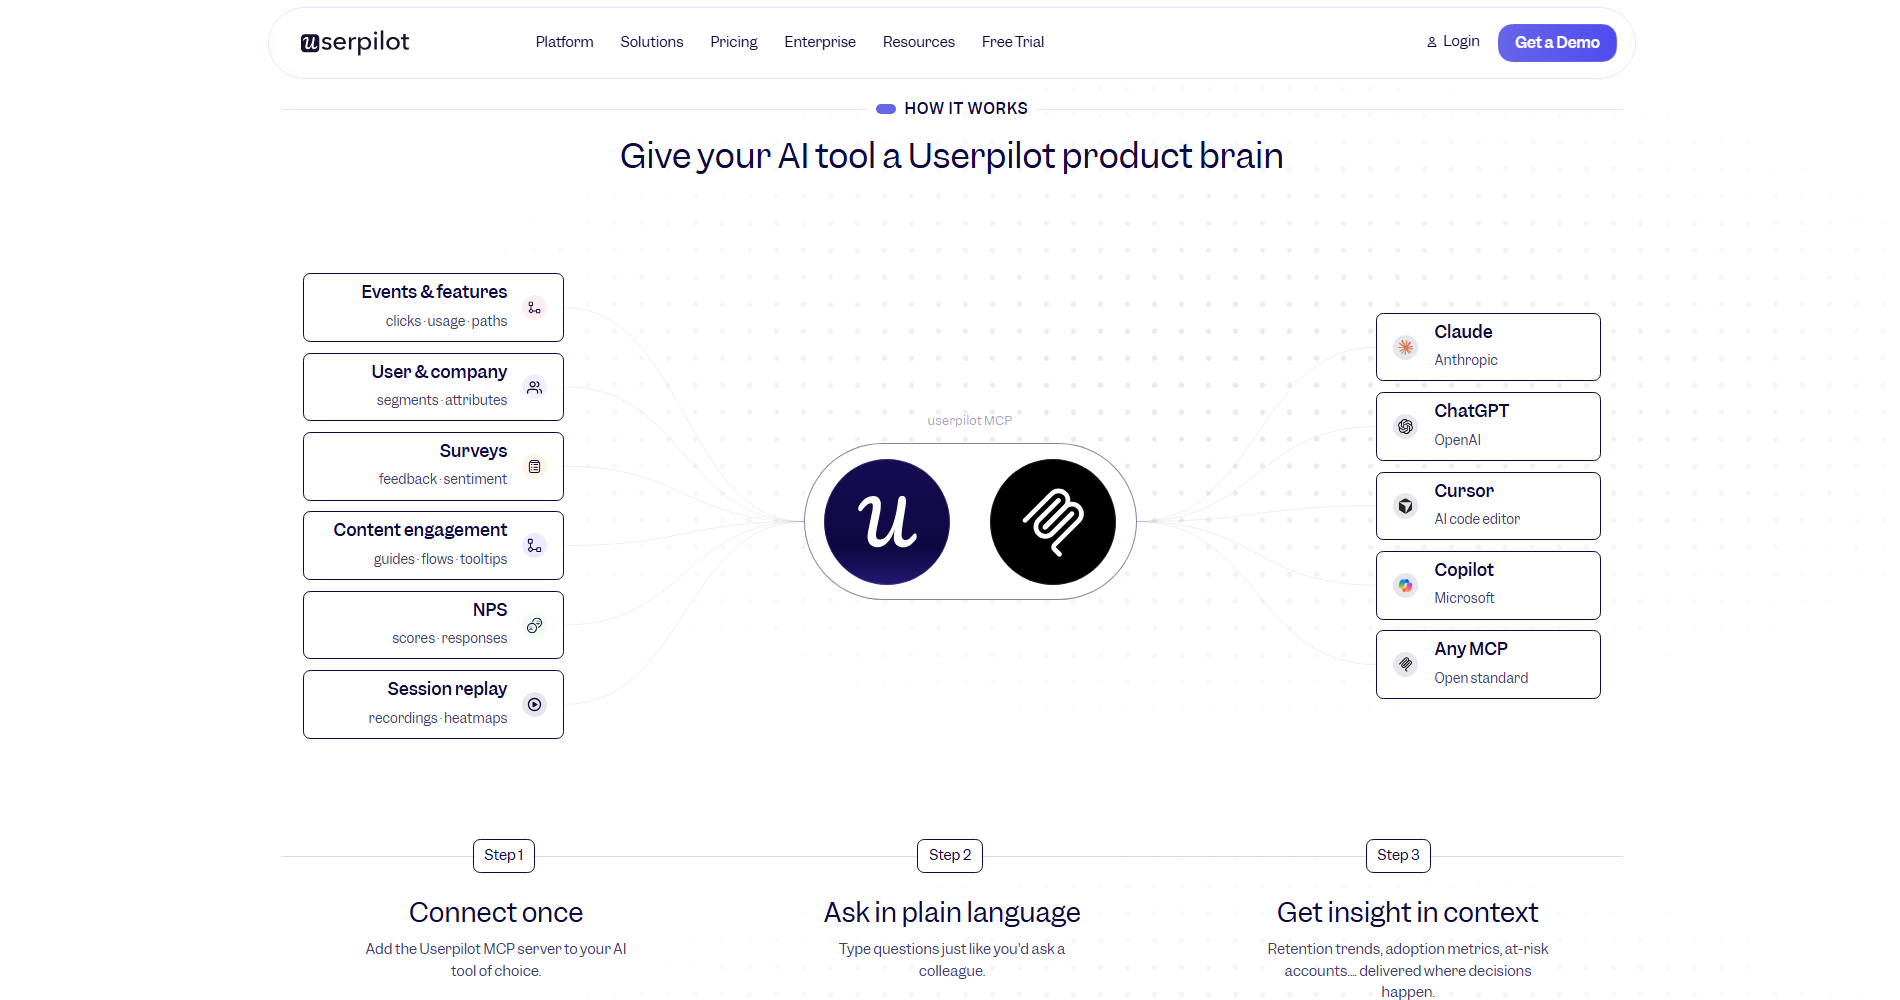
My actual solution is to consolidate feedback collection, product analytics, and session replay into a single place where your user data is organized. In Userpilot, for instance, all survey responses, in-app events, and session replays are connected to a single profile. Sure, you can build a solution yourself (just make sure to pick one identifier that every system shares, usually a user ID and a company ID). Still, you could invest those development and maintenance costs in your product instead.
If you want to take it a step further, you can query the connected data without manual exports using Userpilot’s MCP Server. Our CEO, Yazan Sehwail, explains why this is a game changer:
Using session replay, NPS data, survey data, and product usage data, you’re able to get your answer without having to go to Userpilot, without having to pull data and upload it to [another tool].
3. Organize feedback before you analyze it
You or your AI tool needs an orderly way to sort through the data. This is where segmentation comes in:
- Segment feedback based on the respondent, topic of concern, time period, and scores. Since that same profile from Step 2 already holds a respondent’s plan, activity, and history, I build that segmentation directly in Userpilot’s Segments instead of a spreadsheet.
- For quantitative data (ratings, NPS scores, scales), this means breaking it down by group first (e.g., new vs. long-time users, paying tier, whether they’ve actually gotten set up) before examining any aggregate numbers. An overall NPS score of 42 tells you nothing useful. It could be hiding the fact that happy, active users are giving you a 65, while people who quit in their first month are giving you an 18.
Meanwhile, you can ask AI to do the tagging and thematic clustering for qualitative data (open text), whether that’s pasting responses straight into your chat tool or pulling them in through the MCP Server.
Note: AI summaries can miss important details in qualitative analysis. Always spot-check AI output against a sample of raw responses before taking any findings as fact.
4. Find patterns and form hypotheses with AI
Reading and finding hidden insights in survey responses is the most time-consuming part of feedback analysis, which is exactly where AI earns its keep. In Maze’s Future of User Research Report 2026, 69% of product teams now use AI in their user research workflows, mostly for automating analysis and synthesis.
But I need to stress that AI isn’t magic. Potential bias in AI algorithms, data privacy and security gaps, and AI dependence overriding human judgment are real, serious concerns. It isn’t far-fetched to encounter AI hallucinations while working on a batch of survey responses.
If you ask me, hallucinated data is worse than no analysis, because it can potentially lead to misleading decisions. Teresa Torres, author of Continuous Discovery Habits, warns that AI summaries can miss 20 to 40% of important details, and this matters a lot once you’re discussing the roadmap with your team.
So the rule I follow is simple: read a sample of raw responses myself, verify every AI claim, and treat every AI output as a hypothesis to test, not a conclusion.
5. Correlate feedback with behavioral data to validate hypotheses
I said you shouldn’t take any AI claim as a conclusion, but neither should you with regular human feedback.
This is because users are, in reality, bad at describing their own friction. Feedback data alone only leads to hypotheses that might or might not be true. To validate them, we need to cross-reference what users say with what they do in the product using behavioral data. From there, we can extract the actionable insights.
Our Head of Customer Success, James Mitchinson, puts it from his own experience:
Sometimes customers have a hard time articulating what is going wrong or what they’re experiencing frustration with. They might just say building a flow feels too hard in our platform. It’s really nice to see what they mean by that by actually going and watching them go through that journey and try to complete the behavior.
For us, this usually means using product analytics tools such as:
- Funnel reports: Which show where users drop out in a flow (e.g., onboarding, feature adoption, checkout).
- Path analysis: Where you can observe the exact chain of actions that users perform inside your product.
- Cohort analysis: Which groups users into cohorts (usually by signup date) and tracks their monthly retention rates to search for churn factors.
- Trend reports: Which display whether a behavior is growing or decaying after a release.
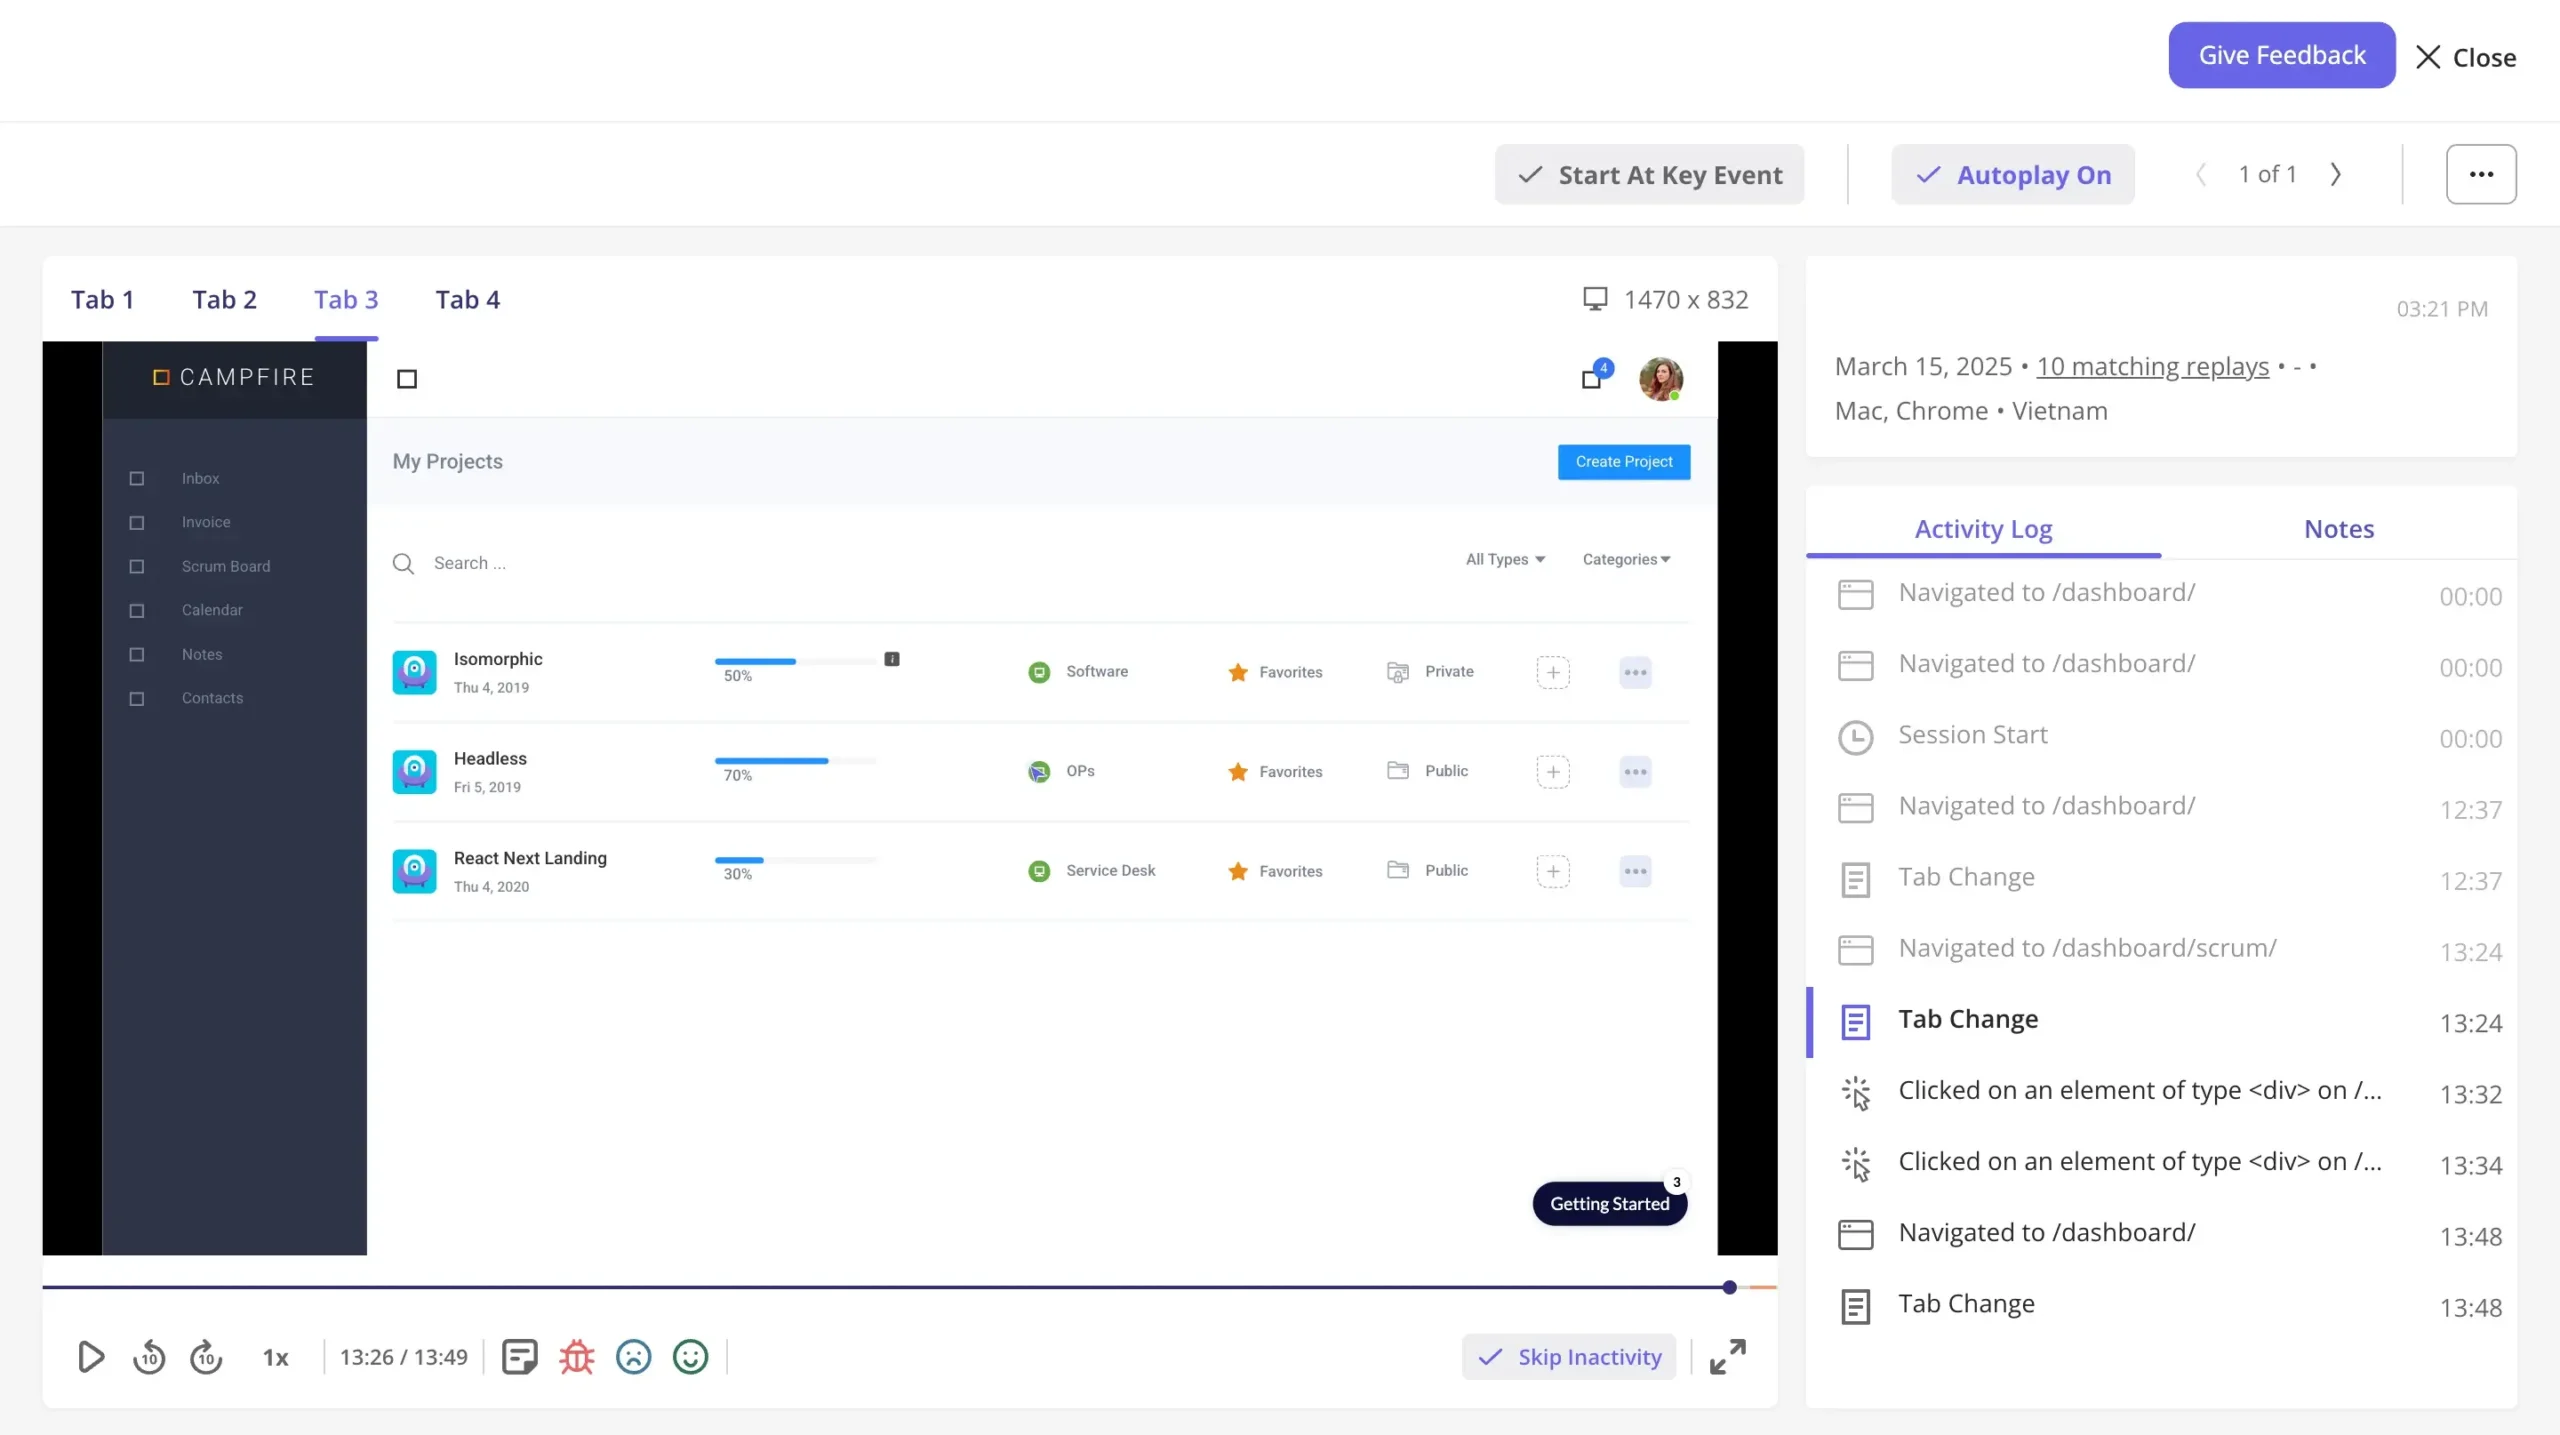
- Session replays: Where you can watch users’ sessions and spot the specific moment user frustration happens.
For instance, when a survey response mentions that “something feels too hard,” I can go directly into relevant session replays (based on that respondent’s cohort) and watch where they get stuck.
6. Discuss and execute the next steps with your team
The whole point of feedback analysis is to arrive at insights that direct your roadmap and close the feedback loop. Otherwise, you end up with what Teresa calls “discovery theatre,” where you conduct interviews and take notes, yet the roadmap follows exactly as it was going to anyway.
That’s why it’s important to talk to the right team from the start. For example, when survey data identifies a friction point requiring a UX change, you can route the finding directly to the UX team with specific segment data, supporting session replay as evidence, and a recommendation.
Lastly, to truly close the loop, you must let people who had provided feedback know that you acted on it. For instance, I can trigger a message to a specific respondent cohort, such as “You told us the trigger condition editor was confusing. We’ve rebuilt it.” Messages like this tell users their feedback mattered, close the loop, and keep the trust that keeps response rates healthy.
Build a feedback process your roadmap actually uses
Teams that are better at feedback analysis turn customer comments into validated hypotheses that lead to product releases. When feedback, behavioral, and analytics data live in separate tools, analysis takes too long, and slow analysis never reaches the roadmap at all.
Userpilot triggers in-app surveys, tracks user activity within the product, analyzes responses with AI, and sends automated follow-ups to close the loop (all without switching tools or touching code). Book a demo with our team to see what feedback analysis looks like when you can instantly access your most valuable data in one place.
About the author