How to Measure Martech Success + Success Metrics Benchmark 2024


What are the metrics to measure martech success?
- Martech success can be defined as the ability of the product to satisfy customer needs and drive business goals.
- One way to measure your Martech product success is by using benchmarks to compare its performance to similar products.
- Here are metrics you can use, along with their averages for Martech companies from Userpilot’s SaaS Product Success Metrics Report 2024:
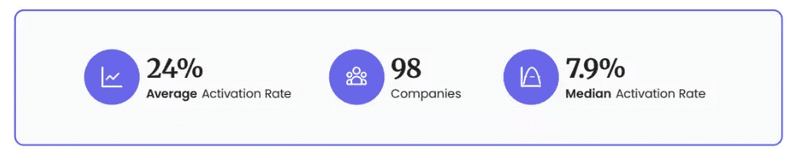
- Average customer activation rate: 24%.
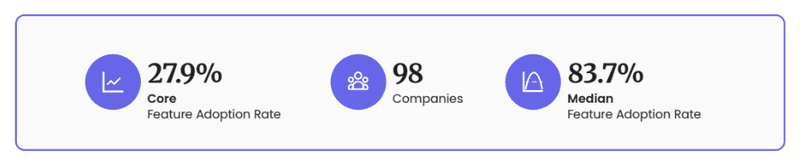
- Core feature adoption rate: 27.9%
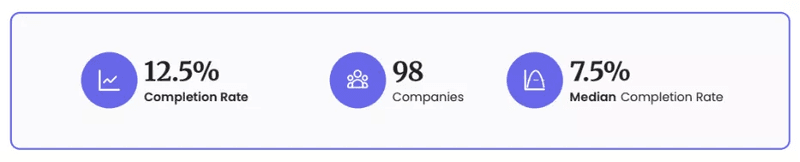
- Onboarding checklist completion rate: 12.5%
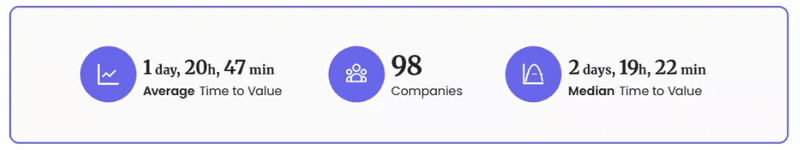
- Time-to-value (TTV): 1 day, 20 hours, and 47 minutes
- Net Promoter Score (NPS): 41
- Month 1 retention rate: 44.7%
- If you’d like to learn how to track these metrics (and optimize them) with Userpilot, book the demo!
Understanding Martech success
Martech SaaS product success is the effectiveness and efficiency with which the tool helps customers achieve their objectives. And how well it drives your own business goals.
Key components of Martech product success are:
- Product adoption and user engagement.
- Customer satisfaction.
- Product performance and reliability.
- Ongoing innovation.
- Market penetration and brand visibility.
- Profitability.
Key metrics for measuring success for Martech tools
What metrics should you choose to measure the success of your Martech product? We’ve picked 6 which we believe to be particularly useful:
- Product activation rate.
- Core feature adoption rate.
- Onboarding checklist completion rate.
- Time to Value.
- NPS.
- Month 1 retention rate.
These are the metrics we used to analyze the performance of 547 SaaS companies from 7+ industries in our SaaS Product Metrics Benchmark Report 2024.
As Martech was one of the verticals, let’s have a look at how Martech companies did on average. So that you can compare the performance of your product.

Product activation rate
Product activation rate is the percentage of new users who reach the activation milestone.
To calculate it, divide the number of activated users by the total number of new sign-ups at the beginning of a given period, say a month.
So if you have 2000 new users in July and 700 of them reached the activation point, the activation rate is 35%.
What is the activation point?
That’s the moment when the users realize product value and start using it to achieve their goals.
What is the average activation rate for Martech tools?
Our study has found that the average Martech product activation rate is 24%. That’s quite a bit under the overall average rate of 37.5%.
Core feature adoption rate
Core feature adoption rate describes the percentage of users who regularly use the product’s key features to solve problems.
How do you define adoption?
Depends on the product. For a social media management platform, this may involve scheduling a couple of dozen posts or running several reports.
To calculate the rate, divide the number of users who have adopted the features by the total number of users and multiply by 100.
So if you have 10,000 users and 5,653 of them adopt the core features, the adoption rate is 56.53%.
What is the average core feature adoption rate for Martech tools?
Martech companies from our study had, on average, the 2nd highest core feature adoption rate: 27.9%.
This was above the average of 24.5% and way above the lowest rate of Edtech companies (9%).
Onboarding checklist completion rate
Checklists are in-app patterns that consist of tasks that users need to complete to activate the product.
Just like to-do lists or shopping lists, they’re powerful behavior drivers because people find it difficult to resist the urge to tick off the items.
To calculate the onboarding checklist completion rate, divide the number of users who completed it by the number of those who started it. So if 10 users start but only 2 complete it, the completion rate is 20%.
Why should you be interested in the metric? It gives you an idea of how effective your onboarding is and how well you understand your customers. And your product.
What is the average onboarding checklist completion rate for Martech tools?
The data from the 34 Martech companies we studied for our report showed the completion rate was 12.5%.
Time to Value
Time to value (TTV) is the time needed to reach the activation point. Or, in other words, experience the product value.
The lower the TTV, the lower the chance that the user drops off. It also indicates how easy to use and intuitive the product is and how efficient its onboarding.
To determine the TTV, first define the activation milestone and then measure how long users need to reach it.
What is the average time-to-value for Martech tools?
Martech tools have some of the longer times to value when compared to other verticals in our study. The average TTV for Martech was 1 day, 20 hours and 47 minutes.
NPS
NPS, or Net Promoter Score, is a metric used to measure customer satisfaction and loyalty. Higher NPS is also linked to lower customer acquisition cost.
It’s based on a survey in which you ask the customer how likely they are to recommend the product to their friends or family on a scale of 1 to 10.
Based on the responses, you divide them into 3 groups:
- Detractors (1-6)
- Passives (7-8)
- Promoters (9-10)
What is the average NPS for martech tools?
The average NPS score for Martech products was 41. Which was the 2nd highest score in our report and a touch above the overall average of 35.7%.

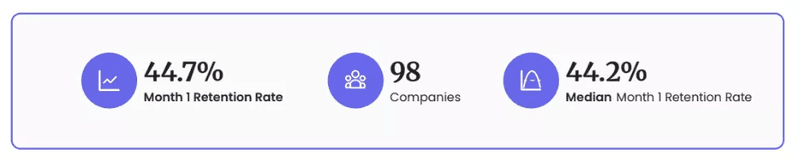
Month 1 retention rate
Month 1 retention rate is the percentage of new sign-ups who keep using the product after a month.
The metrics is relevant because it shows that your users find your product valuable early on. It’s also associated with high long-term retention and customer lifetime value.
How to calculate it?
Divide the number of users who keep returning to use the product after a month by the total number of users who joined at the beginning of the period. Cohort or retention analysis can help with this.
What is the average month 1 retention rate for Martech tools?
The average month 1 retention rate of 44.7% puts Martech companies close to the overall average of 46.9%.
How to measure Martech performance
When measuring the performance of your Martech product, follow this process:
- Set specific business objectives. For example, “improve MRR by 24% by the end of the year”.
- Identify relevant key performance indicators. Like those discussed above.
- Choose the right tools to measure success. So that you can easily analyze the data.
- Establish data collection methods. For example, event tracking to collect quantitative data and in-app surveys for qualitative insights.
- Analyze the collected data and gain insights. For example, look at how it stacks against other products in your industry using benchmarks.
- Report and optimize. Use a dashboard to visualize all data in one place and work out strategies to improve the lagging metrics. Like enhanced user onboarding.
Conclusion
Martech is a very saturated market. With so many products competing for customers’ attention, it’s essential to lead your prospective customers to value as quickly as possible. Otherwise, there’s a risk they won’t give your product the chance it deserves and move on to another tool.
That’s why tracking your product performance is vital for its success.
If you’d like to see how Userpilot can help you with this, book the demo!
About the author


![What are Release Notes? Definition, Best Practices & Examples [+ Release Note Template] cover](https://blog-static.userpilot.com/blog/wp-content/uploads/2026/02/what-are-release-notes-definition-best-practices-examples-release-note-template_1b727da8d60969c39acdb09f617eb616_2000-1024x670.png)