Stonly for User Behavior Analysis: Features, Pricing, and Review
Looking for an effective user behavior analysis tool and wondering if Stonly is the best option for your SaaS company?
With numerous of Stonly alternatives, it can be challenging to make a final decision.
In this article, we’ll delve into precisely that – helping you determine whether Stonly is the ideal choice for your user behavior analysis needs. We’ll explore its features, pricing, and offer a comprehensive review to aid in your decision-making process.
Let’s get started!
TL;DR
- Stonly is a good choice for User behavior analysis and it comes with features such as event tracking, feature tags, user journey mapping, and user segmentation analysis.
- There are a few clear scenarios where Stonly wouldn’t be the best solution to use. If you’re in any of these scenarios then considering an alternative platform would probably be best:
- Feature Mismatch: If user onboarding or product adoption are your main goals, then Stonly’s feature set may not align with that use case. Its ability to build in-app guides or survey customers is limited by the platform’s coding requirements and pricing structure.
- Budgetary Constraints: Companies who are operating on a tight budget should steer clear of Stonly due to the extra charges that occur if your guides get more than 4,000 views per month. If guide views reach 30,000 then you’ll be paying an additional $500 on your plan each month.
- Existing Knowledge Bases: Building knowledge bases is the primary use case for Stonly’s feature set. If you already have an existing knowledge base, then you’d be better off with an alternative like Userflow that integrates with Freshdesk, HubSpot, and Zendesk knowledge bases.
- If you’re looking for a better option for User behavior analysis, Userpilot exceeds both functionality and value for money compared to Stonly. Ready to see Userpilot in action? Schedule a demo today to explore its powerful User behavior analysis capabilities firsthand.
![]()
Looking for a Better Alternative for User Behavior Analysis? Try Userpilot
What is Stonly?
Stonly positions itself as a cheaper alternative to some of the pricier product adoption solutions on the market. In reality, it’s more of a customer service tool that can be used to build knowledge bases rather than an actual onboarding or adoption platform.
As a result, the tour builder on Stonly feels more like an add-on to its knowledge base functionality rather than a product of its own.
This also means that its in-app engagement features will be rather limited (especially in the no-code regard) compared to alternatives like Userpilot or Appcues.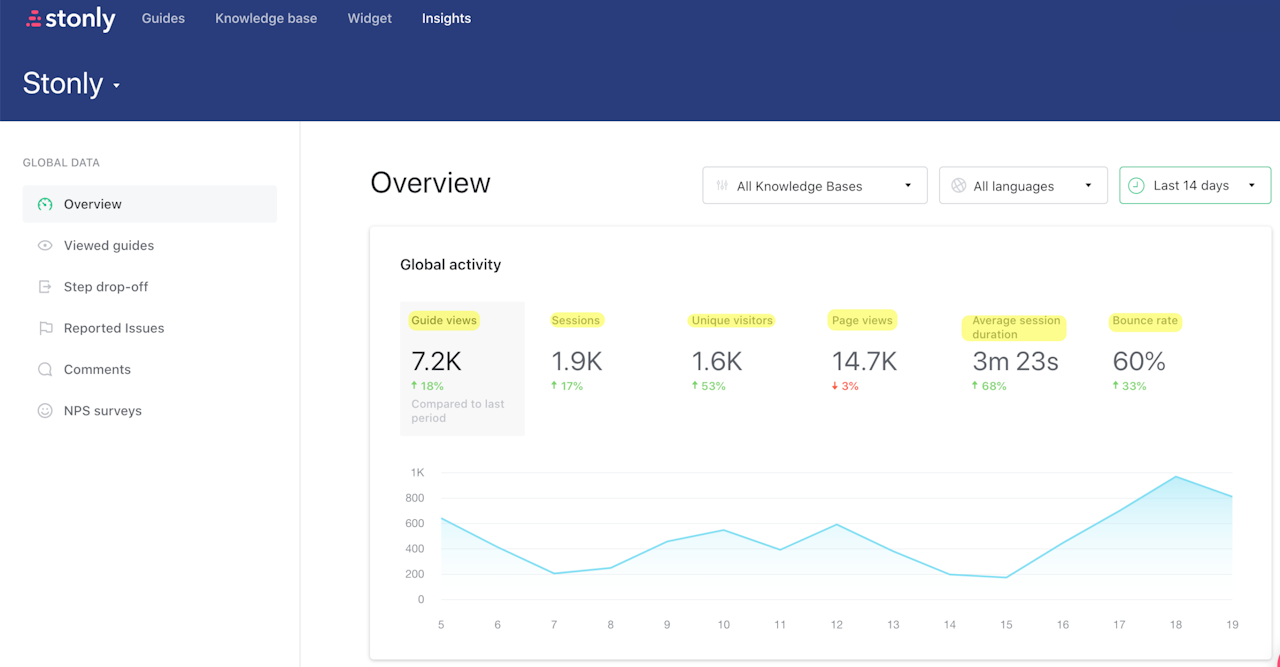
Must have features of user behavior analysis tools
User behavior analytics tools are critical for improving product performance by providing an overview of user interactions and influencing strategic decisions. Here’s what to consider before opting for one:
- Event tracking – so you can track user behavior and activity.
- Goal-based tracking for keeping track of how users make progress toward a goal and identifying bottlenecks.
- User journey tracking and mapping – so you can monitor user engagement across different touch points of the customer journey.
- Behavioral heat maps for visualizing user interactions with heat maps that highlight popular and underutilized UI areas (i.e. feature heat maps).
- Segmentation based on in-app behavior, usage patterns, feedback, and personas — to create personalized, well-timed messages.
- Features to create automated in-app experiences, such as interactive in-app messages and announcements based on specific user actions that offer timely guidance.
Stonly features for user behavior analysis
Behavioral analytics are essential for understanding how users interact with your product and discovering beneficial patterns to capitalize on.
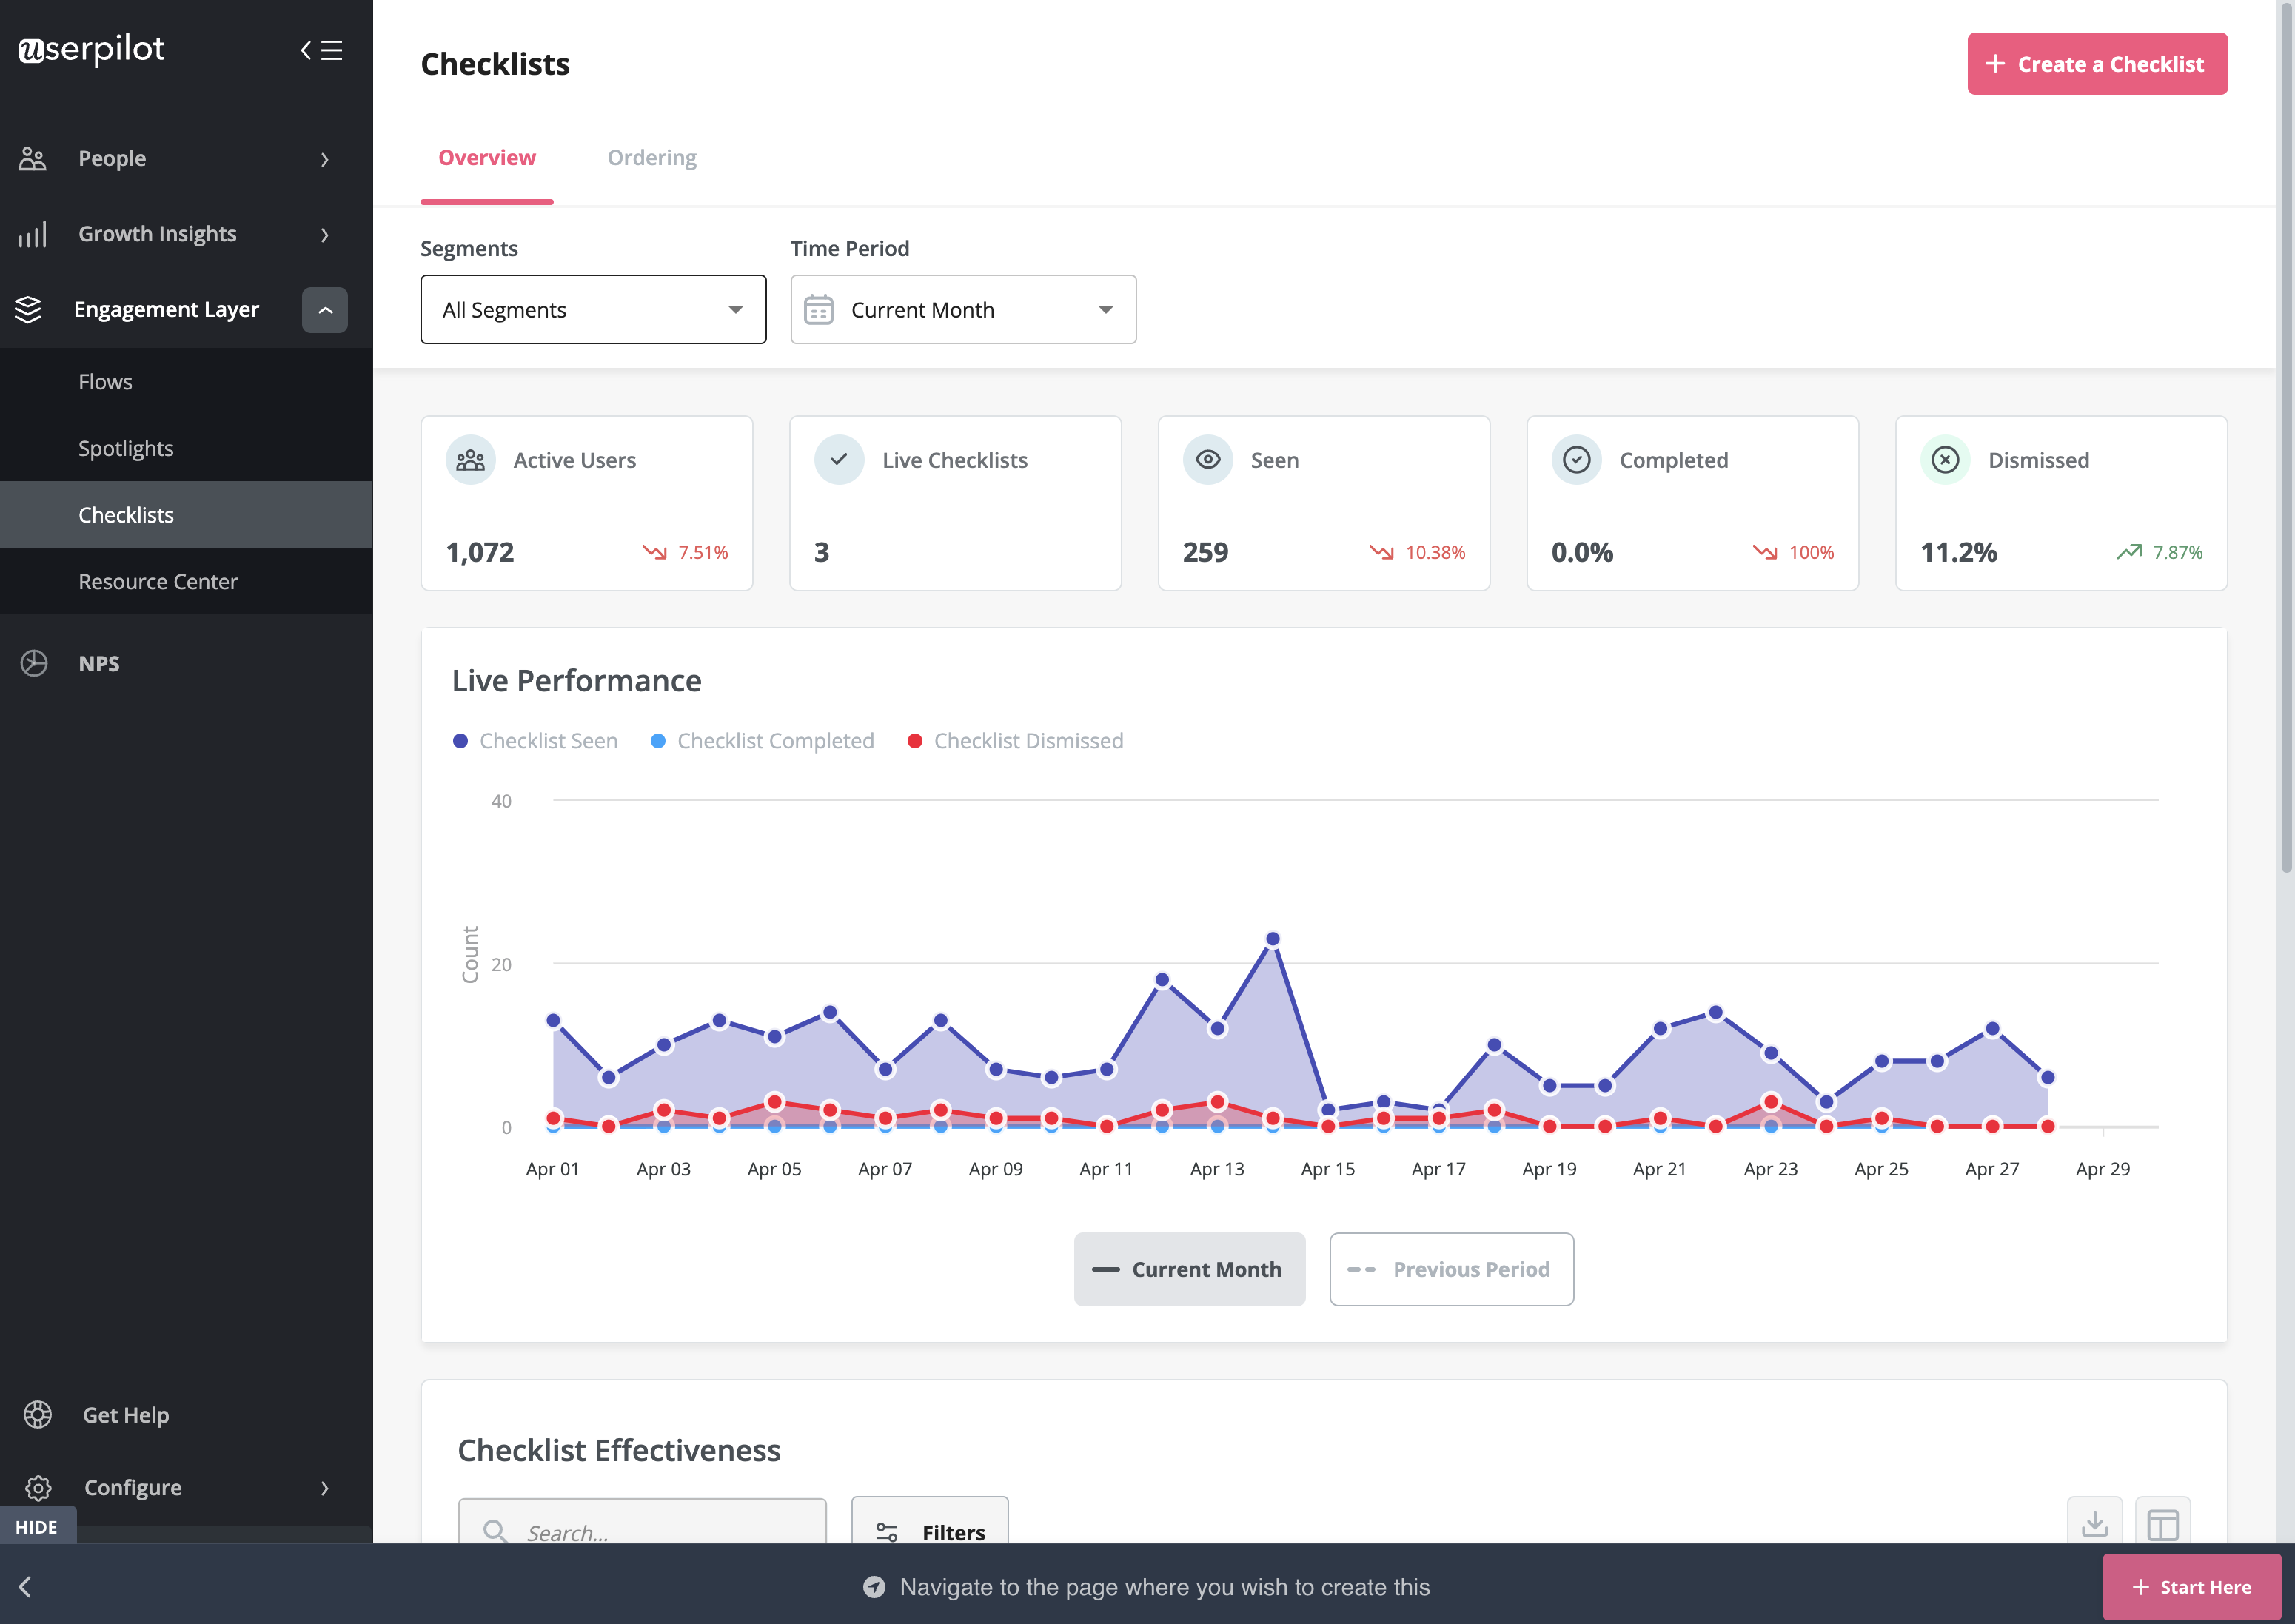
Stonly has a global analytics dashboard, granular insights for checklist behavior, and survey-related event-tracking capabilities.
However, you can’t use Stonly for tracking user engagement behavior with features of your product. If you need behavioral analytics functionality, you should try a tool like Userpilot that offers full product analytics and user engagement functionality.
Here are the Stonly features you can use to understand how your in-app guides are performing.
- Insights Dashboard: Stonly’s Insights dashboard is the high-level breakdown of global analytics. This can help you gauge how many users are interacting with your guides, how long their average session lasts, and what the average bounce rate is across your user base.
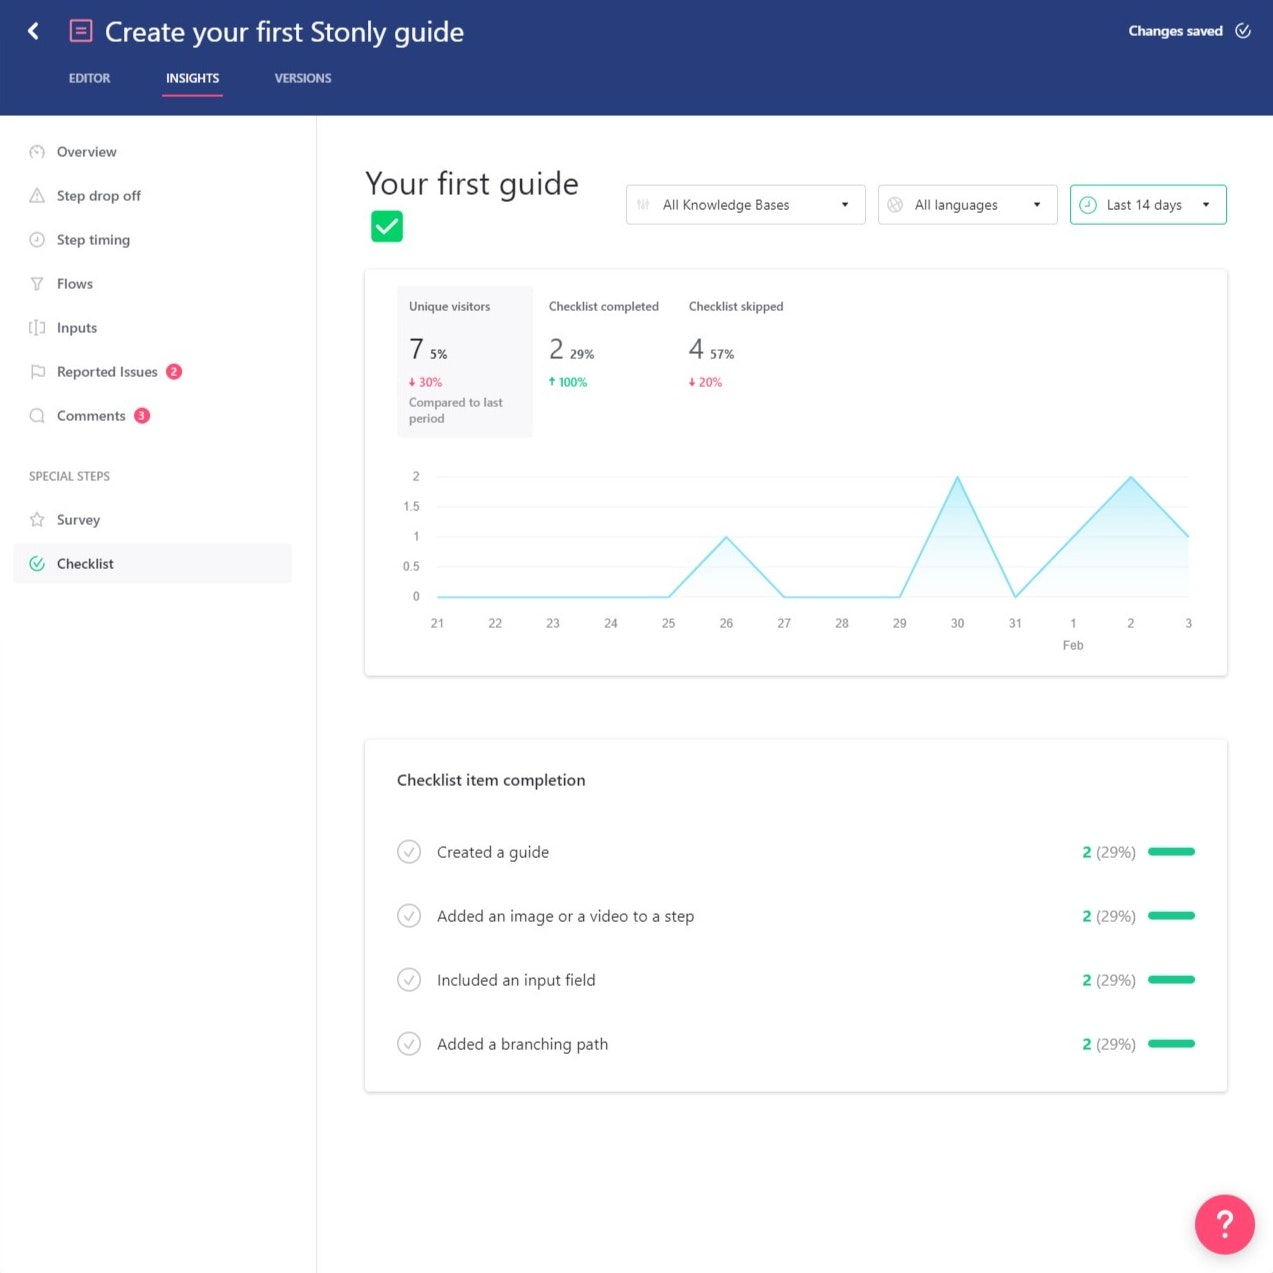
- Checklist Analytics: Stonly lets you add checklists within your in-app guides as a special step. You can then look at the Insights tab of the guide to see how many users complete a particular checklist task, its overall completion rate, and the number of times it’s been skipped entirely.
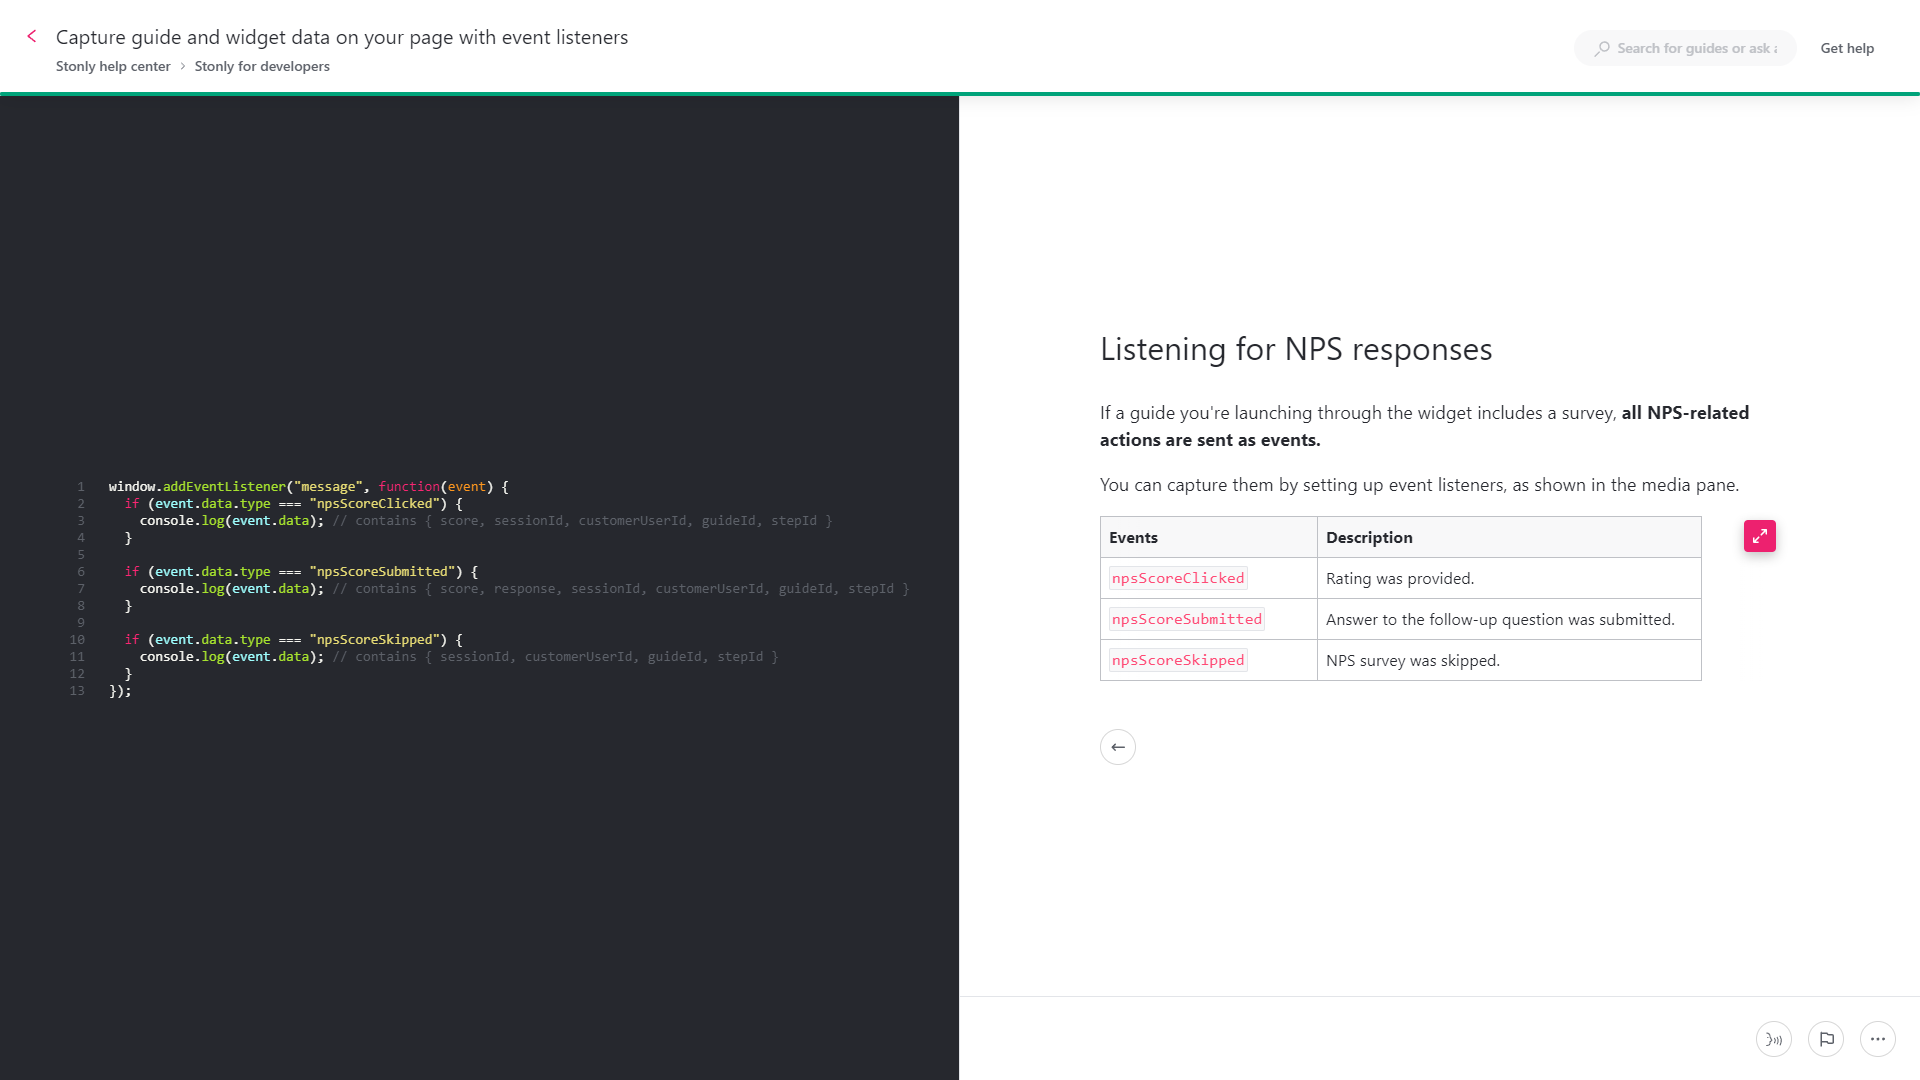
- Survey Events: When adding NPS surveys to your guides, you’ll be able to track actions like ratings being submitted, follow-up questions being answered, or the survey being skipped. Do note that you’ll need to use code to listen for these survey-related events.
Stonly’s event tracking
Tracking event data is imperative to understanding user behavior and monitoring for desirable actions. While Stonly does have event-tracking capabilities (both natively and through third-party integrations), it is held back by the need for coding.
Here’s how you can use Stonly as an event-tracking tool:
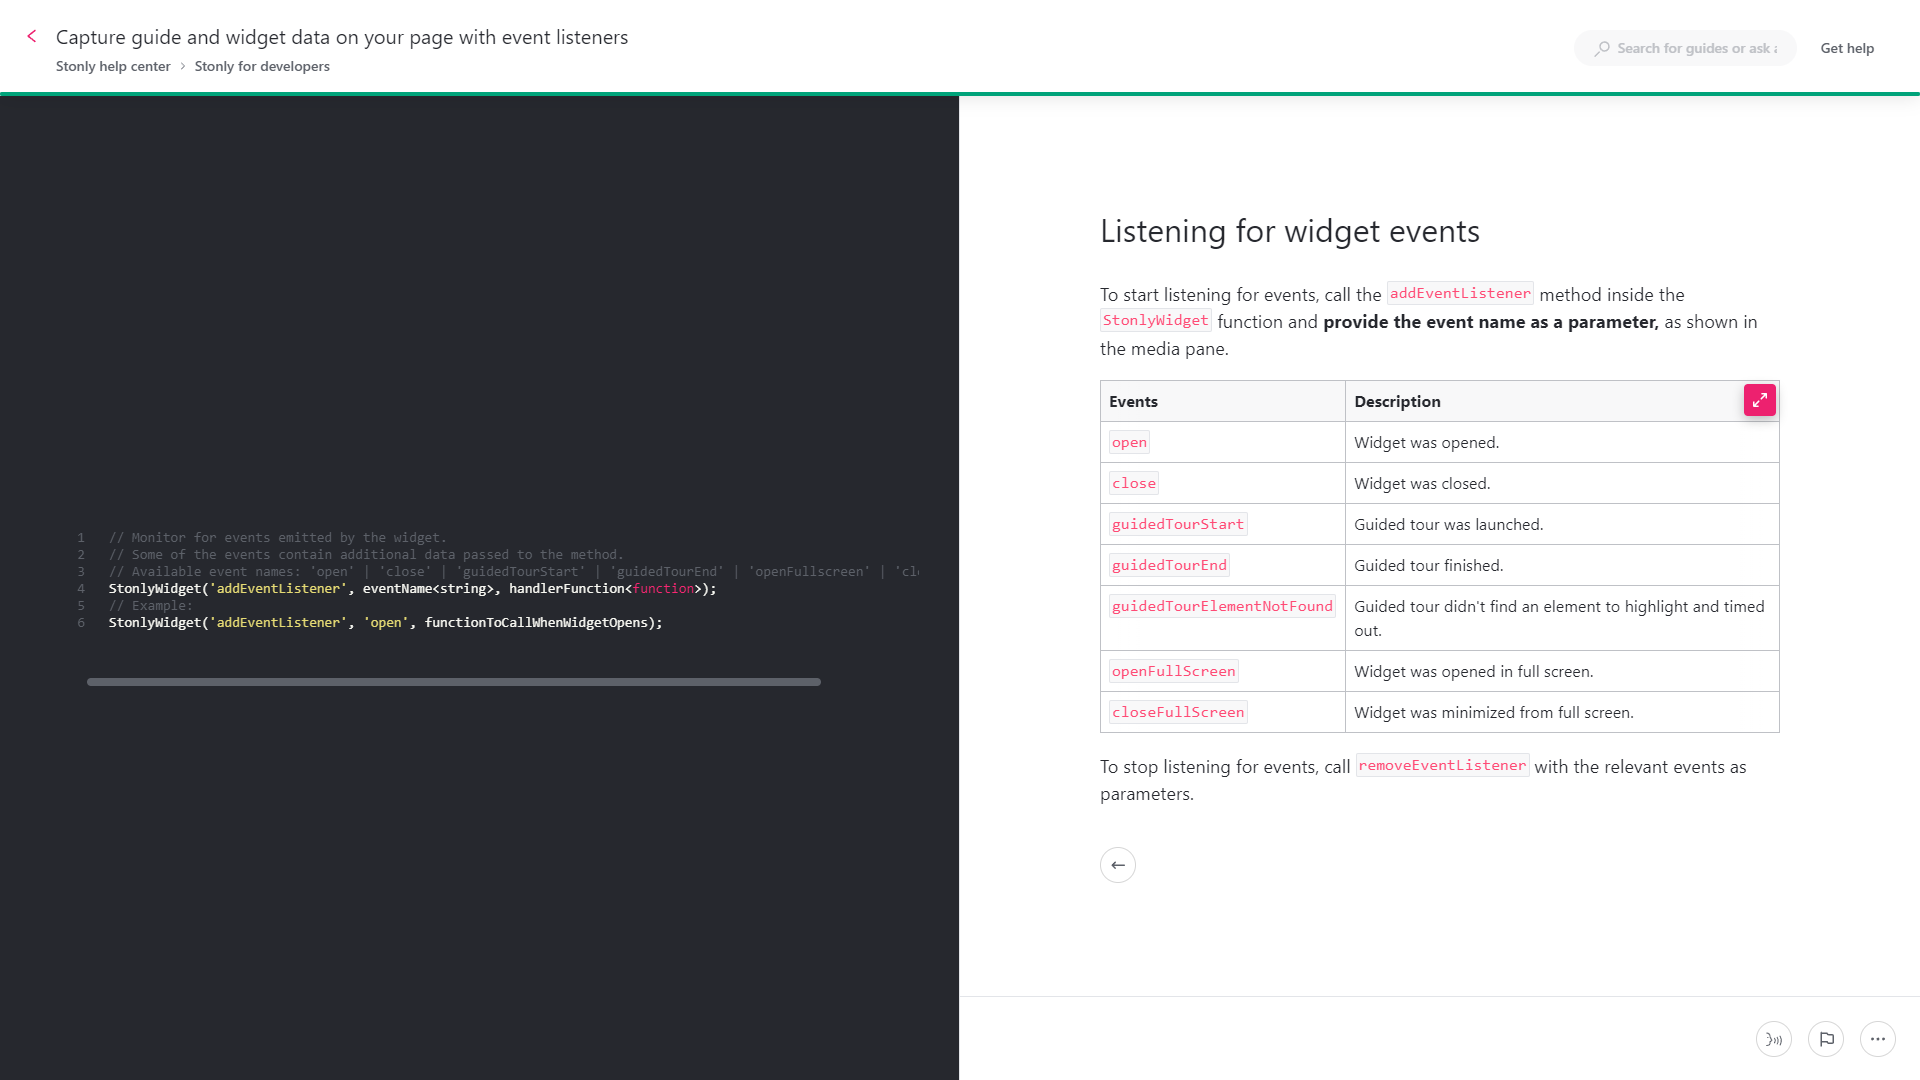
- Widget Events: Stonly lets you track events like a widget being opened/closed, guides being launched/finished, unfound element incidents, and widgets being maximized/minimized to or from full-screen mode. However, you will need to use code to listen for (and track) these events.
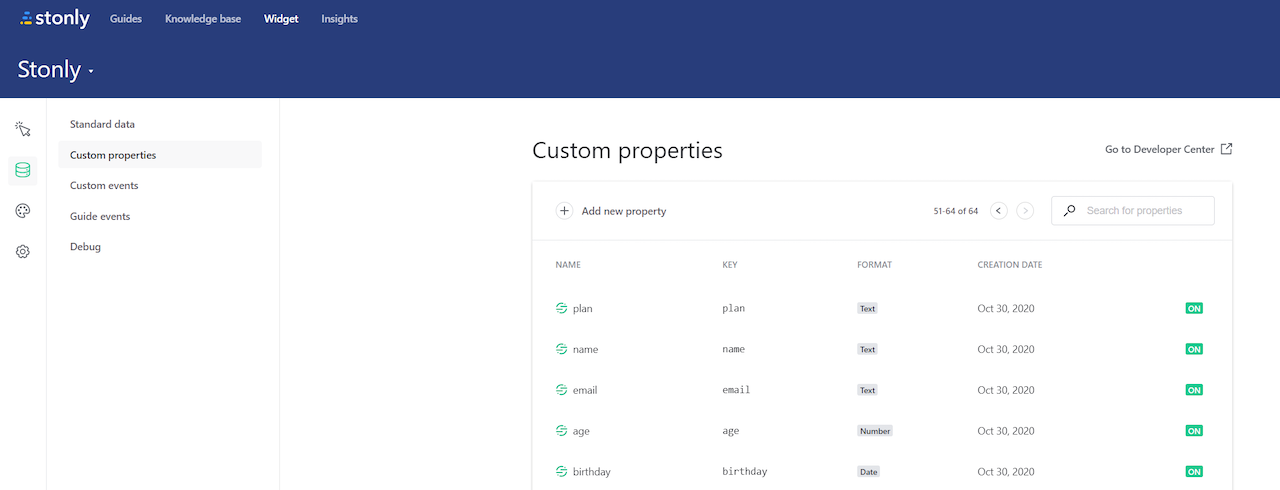
- Custom Properties: In addition to the standard data types that Stonly can monitor, it’s also possible to add custom properties and events. These could include demographic data or which plan a user is on so you’re able to monitor for changes (e.g. upgrades to a higher subscription).
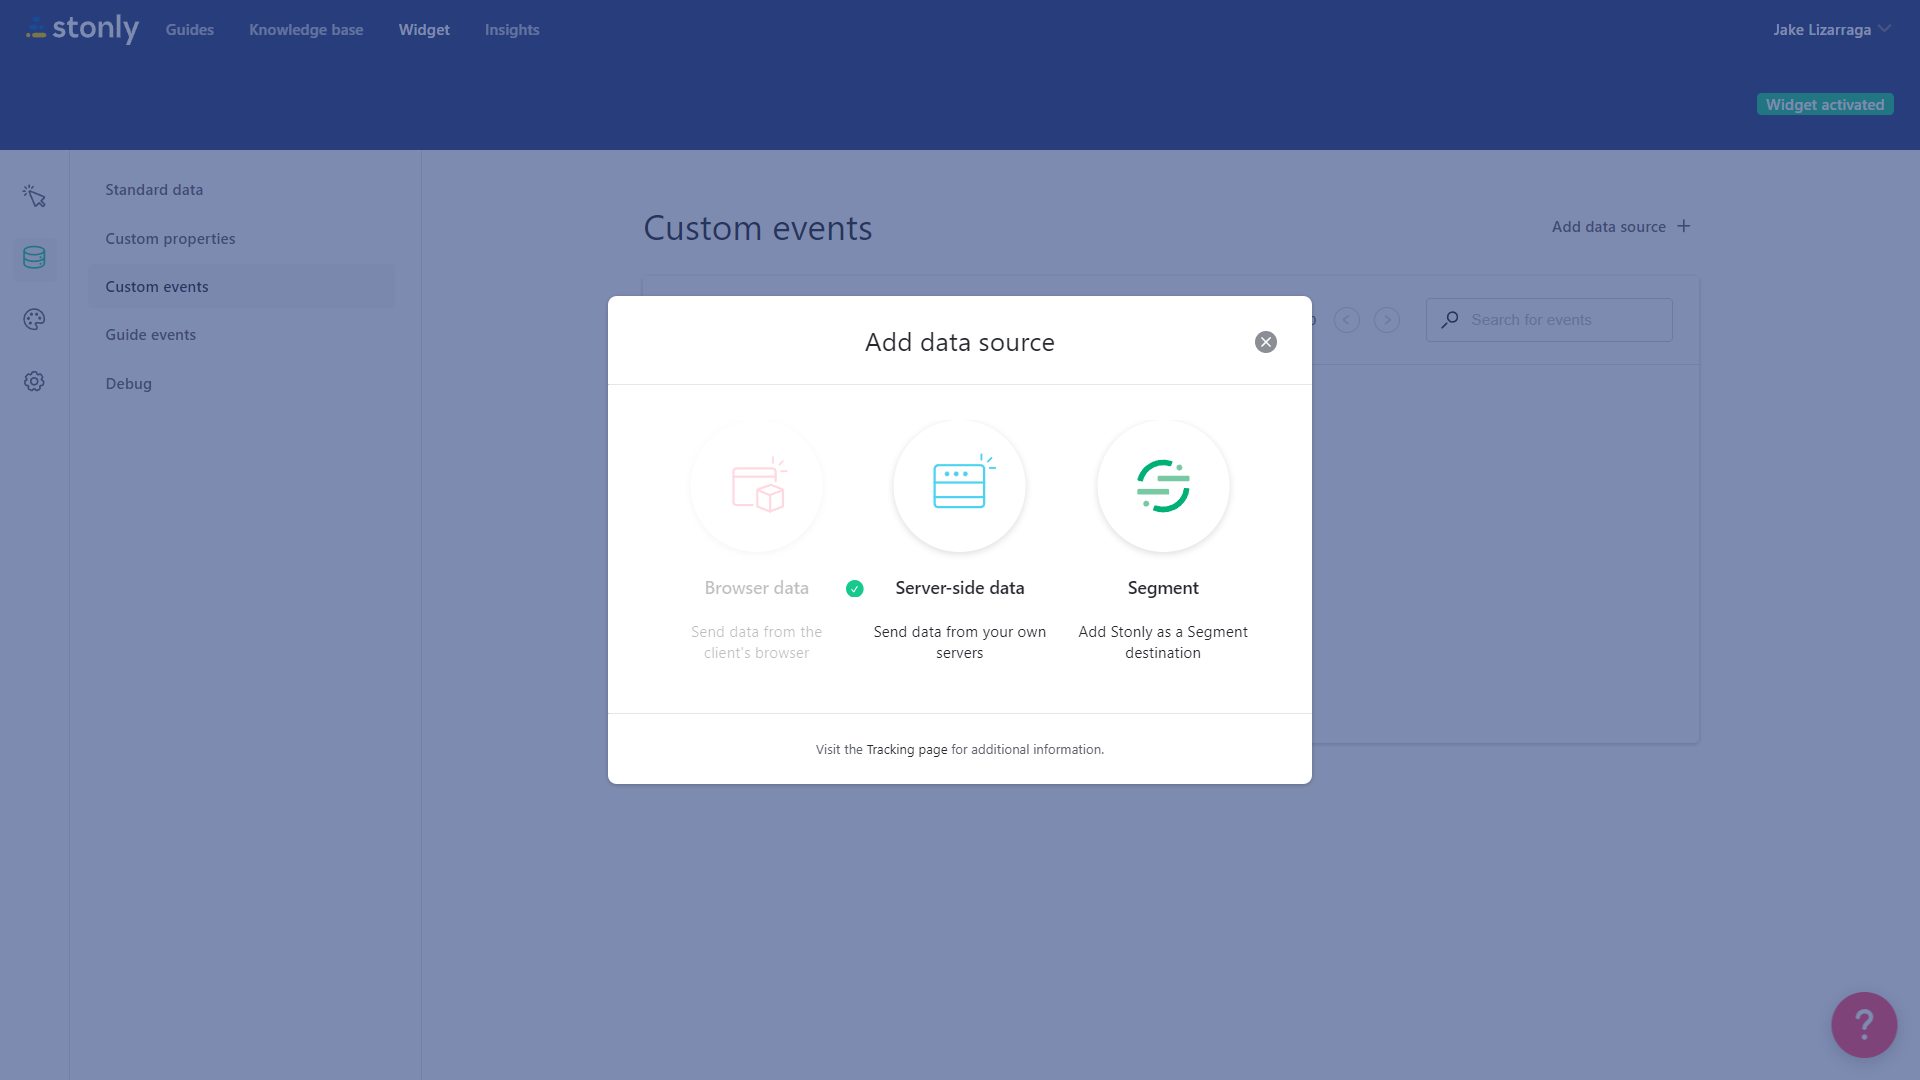
- Third-Party Data: Stonly lets you add a data source using the Segment integration. You can then use the data Segment streams to trigger in-app guides within Stonly. Boolean, numbers, strings, and dates are all supported data types when integrating Segment with Stonly.
Note: You will need some coding knowledge when setting up Stonly’s Segment integration to ensure that event data is properly collected and streamed to/from each tool.
- NPS Events: Stonly also lets you track events like NPS surveys being skipped, ratings being submitted, or follow-up questions being answered through the use of code. Note that you can only listen for actions on NPS surveys, not any custom surveys built within Stonly guides.
Stonly’s feature tags
Stonly has no native feature tagging capabilities.
However, you could attach UI triggers such as icons to specific elements, set them to trigger a guide, and then see how many unique views that guide gets to guesstimate feature usage.![]()
Note: While this workaround is technically possible, it takes much longer to set up and can only provide vague measures of which feature usage. UI triggers aren’t even available on Stonly’s Basic plan so we’d recommend alternative solutions like Userpilot or Pendo that support feature tagging.
Stonly’s user journey mapping
Stonly’s user journey mapping capabilities are limited by its lack of product analytics but it does have flow reports that track the user journey.
Here’s how you can use Stonly to analyze the customer journey:
- Flows Dashboard: Stonly’s Flows reports help you track the percentage of users that make it from one step to the next so you can identify any roadblocks. You can also zoom in/out on the report or sort data by content type, language, and date range to extract actionable insights.
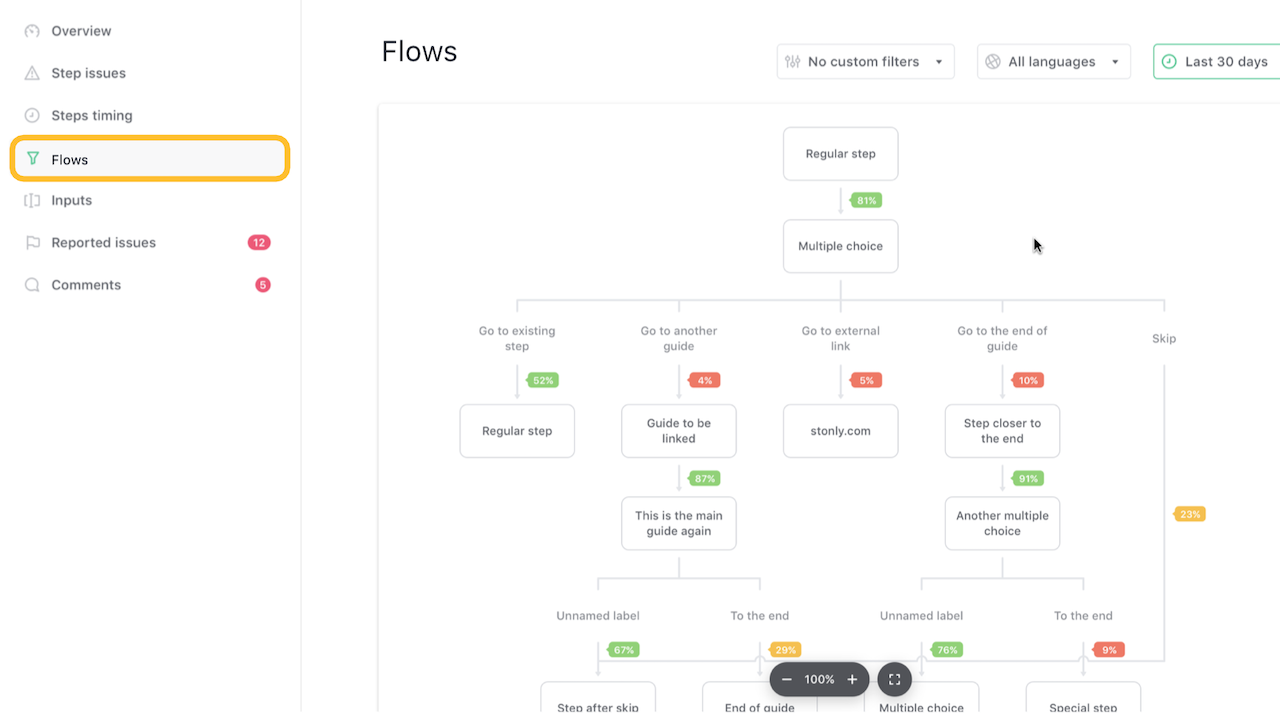
- Color Coding: Stonly’s flow reports are color-coded to help you measure drop-offs at a glance. If 70% or more of sessions move to the next step it’s labeled green, 69% to 25% is labeled yellow, and 24% or lower is marked in red. This helps you quickly spot funnel leaks and drop-off areas.
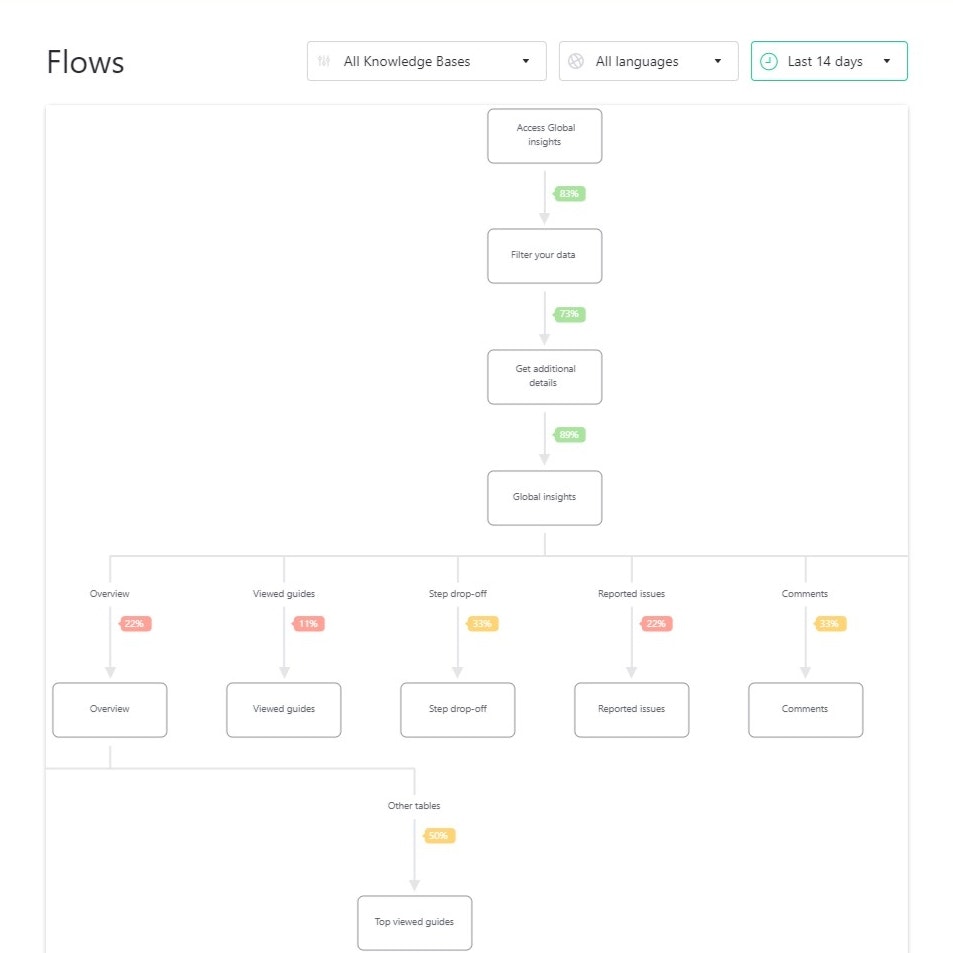
- Data Limitations: Because Stonly’s analytics are limited to the guides, checklists, surveys, and knowledge base modules you create within the platform, it can’t use product usage data to map the user journey. Flow data is only refreshed once every 15 minutes which further limits it.
Stonly’s user segmentation analysis
User segmentation is crucial for conducting customer analysis and extracting insights from the data you collect. Stonly gives you a few options for segmentation analysis through standard user attributes, the ability to add custom properties and a unified analytics dashboard.
However, if you are looking for advanced user segmentation capabilities based on how users actually use the product, the features they engage with, or survey responses, Stonly is not the tool for this.
- User Attributes: Stonly tracks seven standard attribute types which are country, browser language, browser version, device type, operating system, and when the first was first/last seen. This helps you segment data based on the language, device, or activity period of users but doesn’t give you options for segmenting based on user engagement.

- Custom Properties: Stonly also lets you create new properties. Once you name the property, a key will be generated which is the value you can use to send data to Stonly. For example, you could create a property that tracks which subscription tier a user is on to segment accordingly.
Note: setting up and tracking custom properties will require some coding knowledge to pull off.

- Insights Dashboard: Stonly’s Insights dashboard shows you global analytics for metrics like pageviews, guide views, sessions, visitors, session duration, and bounce rate. You filter by language or date range to compare data for different cohorts or geographic segments.

What are the pros and cons of Stonly?
Stonly’s pros
While Stonly isn’t as capable as full-on digital adoption solutions like Userpilot, Pendo, or Appcues, it does have a few benefits:
- Self-Service Support: Because building knowledge bases is the primary use case for Stonly (and arguably its core product), it has advanced self-service support features that could outperform other adoption solutions, such as abundant live chat integrations.
- Analytics Dashboard: Stonly has a unified analytics dashboard that can show you global insights across all your guides. This makes it easier to track content engagement and monitor your key performance indicators (KPIs).
- Guide Builder: While other Stonly features such as event tracking, user targeting, data streaming, and styling require coding, the guide builder uses an intuitively designed visual interface to let you add, edit, or delete steps.
Stonly’s cons
Unfortunately, there are quite a few drawbacks to using Stonly that stem from its lopsided features, no-code capabilities (or lack thereof), and view-based pricing model:
- Feature Set: Seeing as Stonly is a knowledge base builder first and onboarding/adoption solution second, it has quite a few features that are missing, too basic, or difficult to use. If user onboarding and product adoption are your main use cases, consider alternatives.
- Coding Requirements: Unlike most of its competitors, Stonly doesn’t advertise itself as a no-code onboarding/adoption platform. This means you’ll need coding knowledge to track events, target users, stream data, and style your content.
- Pay-as-You-Go Pricing: Stonly’s pricing charges additional fees based on the number of views that guides get. Customers who don’t exceed 4,000 guide views per month won’t be charged extra, but those who do will pay an additional $250 to $500 monthly depending on volume.
What do users say about Stonly?
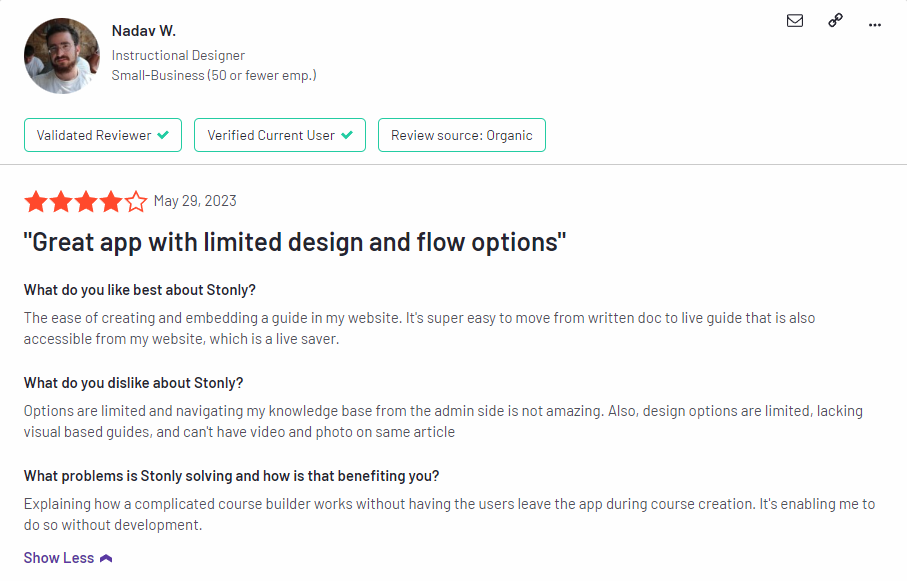
Despite Stonly’s limitations, there are some aspects of the platform that garner praise from users, such as the ease of publishing:
The ease of creating and embedding a guide in my website. It’s super easy to move from written doc to live guide that is also accessible from my website, which is a live saver.
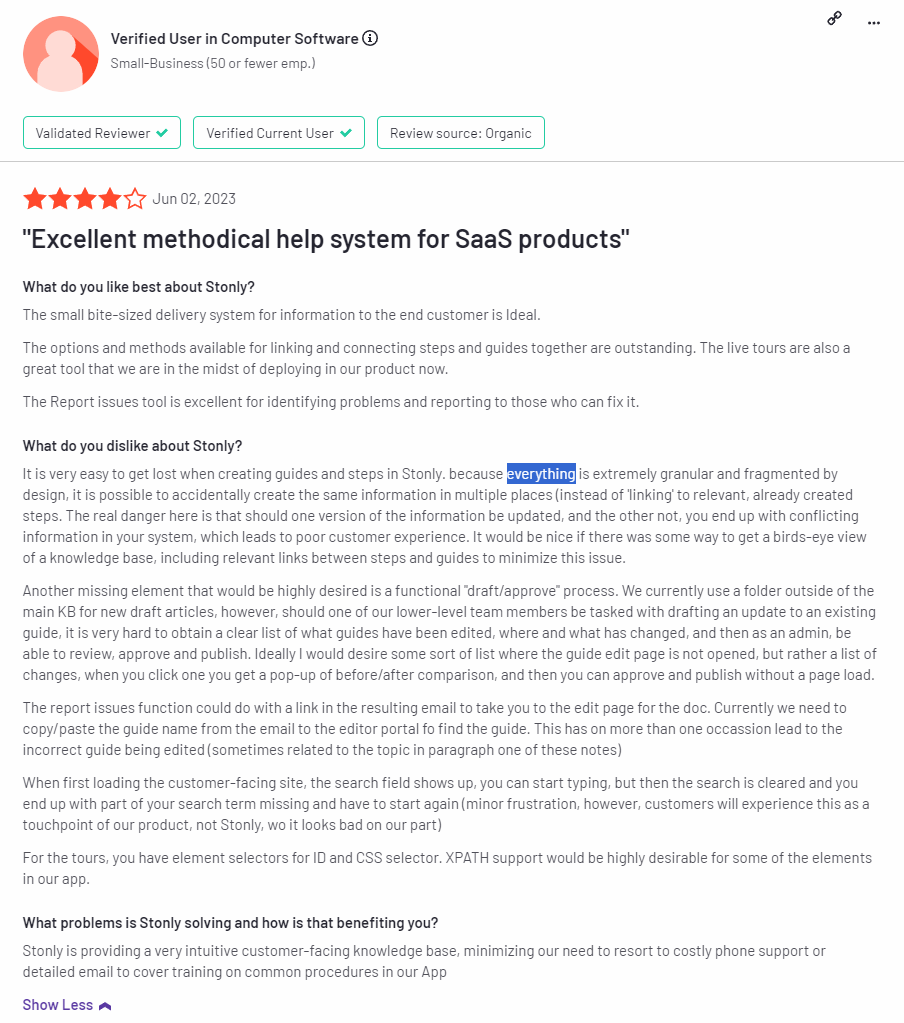
 Of course, there are also plenty of criticisms stemming from Stonly being positioned as an interactive guide solution when it’s more of a knowledge base builder:
“It is very easy to get lost when creating guides and steps in Stonly. because everything is extremely granular and fragmented by design, it is possible to accidentally create the same information in multiple places (instead of ‘linking’ to relevant, already created steps. The real danger here is that should one version of the information be updated, and the other not, you end up with conflicting information in your system, which leads to poor customer experience. It would be nice if there was some way to get a birds-eye view of a knowledge base, including relevant links between steps and guides to minimize this issue.
Another missing element that would be highly desired is a functional “draft/approve” process. We currently use a folder outside of the main KB for new draft articles, however, should one of our lower-level team members be tasked with drafting an update to an existing guide, it is very hard to obtain a clear list of what guides have been edited, where and what has changed, and then as an admin, be able to review, approve and publish. Ideally I would desire some sort of list where the guide edit page is not opened, but rather a list of changes, when you click one you get a pop-up of before/after comparison, and then you can approve and publish without a page load.
The report issues function could do with a link in the resulting email to take you to the edit page for the doc. Currently we need to copy/paste the guide name from the email to the editor portal to find the guide. This has on more than one occasion led to the incorrect guide being edited (sometimes related to the topic in paragraph one of these notes)
When first loading the customer-facing site, the search field shows up, you can start typing, but then the search is cleared and you end up with part of your search term missing and have to start again (minor frustration, however, customers will experience this as a touchpoint of our product, not Stonly, wo it looks bad on our part)
For the tours, you have element selectors for ID and CSS selector. XPATH support would be highly desirable for some of the elements in our app.”
Stonly’s pricing
Stonly offers two paid plans. In addition to the base subscription cost, customers will also be charged additional fees if their guides get more than 4,000 views per month.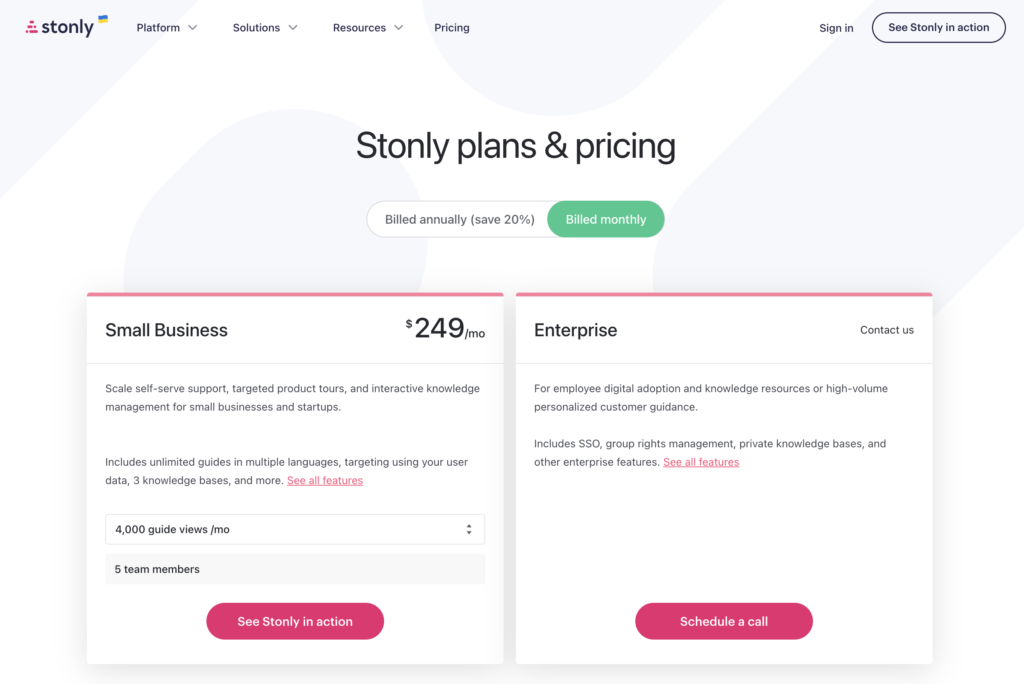
Here’s an overview of Stonly’s two subscription tiers:
- Small Business: Stonly’s Business tier is the entry-level paid plan that starts at $249/month but offers a 20% discount if you bill annually. It includes five team seats, unlimited guides, multi-language support, guide variables, and integrations. You’ll be billed extra if you exceed 4,000 guide views.
- Enterprise: The Enterprise version of Stonly uses quote-based pricing and includes all the features of the Business tier. It has additional features like surveys, automatic guide translation, advanced permissions, additional integrations, priority support, and single sign-on (SSO).
3 Reasons why you might need a Stonly alternative
There are a few clear scenarios where Stonly wouldn’t be the best solution to use. If you’re in any of these scenarios then considering an alternative platform would probably be best:
- Feature Mismatch: If user onboarding or product adoption are your main goals, then Stonly’s feature set may not align with that use case. Its ability to build in-app guides or survey customers is limited by the platform’s coding requirements and pricing structure.
- Budgetary Constraints: Companies who are operating on a tight budget should steer clear of Stonly due to the extra charges that occur if your guides get more than 4,000 views per month. If guide views reach 30,000 then you’ll be paying an additional $500 on your plan each month.
- Existing Knowledge Bases: Building knowledge bases is the primary use case for Stonly’s feature set. If you already have an existing knowledge base, then you’d be better off with an alternative like Userflow that integrates with Freshdesk, HubSpot, and Zendesk knowledge bases.
Userpilot – A better alternative for user behavior analysis
 Behavioral analytics make it possible to monitor user activity, group data into cohorts, and extract relevant metrics/insights. Userpilot lets you tag features to see how users interact with them, compare goals by cohort, and create trend reports that track behavioral patterns over time.
Here are some Userpilot features you can use for user behavior tracking:
- No-Code Feature Tagging: Userpilot’s click-to-track feature tagger lets you mark features, buttons, and elements with the Chrome extension. You’ll be able to track user interactions such as clicks, hovers, or inputs to get an accurate behavioral view for specific features.

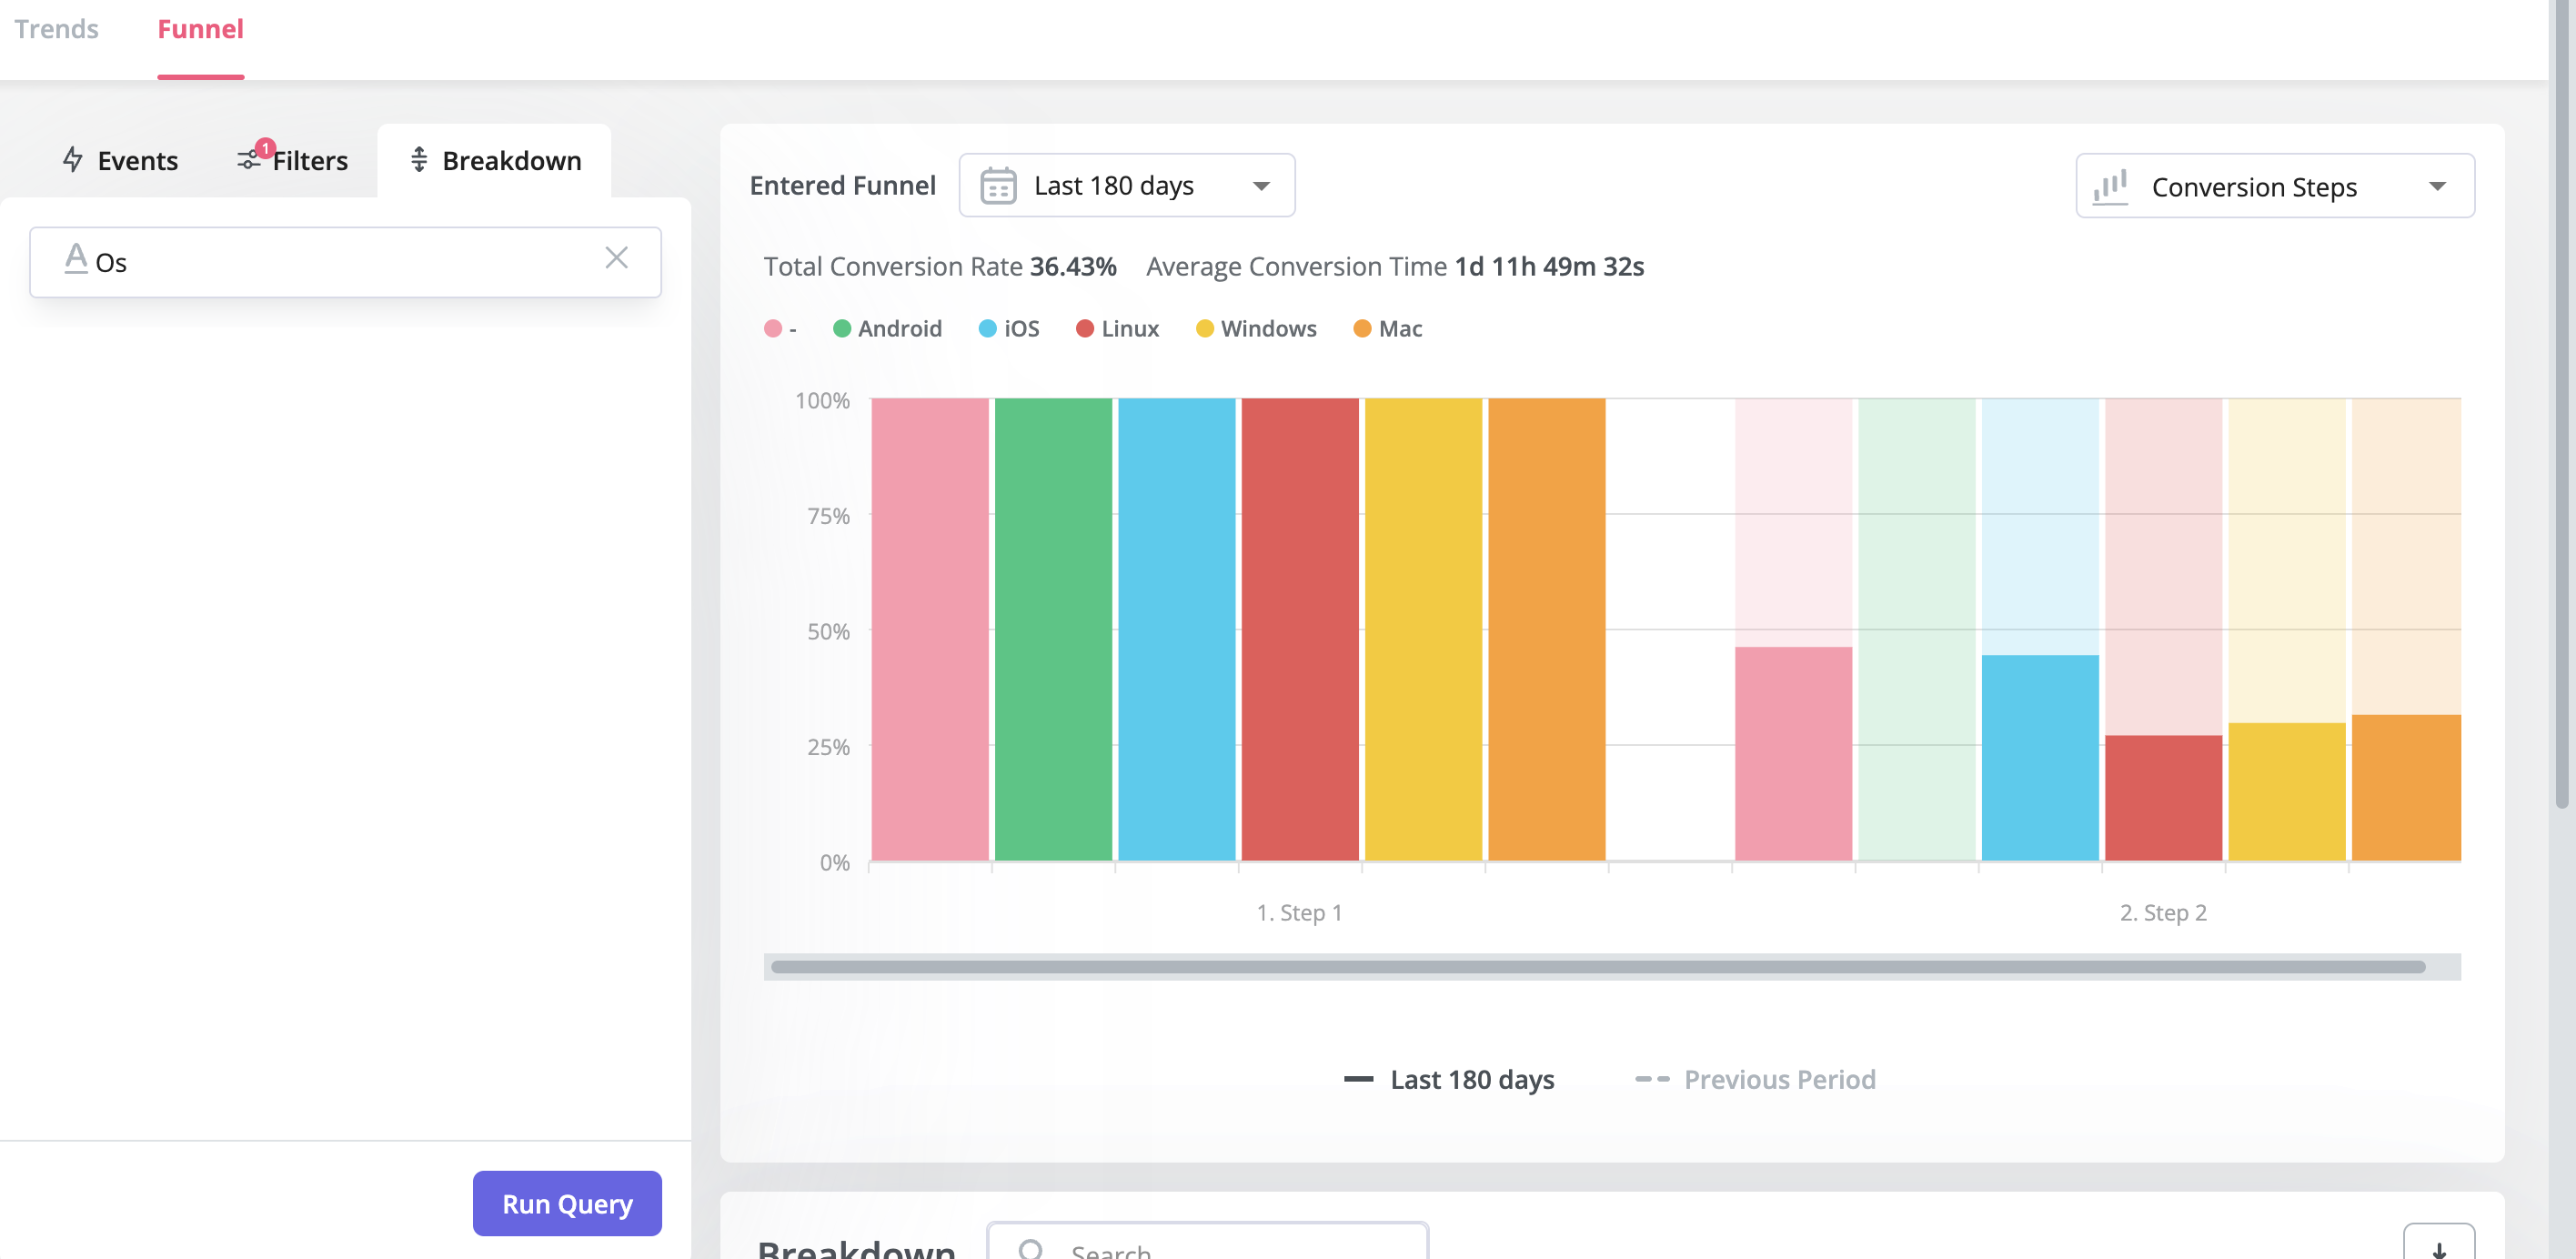
- Funnel Reports: Funnel reports show you the total number of users that enter a funnel and the percentage of users that complete each step. This can help you track behavioral paths and see which stages most users get stuck on.
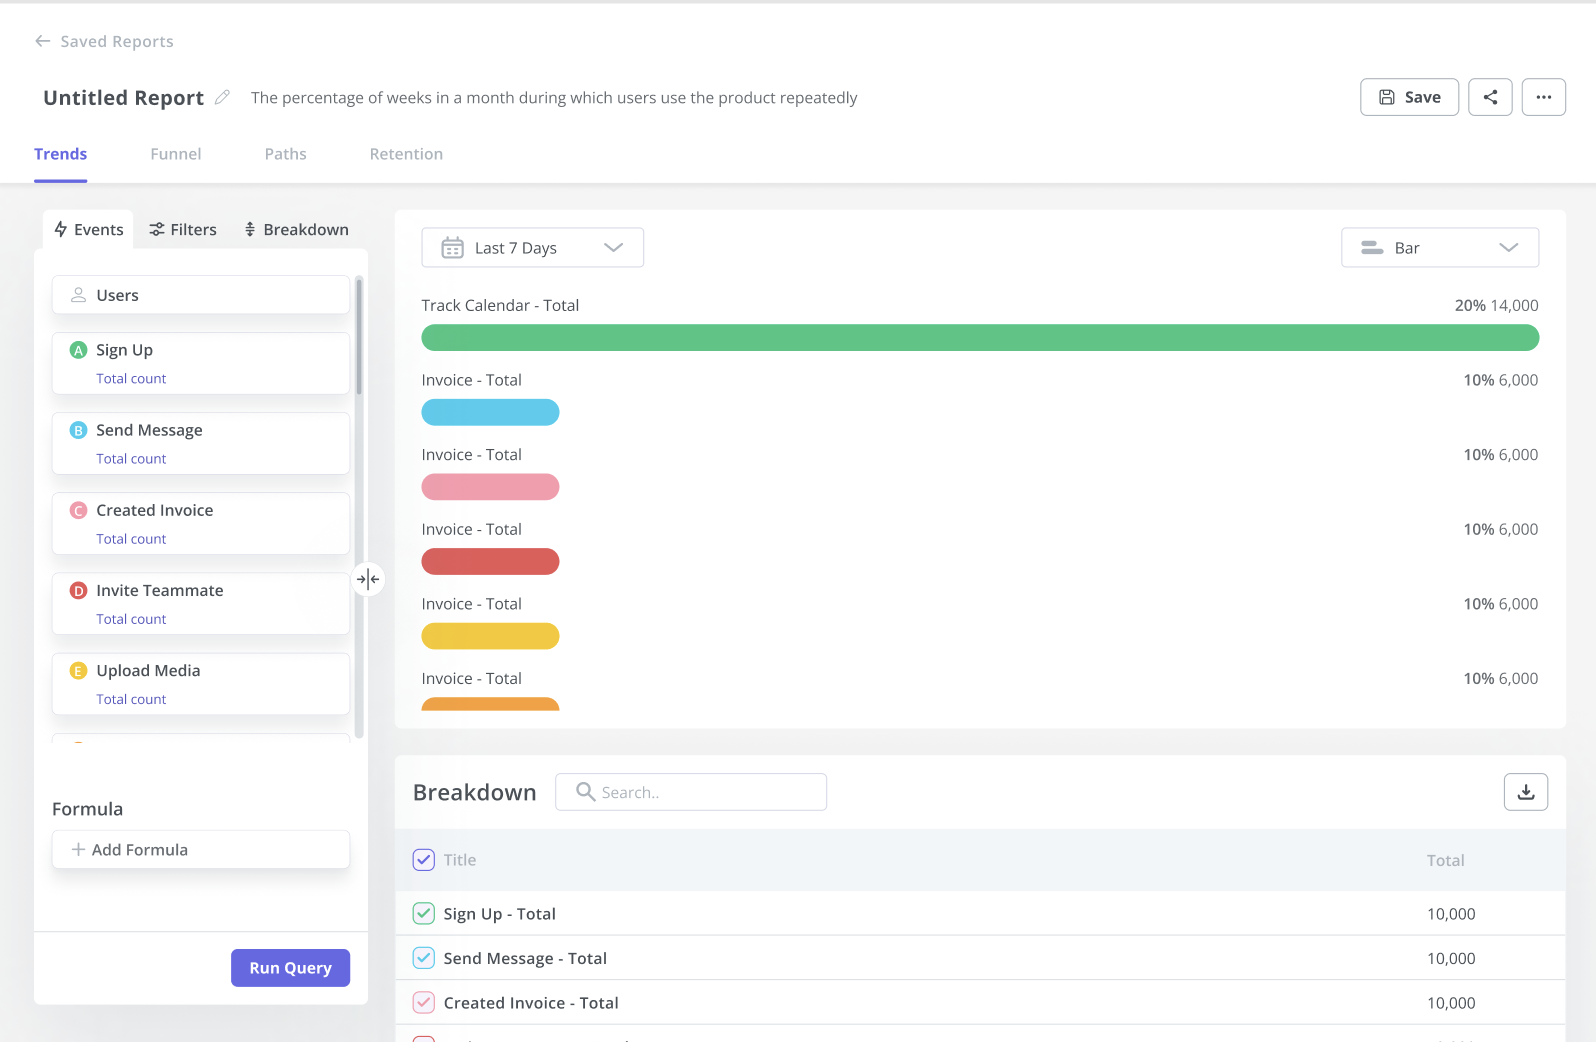
- Trends Reports: Generating trends reports will help you visualize the occurrence of key events over time and break down these analytics by device, browser, operating system, country, signup date, or even individual user IDs and email addresses to see granular behavioral analytics.
Userpilot’s event tracking
Event tracking is essential for tracking feature usage, progress towards product goals, and extracting actionable insights. Userpilot lets you create event tags without writing any code, view all your goals from a single dashboard, and sync event data to your integrations.
Here’s how you can use Userpilot as an event-tracking tool:
- No-code tagging: Userpilot’s no-code tagging capabilities let you set up event tracking for buttons, features, and elements. You can track clicks, hovers, or user inputs. You’ll also be able to group multiple events as a custom event to give you more accurate insights.

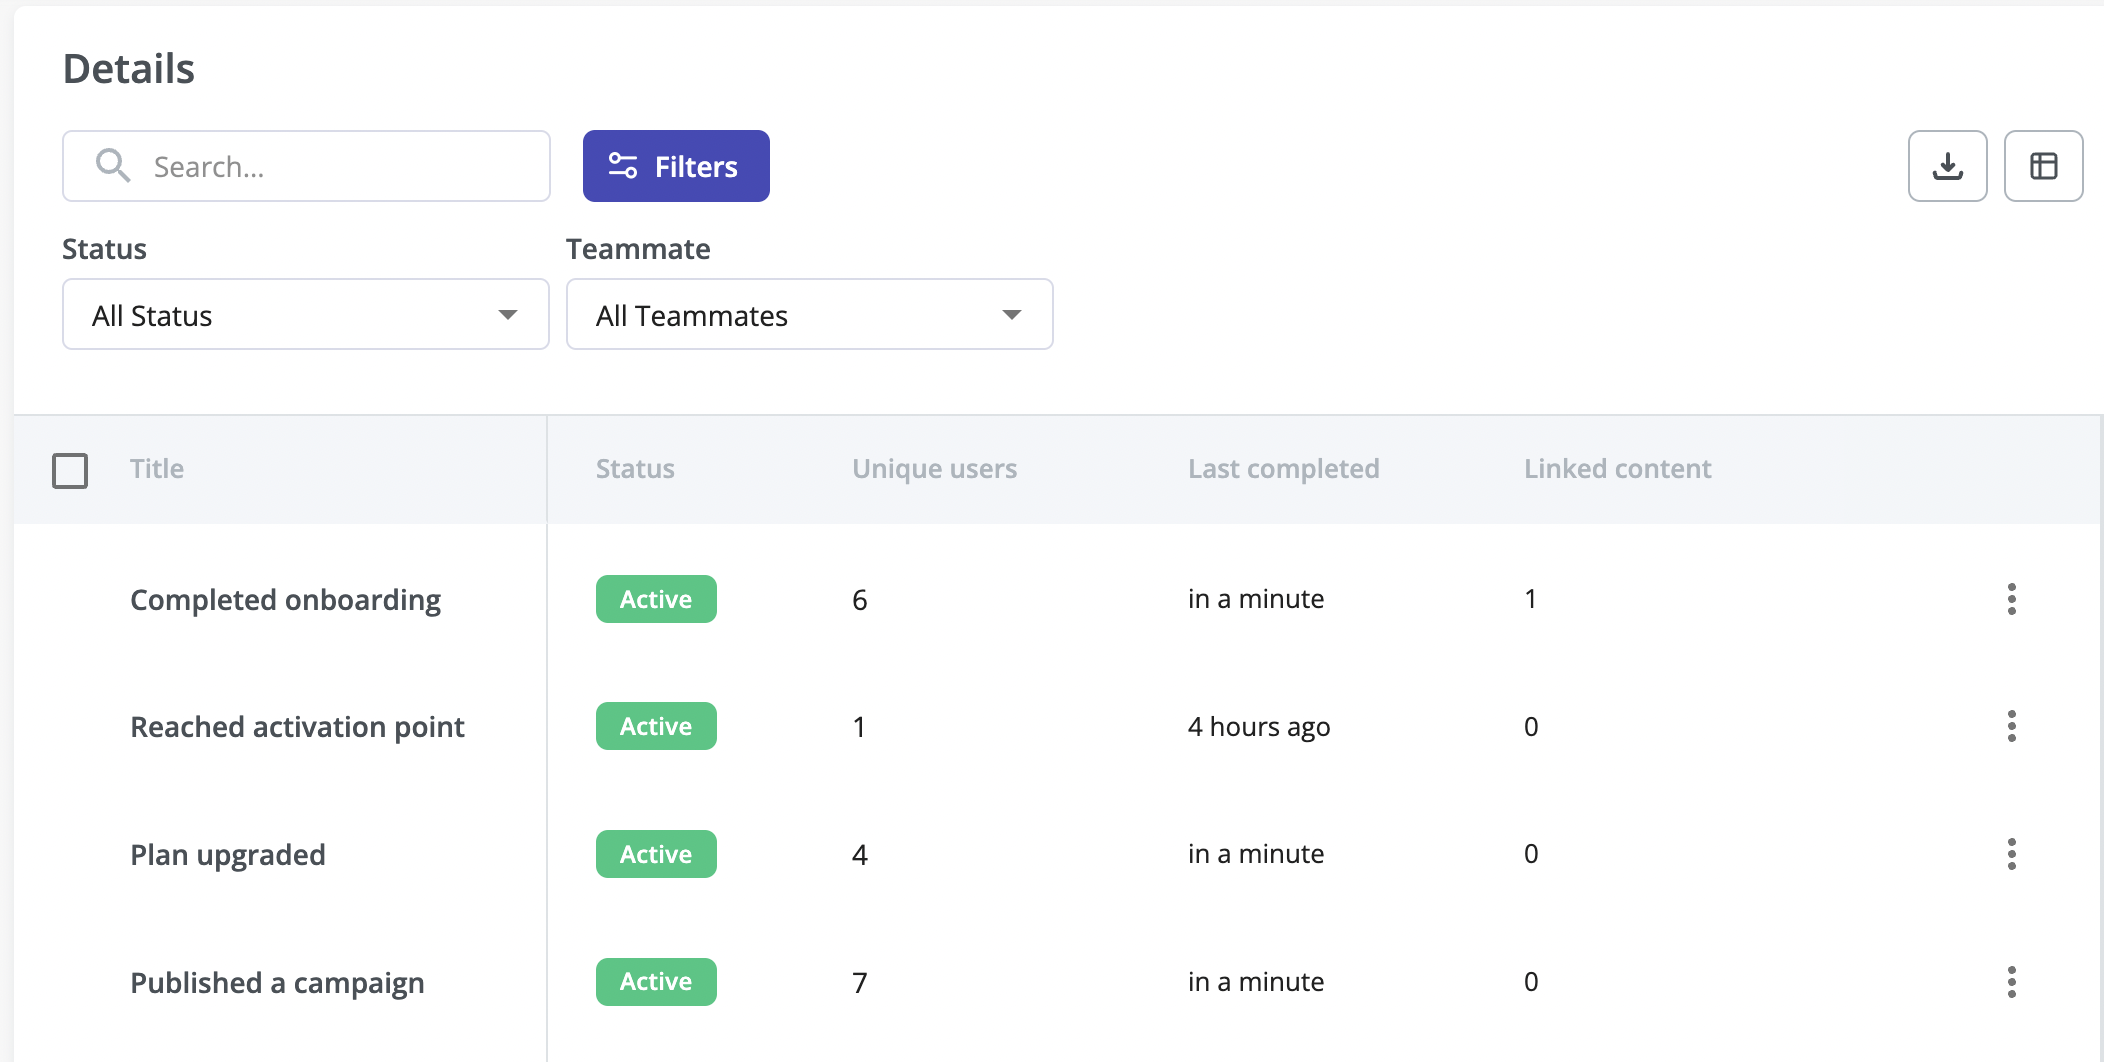
- Event goals: The Goals dashboard will let you track how many users have performed a desired action. You can also track users who have completed a specific event and see how that impacts other aspects of their journey down the line, such as feature usage or upsell events.
- Third-party integrations: Userpilot integrates with dedicated analytics tools like Amplitude, Mixpanel, Heap, and more. This lets you seamlessly stream event data to other tools in your tech stack and get a clearer view of key events across the entire user base.
Userpilot’s feature tags
Tracking feature adoption is essential to identify under-utilized features and push users toward discovering them. Userpilot lets you tag features without writing any code, track adoption through engagement analytics, and visualize feature usage with heatmaps.
Here’s how you can use Userpilot to conduct feature audits and drive feature adoption:
- No-code tagging: Userpilot’s no-code feature tagger lets you add tags through the Chrome extension’s visual builder. You’ll also be able to select whether the tag should track clicks, hovers, or text inputs from users to get contextual data that reflects actual feature usage.
- Feature tags: The advanced feature analytics of Userpilot lets you track feature performance trends, see the top 20 features across your user base, and see granular data for individual features. You’ll also be able to filter your data by segment, company, or time period.
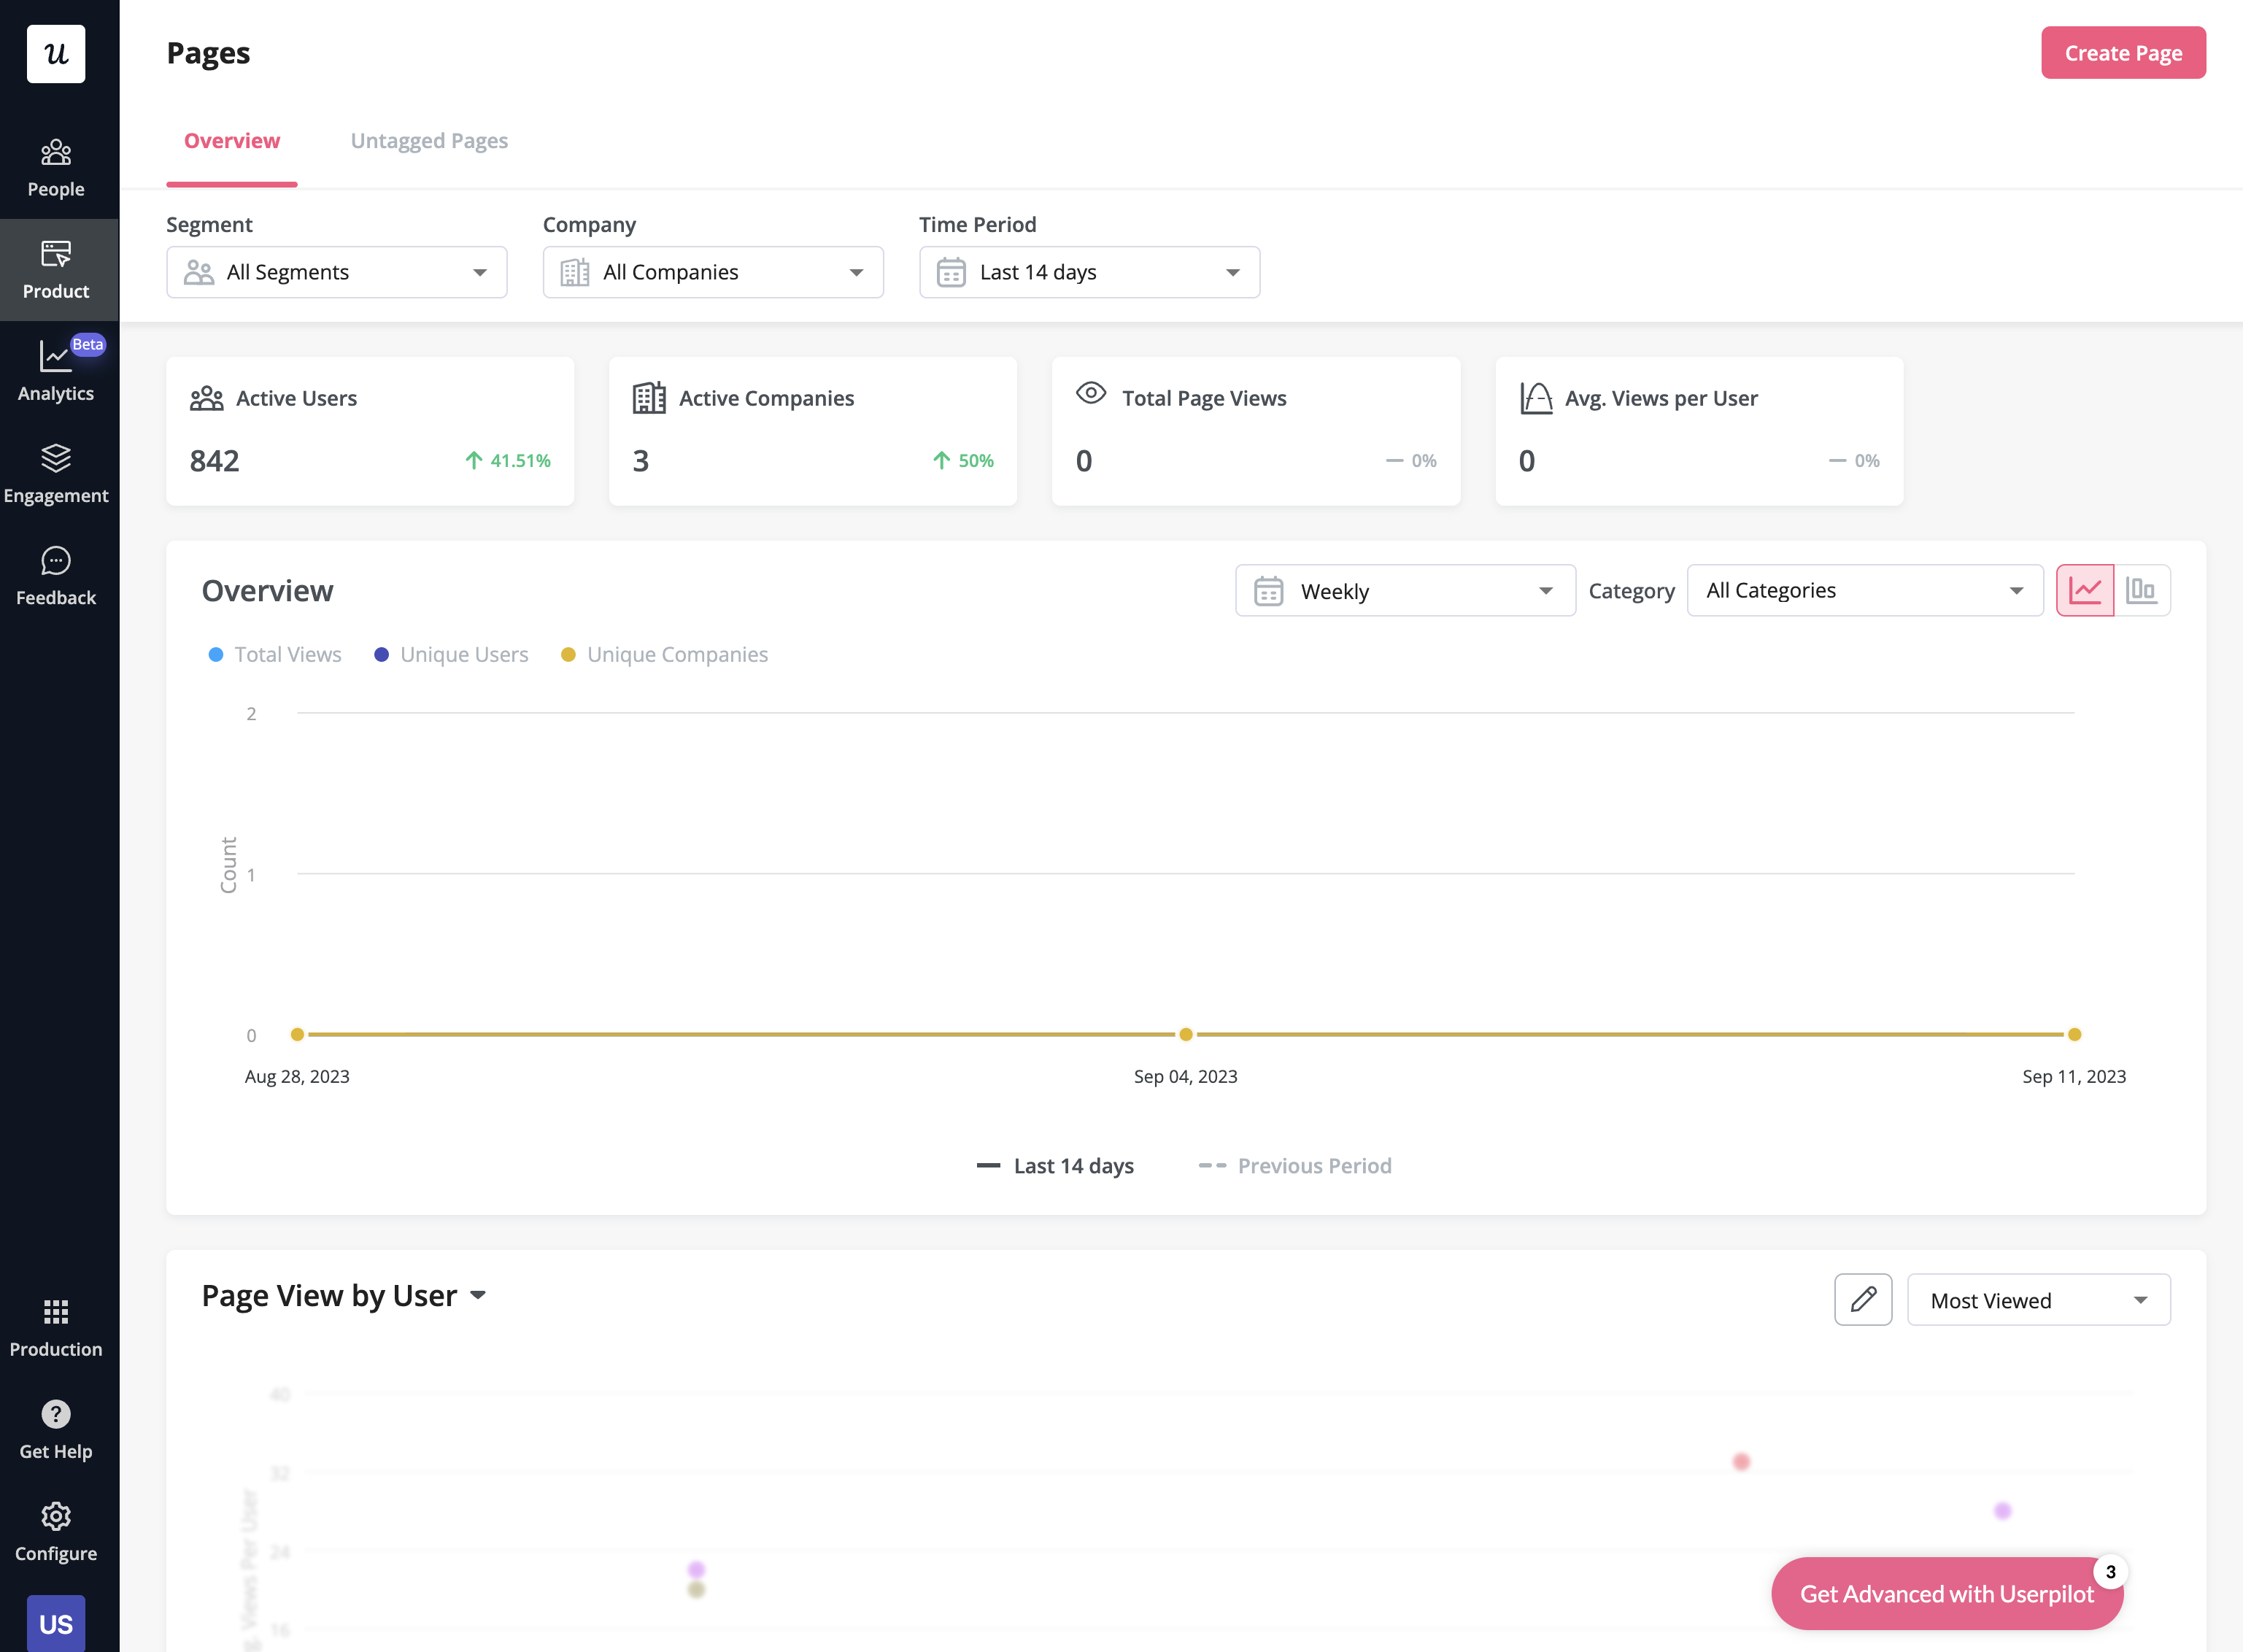
- Usage heatmaps: Userpilot heatmaps show you the features/elements with the most interactions. Heatmaps can be generated on the Features & Events dashboard by clicking on a tagged feature, editing it in the builder, and then clicking the heatmap icon on the bottom toolbar.
Userpilot’s user journey mapping
User journey mapping helps you visualize all the interactions between users and your product as they try to achieve a particular goal. Userpilot’s detailed user analytics and funnel/trend reports help you track customers as they progress through different stages of their journey.
Here are the Userpilot features you can use for user journey mapping:
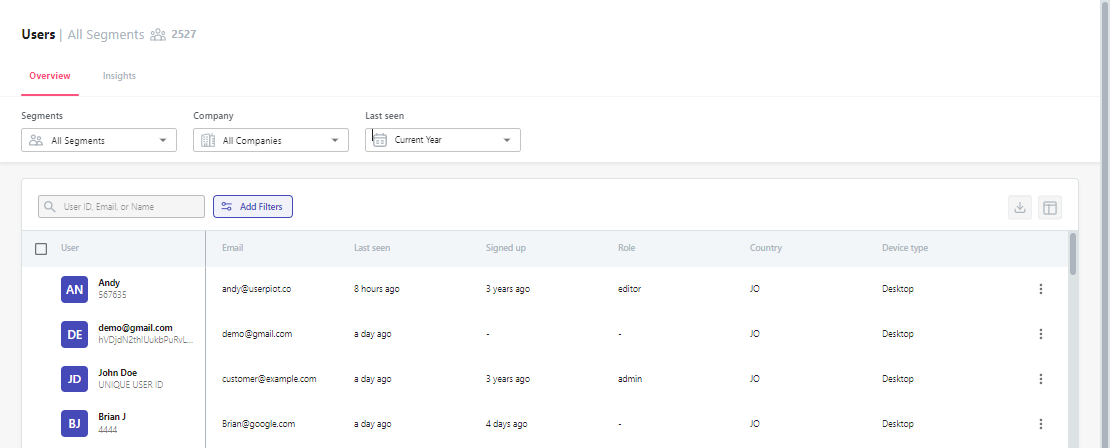
- User analytics: The Users dashboard provides detailed analytics of your entire customer base. You’ll be able to sort by segment, company, or time period and add multiple filters to help you narrow results. You can also perform bulk actions and export user data in a CSV format.
- Funnel reports: These reports help you visualize the user journey map by showing which stage, page, or action most users get stuck on. You’ll also be able to view breakdowns so you can see how the user journey changes depending on which OS, browser, or device type a user is on.
- Trend reports: Userpilot’s trend reports offer behavioral insights such as how often users perform a specific action, the number of unique users who take that action, and where in the user journey these actions occur. You can also create custom metrics and build your own charts.
Userpilot’s user segmentation analysis
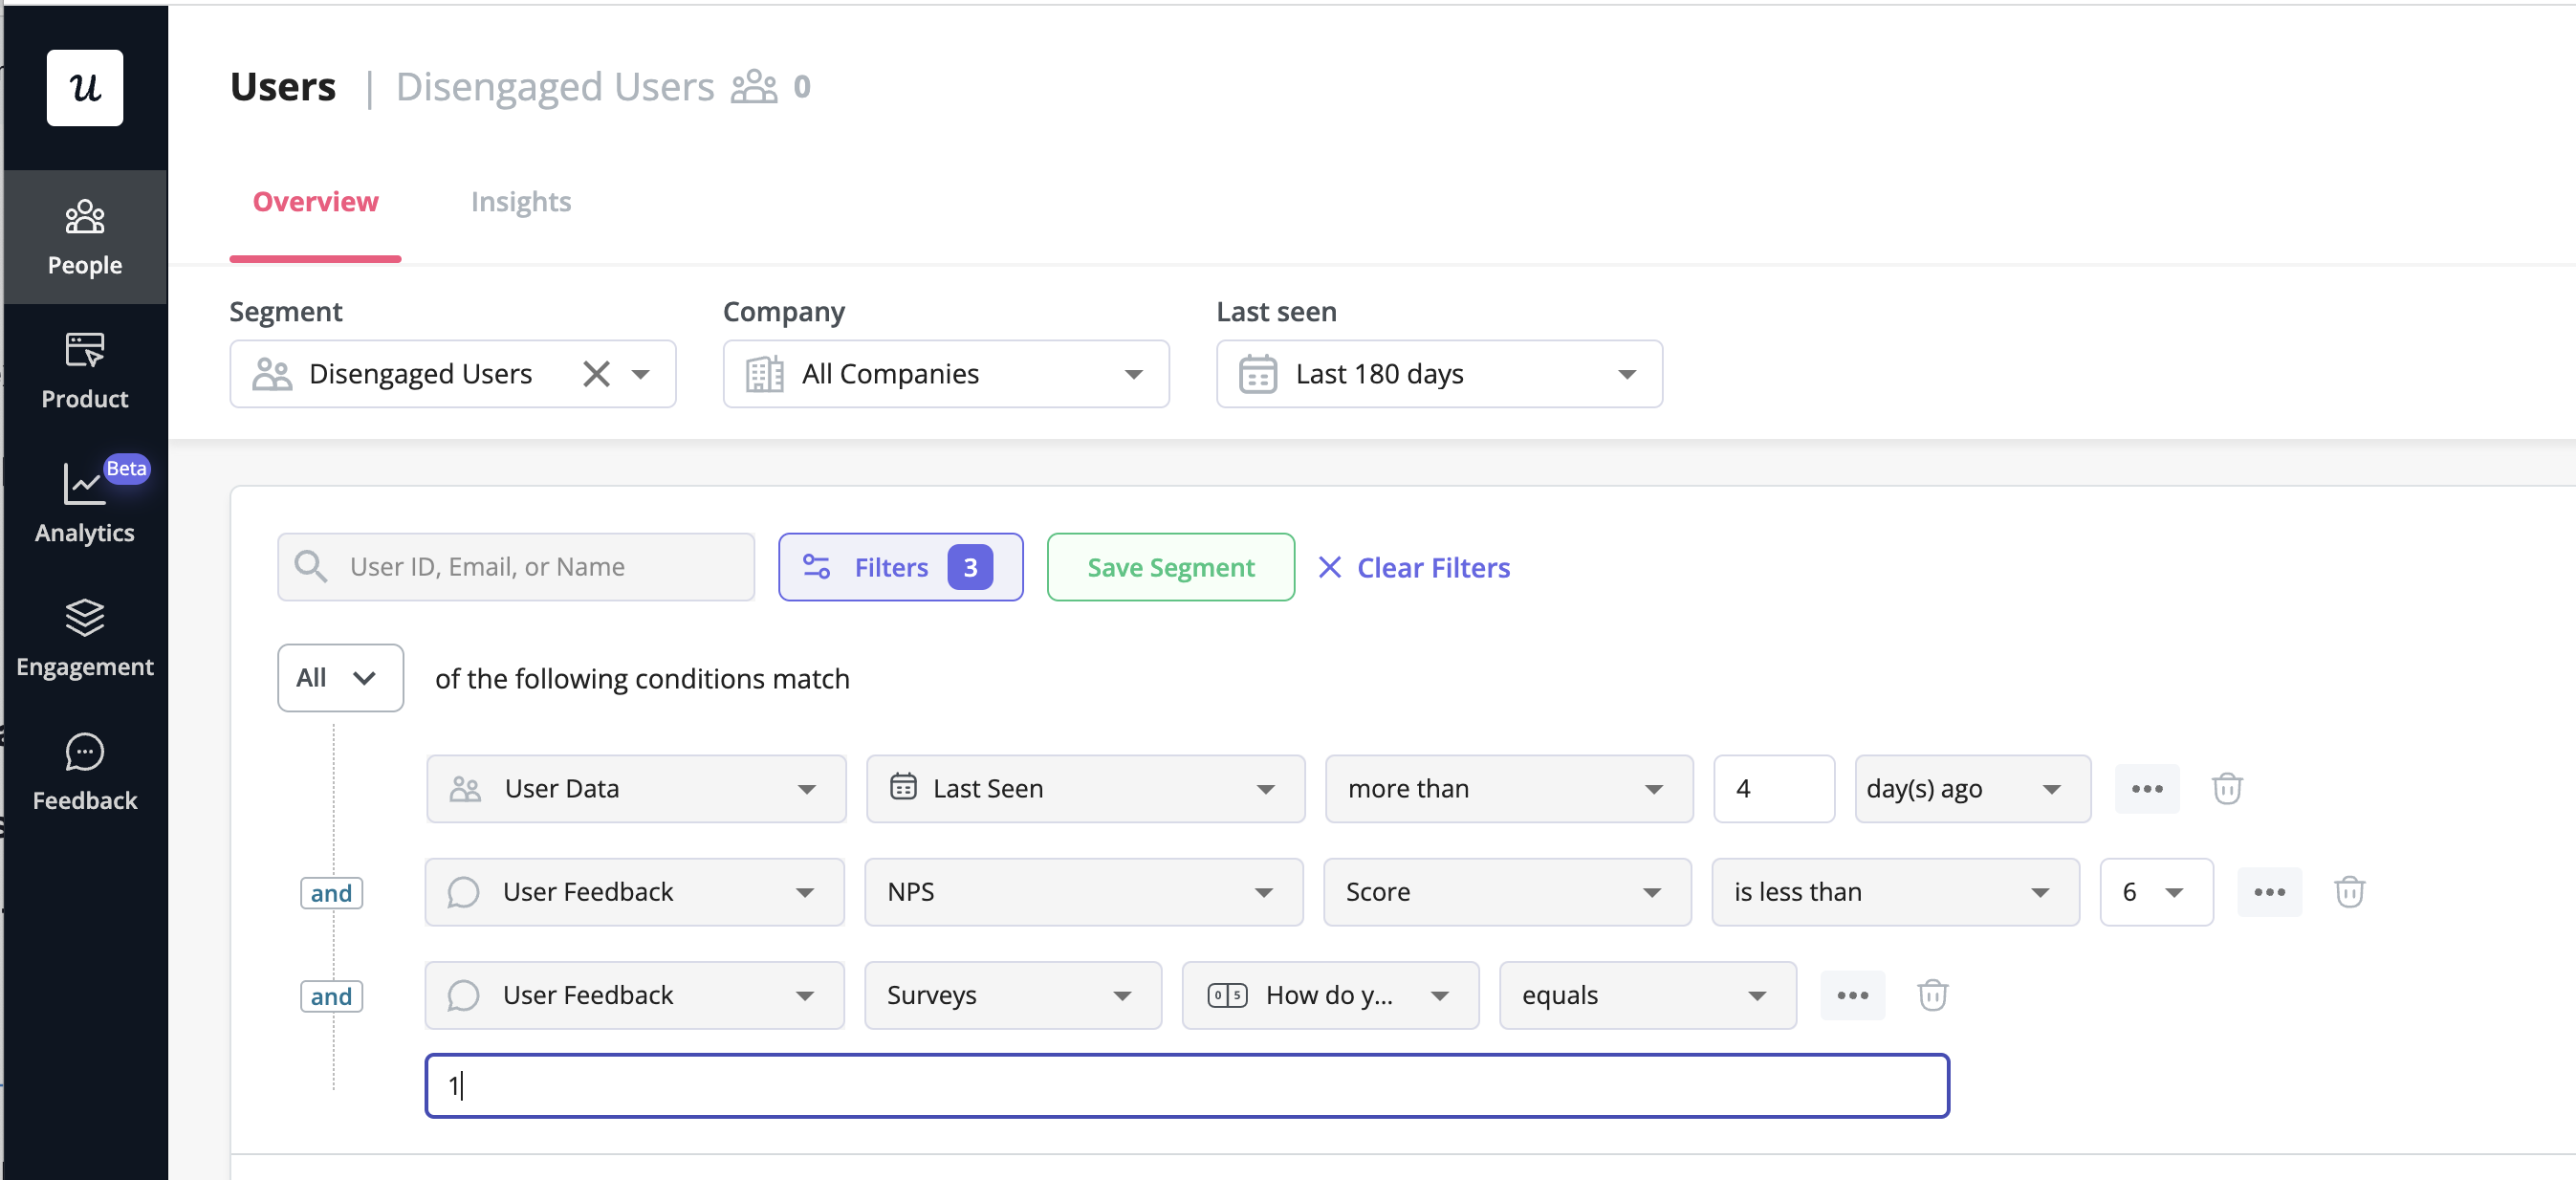
User segmentation is a key part of building a contextual onboarding experience for new customers. Userpilot lets you segment your customers when they meet specific conditions, filter through analytics using user attributes, and trigger flows for users in different segments.
Here are some of Userpilot’s customer segmentation capabilities:
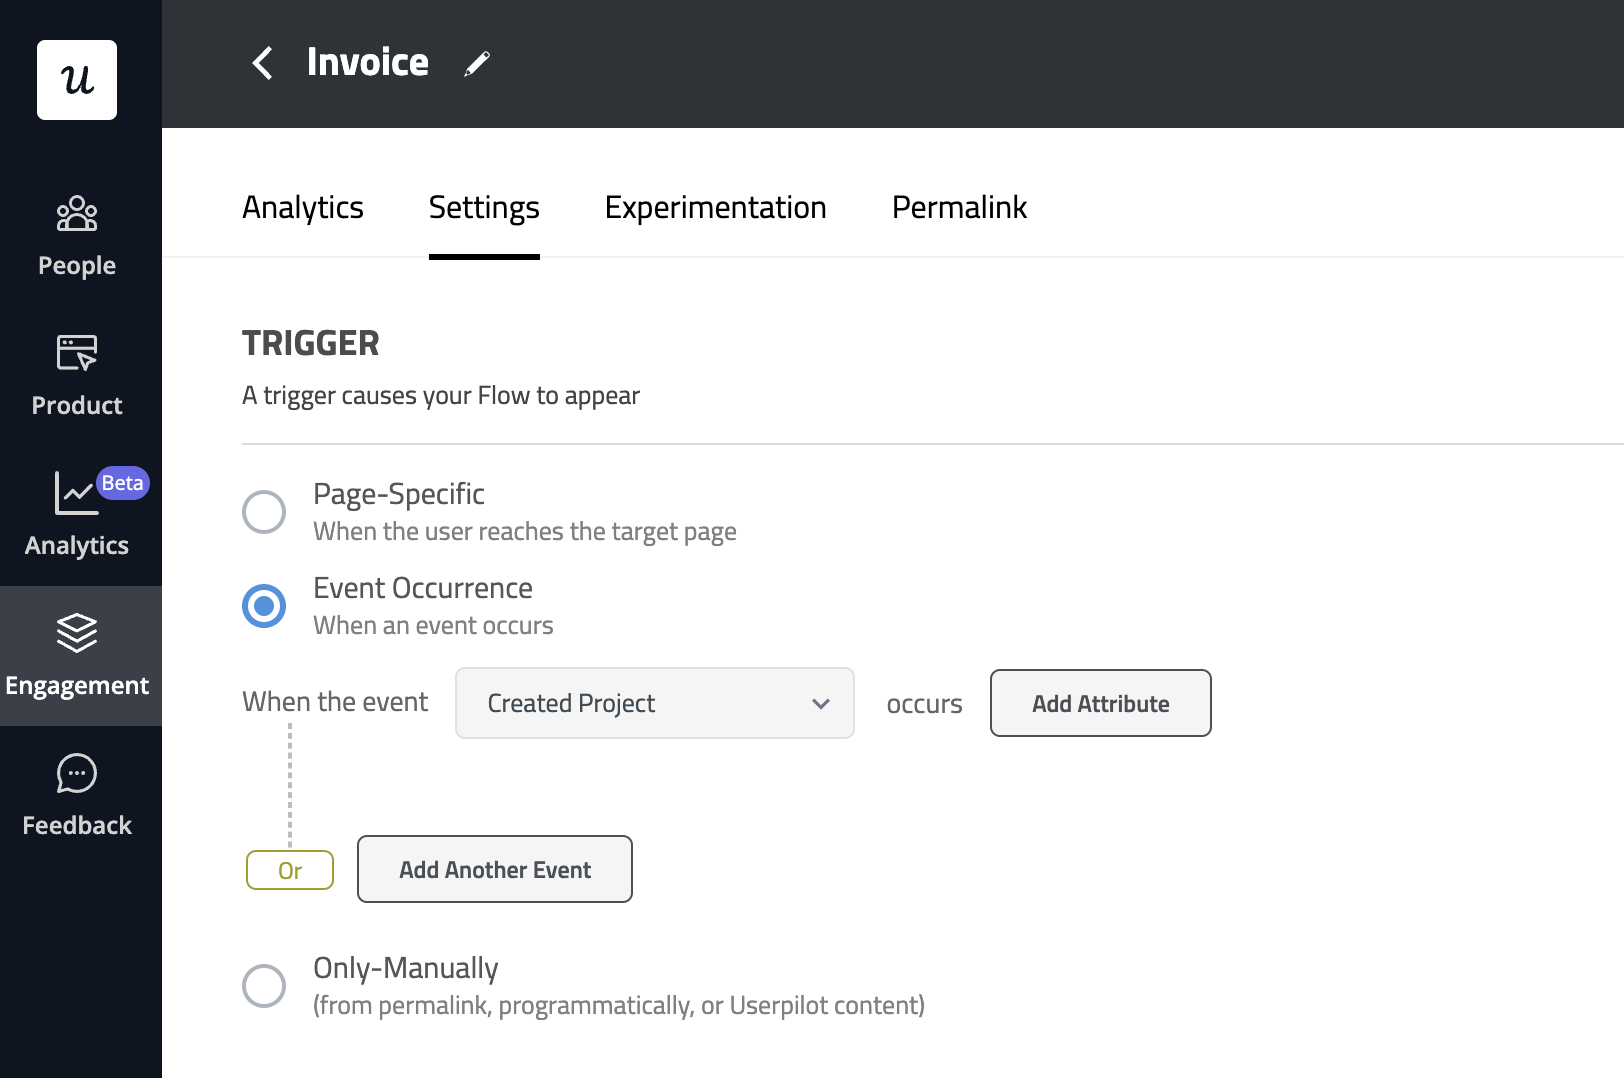
- Conditional Segments: Userpilot lets you build segments for users who match conditions on what device/browser/OS they’re using, which country they live in, what their NPS score is, and any custom events they’ve performed. You can then use these segments as filters/triggers.
- Analytics Filters: The product analytics and user insights dashboards on Userpilot can be set to only show data from certain user segments or companies. This makes it possible to identify actionable insights from specific user cohorts and benchmark performance between segments.
- Flow Triggers: Userpilot audience settings make it possible to target in-app flows to certain user segments or only show flows to users who meet specific conditions. You could also add event-based or page-specific triggers to show relevant flows with contextual timing.
What are the pros and cons of Userpilot?
Userpilot pros
As a full-suite digital adoption platform, Userpilot has all the features you need to onboard users, track analytics, and gather feedback from customers without writing a single line of code. Here are a few pros of using Userpilot as your product growth solution:
- No-code builder: Userpilot’s Chrome extension lets you build flows, add UI elements, and tag features without writing a single line of code.
- UI patterns: There are plenty of UI patterns to choose from when using Userpilot, such as hotspots, tooltips, banners, slideouts, modals, and more!
- Startup-friendly: Userpilot’s entry-level plan gives you access to all available UI patterns so you can hit the ground running.
- Walkthroughs and flows: Build engaging interactive walkthroughs and personalized onboarding flows that target specific segments of your user base.
- Self-service support: Build an in-app resource center to help users solve problems, customize its appearance to align it with your brand, and insert various types of content (videos, flows, or chatbots) to keep your customers satisfied.
- A/B testing: Userpilot’s built-in A/B testing capabilities will help you split-test flows, iterate on the best-performing variants, and continually optimize based on user behavior.
- Feedback collection: Userpilot has built-in NPS surveys with its own unified analytics dashboard and response tagging to help you retarget users. There are other survey types to choose from and you can even create your own custom survey.
- Survey templates: There are 14 survey templates to choose from so you can gather feedback on specific features or run customer satisfaction benchmarking surveys like CSAT and CES.
- Advanced analytics: Userpilot lets you analyze product usage data, monitor engagement on all in-app flows, and use the data to create user segments that are based on behaviors instead of demographics.
- Event tracking: Userpilot’s no-code event tracking lets you tag UI interactions (hovers, clicks, or form fills) and group them into a custom event that reflects feature usage.
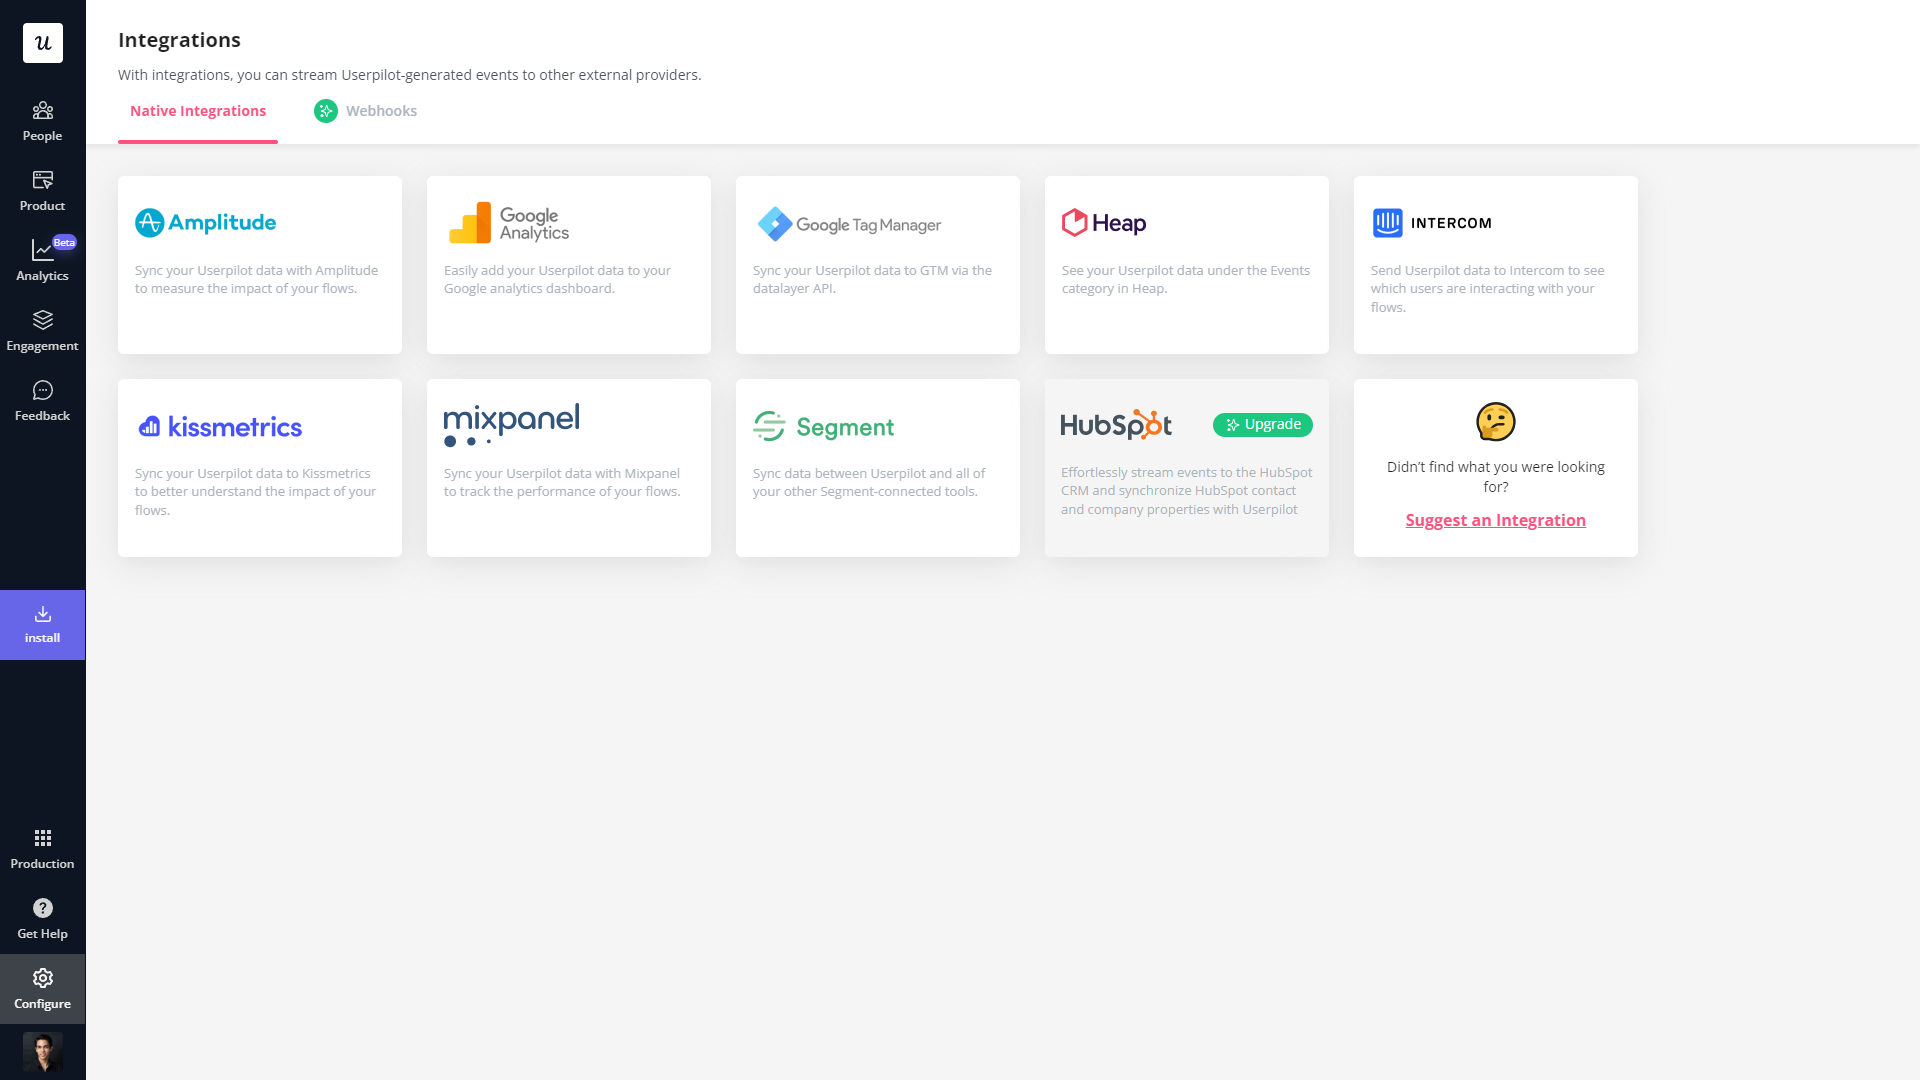
- Third-party integrations: Userpilot has built-in integrations with tools like Amplitude, Mixpanel, Kissmetrics, Segment, Heap, HubSpot, Intercom, Google Analytics, and Google Tag Manager so you can share data between all the solutions in your tech stack.
Userpilot’s cons
Of course, no tool is perfect and there are a few cons to consider before choosing Userpilot as your user onboarding or product growth solution:
- Employee onboarding: Currently, Userpilot only supports in-app customer onboarding.
- Mobile apps: Userpilot doesn’t have any mobile compatibility which could make it difficult for developers with cross-platform applications to create a consistent user experience for both versions of their product.
- Freemium plan: There’s no freemium Userpilot plan so those bootstrapping their startup and need sub-$100 solutions should consider more affordable onboarding platforms like UserGuiding or Product Fruits.
What do users say about Userpilot?
Most users laud Userpilot for its versatile feature set, ease of use, and responsive support team:
I recently had the pleasure of using Userpilot, and I must say it exceeded all my expectations. As a product manager, I’m always on the lookout for tools that can enhance user onboarding and improve overall user experience. Userpilot not only delivered on these fronts but also went above and beyond with its impressive new features, unparalleled ease of use, and truly exceptional customer support.
What truly sets Userpilot apart is its outstanding customer support. Throughout my journey with Userpilot, the support team has been responsive, knowledgeable, and genuinely dedicated to helping me succeed. Whenever I had a question or encountered an issue, their support team was always there to assist promptly, going above and beyond to ensure my concerns were addressed effectively.
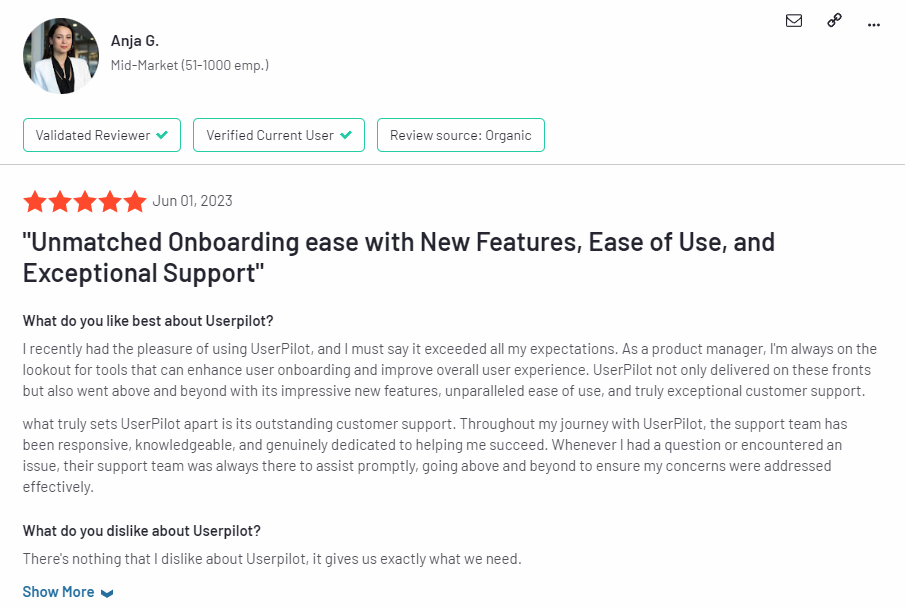
Source: G2.
Of course, other users are also kind enough to share constructive criticism regarding specific features like event tracking filters:
“The filtration while analyzing specific events is a little confusing. Understanding of custom properties and data management configuration could have been more organised.”
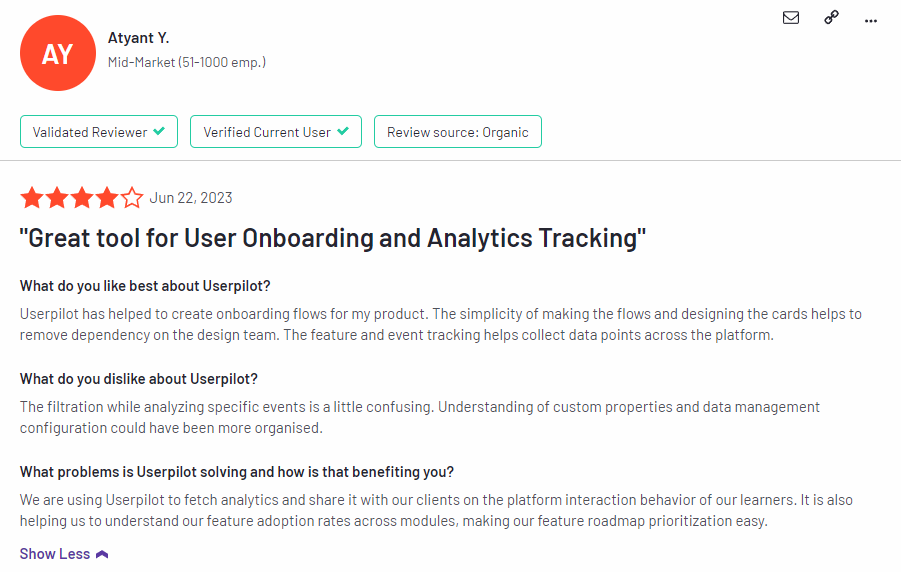
Source: G2.
Userpilot’s pricing
Userpilot’s transparent pricing ranges from $249/month on the entry-level end to an Enterprise tier for larger companies.
Furthermore, Userpilot’s entry-level plan includes access to all UI patterns and should include everything that most mid-market SaaS businesses need to get started.
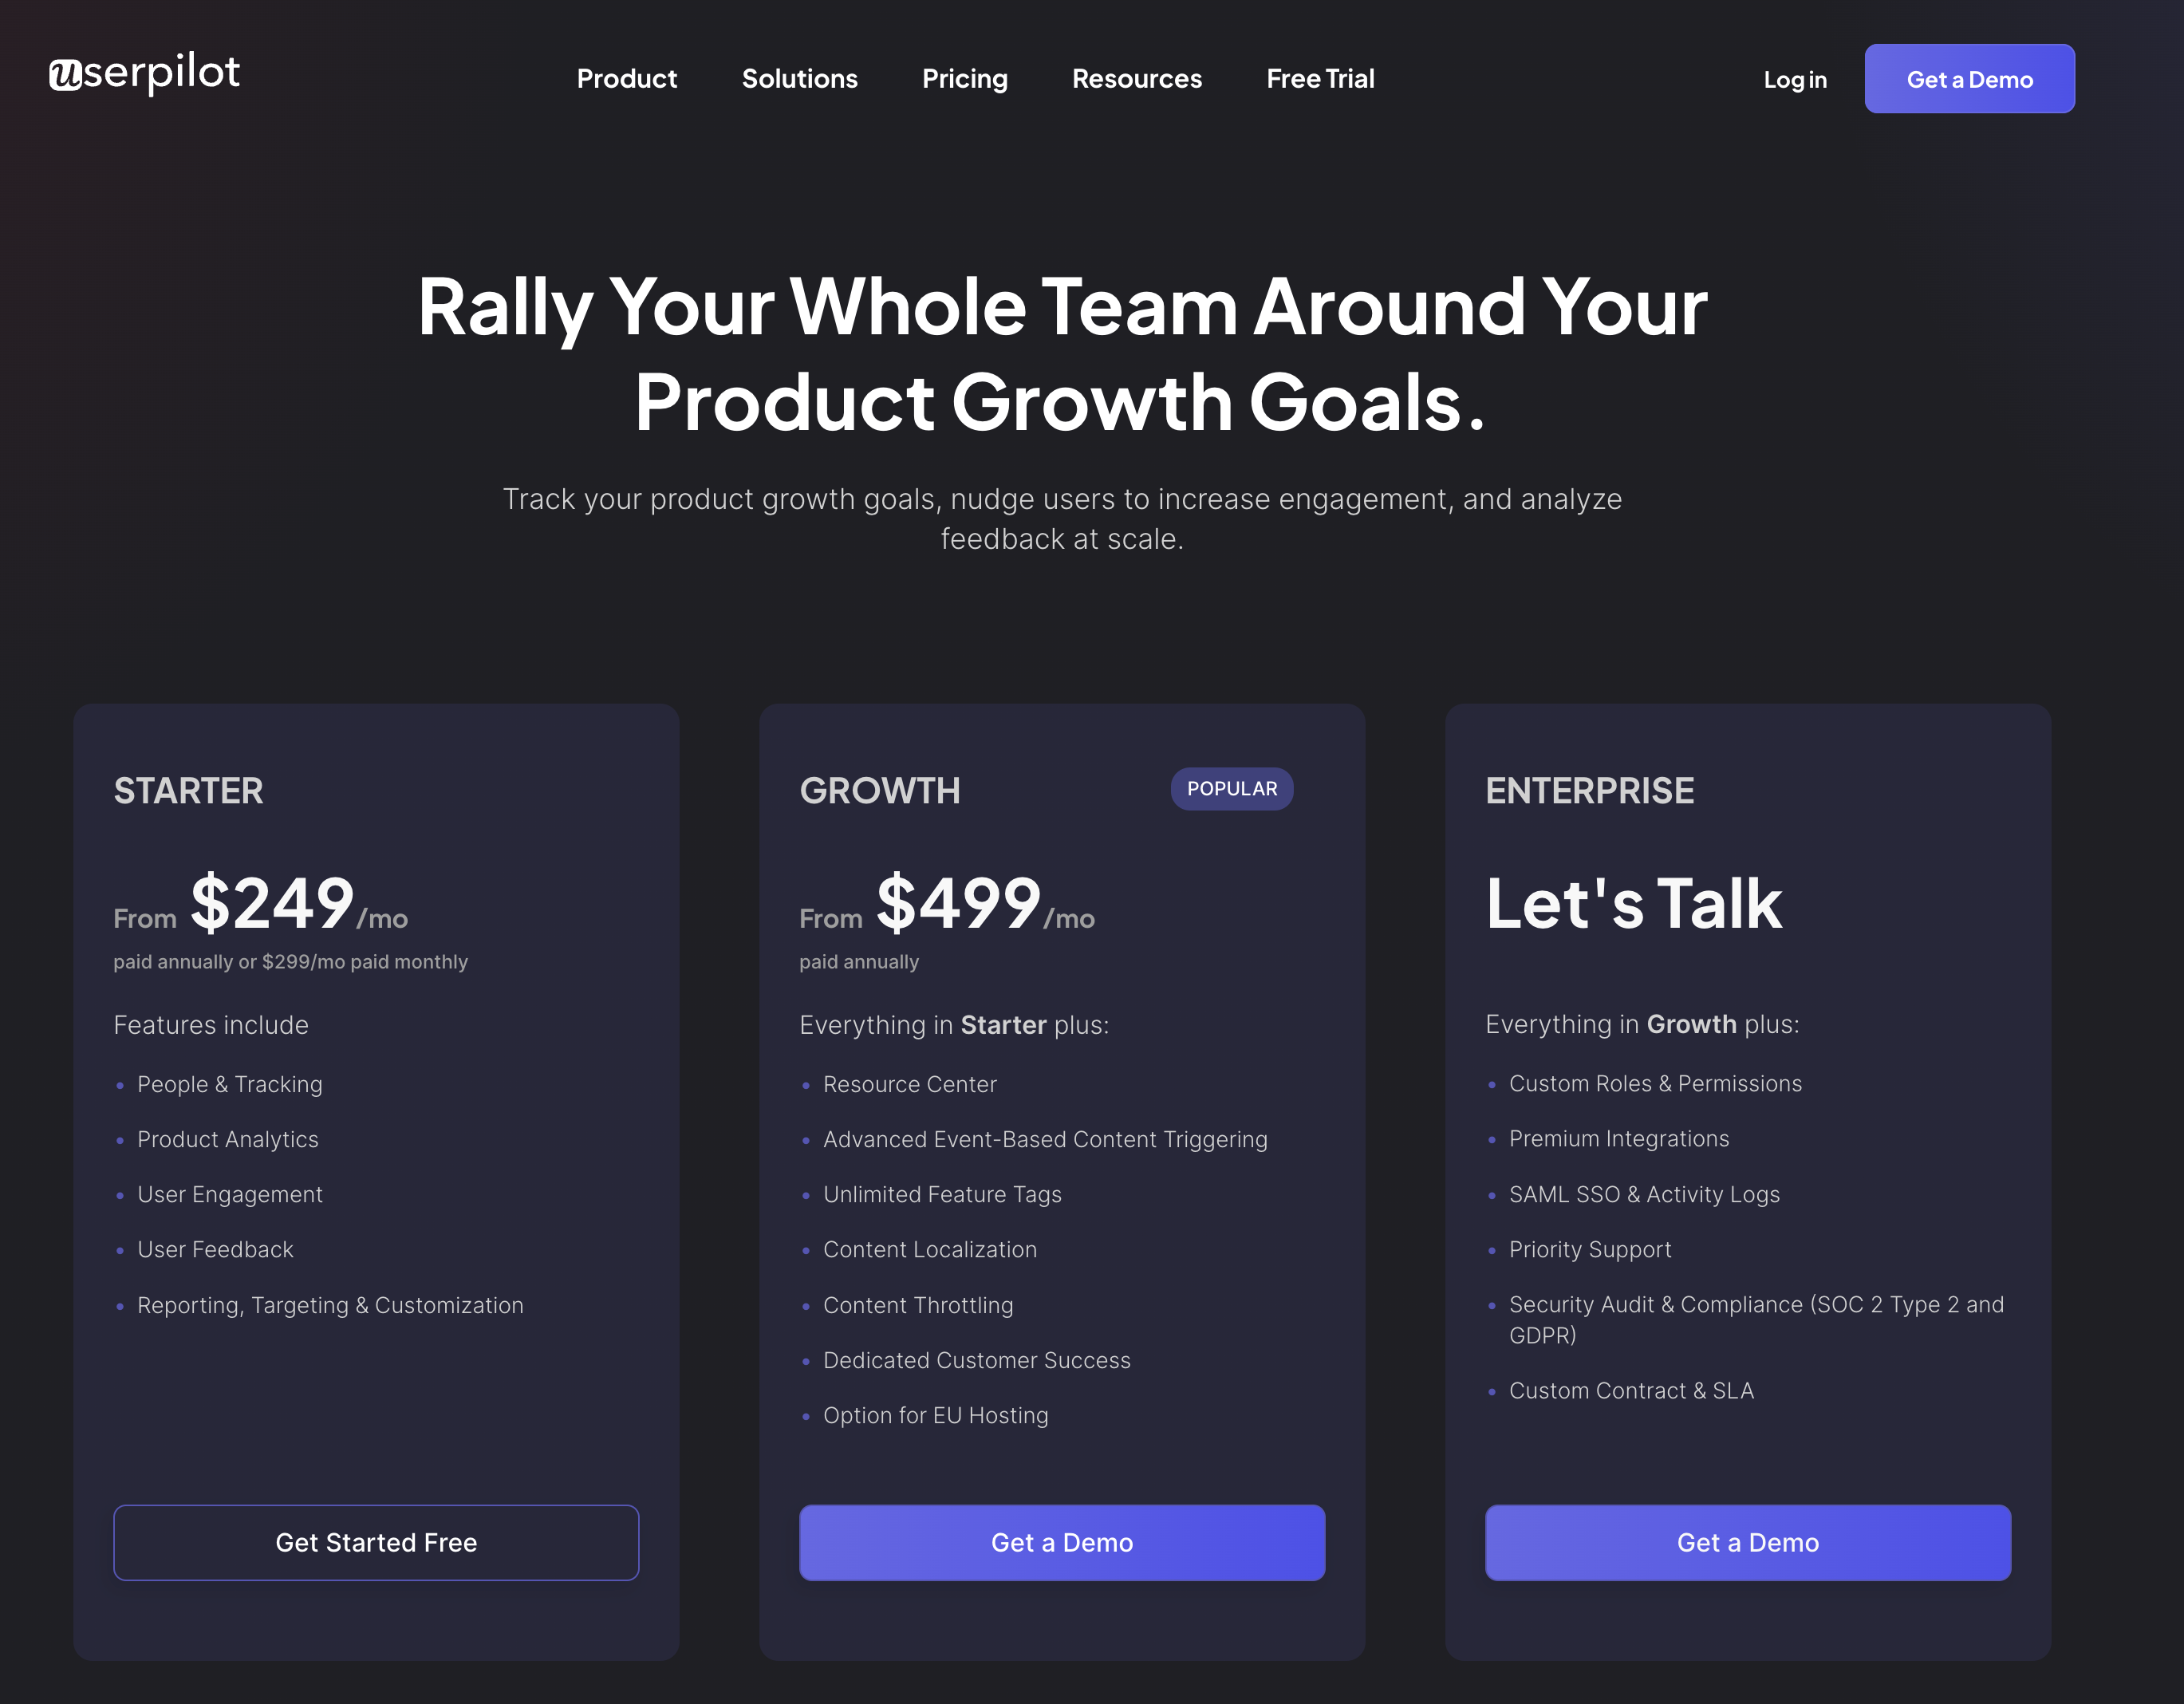
Userpilot has three paid plans to choose from:
- Starter: The entry-level Starter plan starts at $249/month and includes features like segmentation, product analytics, reporting, user engagement, user feedback, and customization.
- Growth: The Growth plan starts at $499/month and includes features like resource centers, advanced event-based triggers, unlimited feature tagging, AI-powered content localization, EU hosting options, and a dedicated customer success manager.
- Enterprise: The Enterprise plan uses custom pricing and includes all the features from Starter + Growth plus custom roles/permissions, access to premium integrations, priority support, custom contract, SLA, SAML SSO, activity logs, security audit and compliance (SOC 2/GDPR).
Conclusion
There you have it.
It should be easier now to make an informed decision whether Stonly is your go-to option for User behavior analysis. Ultimately, the best choice will depend on your product and current needs.
If you’re looking for a better alternative to Stonly for User behavior analysis, book a Userpilot demo today to experience firsthand how it can enhance your user experience and drive product growth!
![]()
Looking for a Better Alternative for User Behavior Analysis? Try Userpilot

