
Try Userpilot Now
See Why 1,000+ Teams Choose Userpilot

What is user behavior analytics (UBA)?
User behavior analytics (UBA) consists of the tracking, collection, and assessment of user behavior(s) through the use of data monitoring mechanisms. It is used to identify friction points, reduce churn rates, and retain at-risk customer accounts.
Why is user behavior analytics important?
There are many benefits to user behavior analytics as well as a few key reasons why it’s important:
- Friction reduction. User behavior analytics can help you identify friction points within the product so you can eliminate them. Similarly, it can be used during the funnel analysis process to highlight the drop-off rates between different steps of the funnel.
- UI/UX optimization. Because UBA offers insight into the ways that actual customers use your product, it helps you design your UI/UX around realistic user behavior patterns. This will make the user interface more intuitive to navigate and improve the user experience all around.
- Identifying patterns. UBA helps you spot patterns and trends in the behavior of your users so you can personalize accordingly. These patterns can inform your onboarding, retention, gamification, and upselling strategies.
- Churn reduction. In addition to the retention boost that UI optimization and UX personalization offer, UBA can also help you detect anomalous behavior that’s indicative of at-risk customers. These early warning signs help you turn the customer’s account health around before they churn.
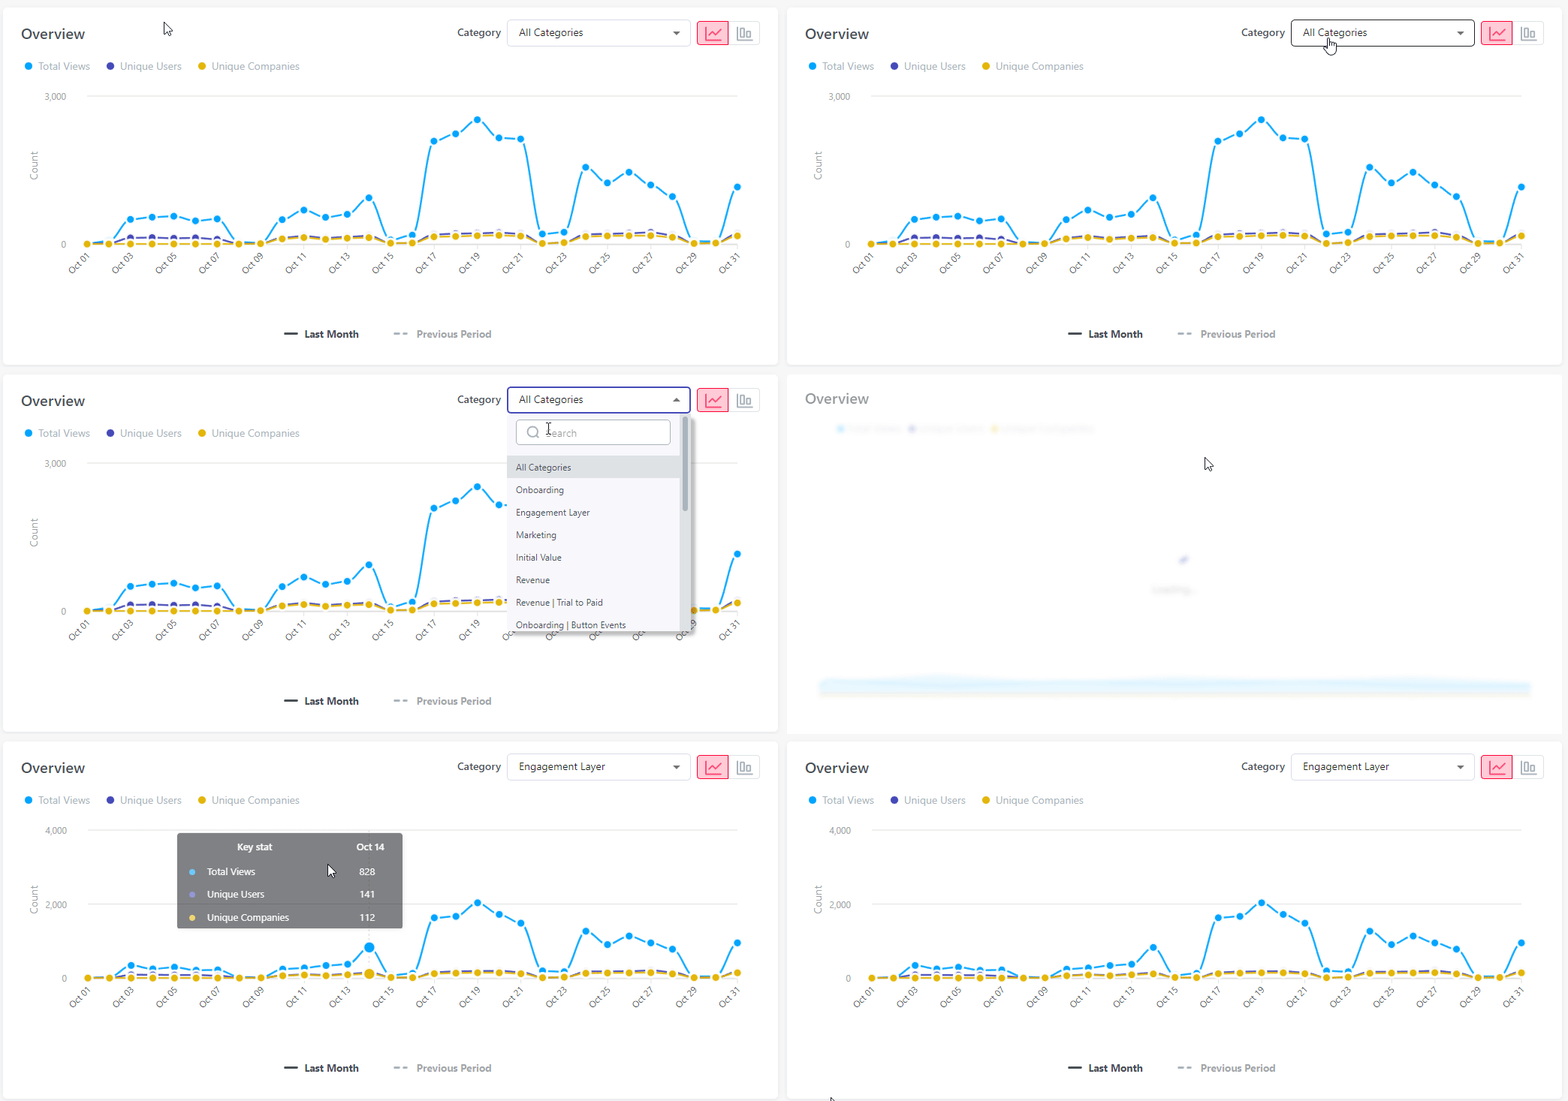
Engagement analytics with Userpilot.
In certain cases, these analytics can also help to spot suspicious behavior patterns to prevent potential threats.
Is your User Behavior Analytics strategy effective?
Tracking clicks is just the beginning. Take this quick assessment to see if you’re getting the full picture of your user behavior analytics.
UBA vs. UEBA: What is user and entity behavior analytics?
In 2015, Gartner published a marketing guide that included user and entity behavior analytics or UEBA. In addition to individual user activity, UEBA systems seek to factor in external elements like insider threats, servers/routers, applications, and other entities that could compromise account health.
UEBA is a newer concept than UBA and generates a higher data volume to facilitate its complex reporting systems. While this could increase the setup time and upfront cost to establish such a system, its multi-factor analysis will provide a more accurate picture.
What can you track with user behavior analytics?
Collecting and analyzing data is the core focus of user behavior analytics — but what exactly can you track?
Well, there are four main types of data that you’ll be looking at during the UBA process:
- Clicks.
- Mouse movement/scrolling.
- In-app/web navigation.
- User feedback.
The sections below will give you a closer look at each one!
Clicks
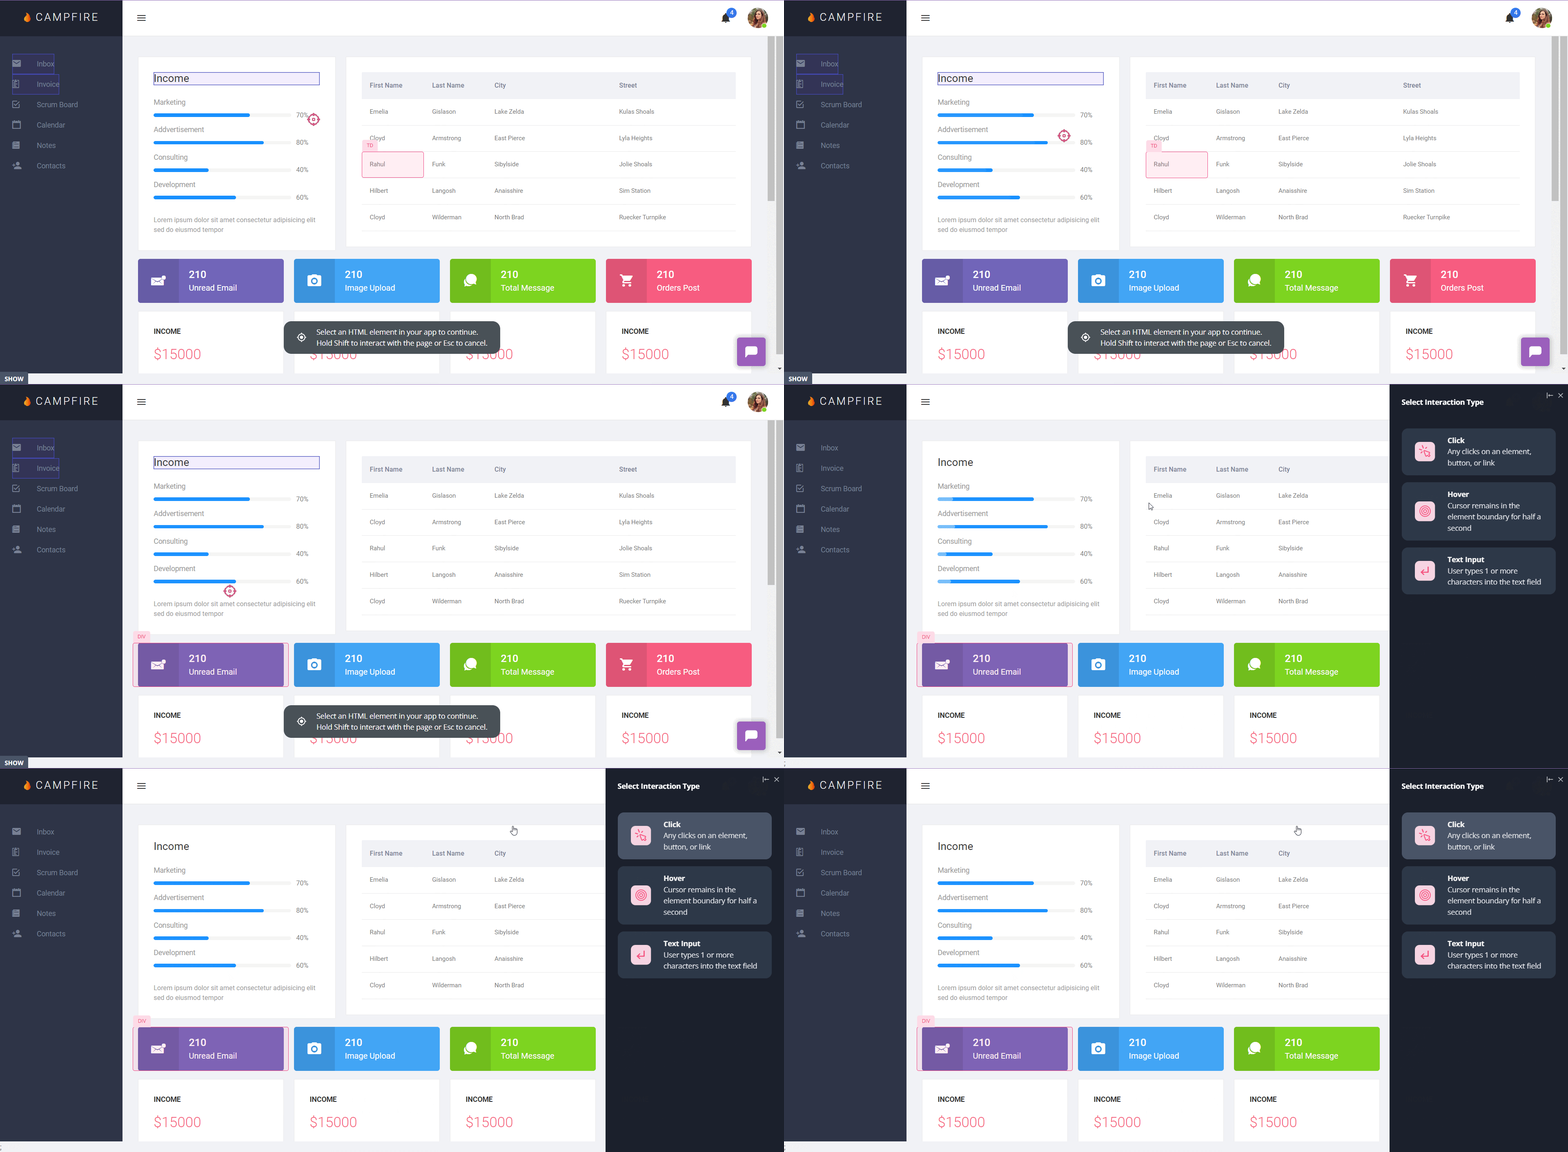
Click tracking helps you see which elements, buttons, or features users interact with the most in their time spent within the app. Dead clicks — clicks on elements that don’t do anything — can highlight confusing text or design within your user interface.
Similarly, rage clicks can indicate user frustration and show you which in-app element or product area caused it. Tracking clicks can even provide granular information on individual users to which features high-value accounts are utilizing.
Mouse movement and scrolling
Cursor activity from user accounts shows you what users ignore, miss, and pay attention to. These scrolling patterns and skim data also show you how far down users go so you can figure out which key elements they might not be seeing.
In-app/web navigation
Navigation data shows you how users navigate from one page to another, where they spend the most time, and which pages have the highest drop-off rates. You can take this a step further with user path analysis to generate reports on the exact paths that users take to/from specific pages.
User feedback
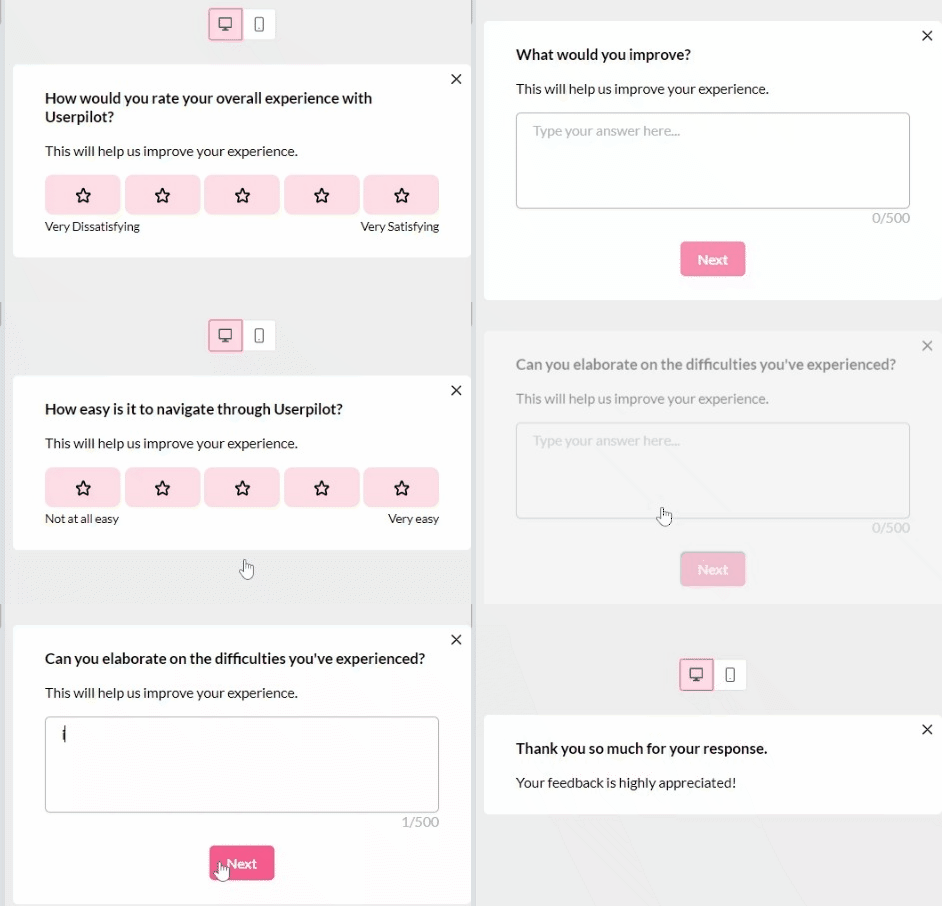
Surveys and feedback widgets can help you collect in-app feedback from users in real time right as they engage with features or reach key moments in their customer journey. Collecting user feedback at the right time will not only help you gain more responses and, therefore, more data, but the data collected will also be more accurate.
How do you analyze user behavior?
Now that you’re familiar with the various data points that make up user behavior analytics, it’s time to look at how you’re supposed to analyze them. The sections below will walk you through five ways to analyze user behavior.
1. Session replays
Session replays, on the other hand, allow you to watch a recording of a visitor’s journey across your website or application. The replay can show you what the user sees, clicks on, and types to give you an idea of what “normal behavior” and anomalous behavior look like in user activity.
2. In-app surveys
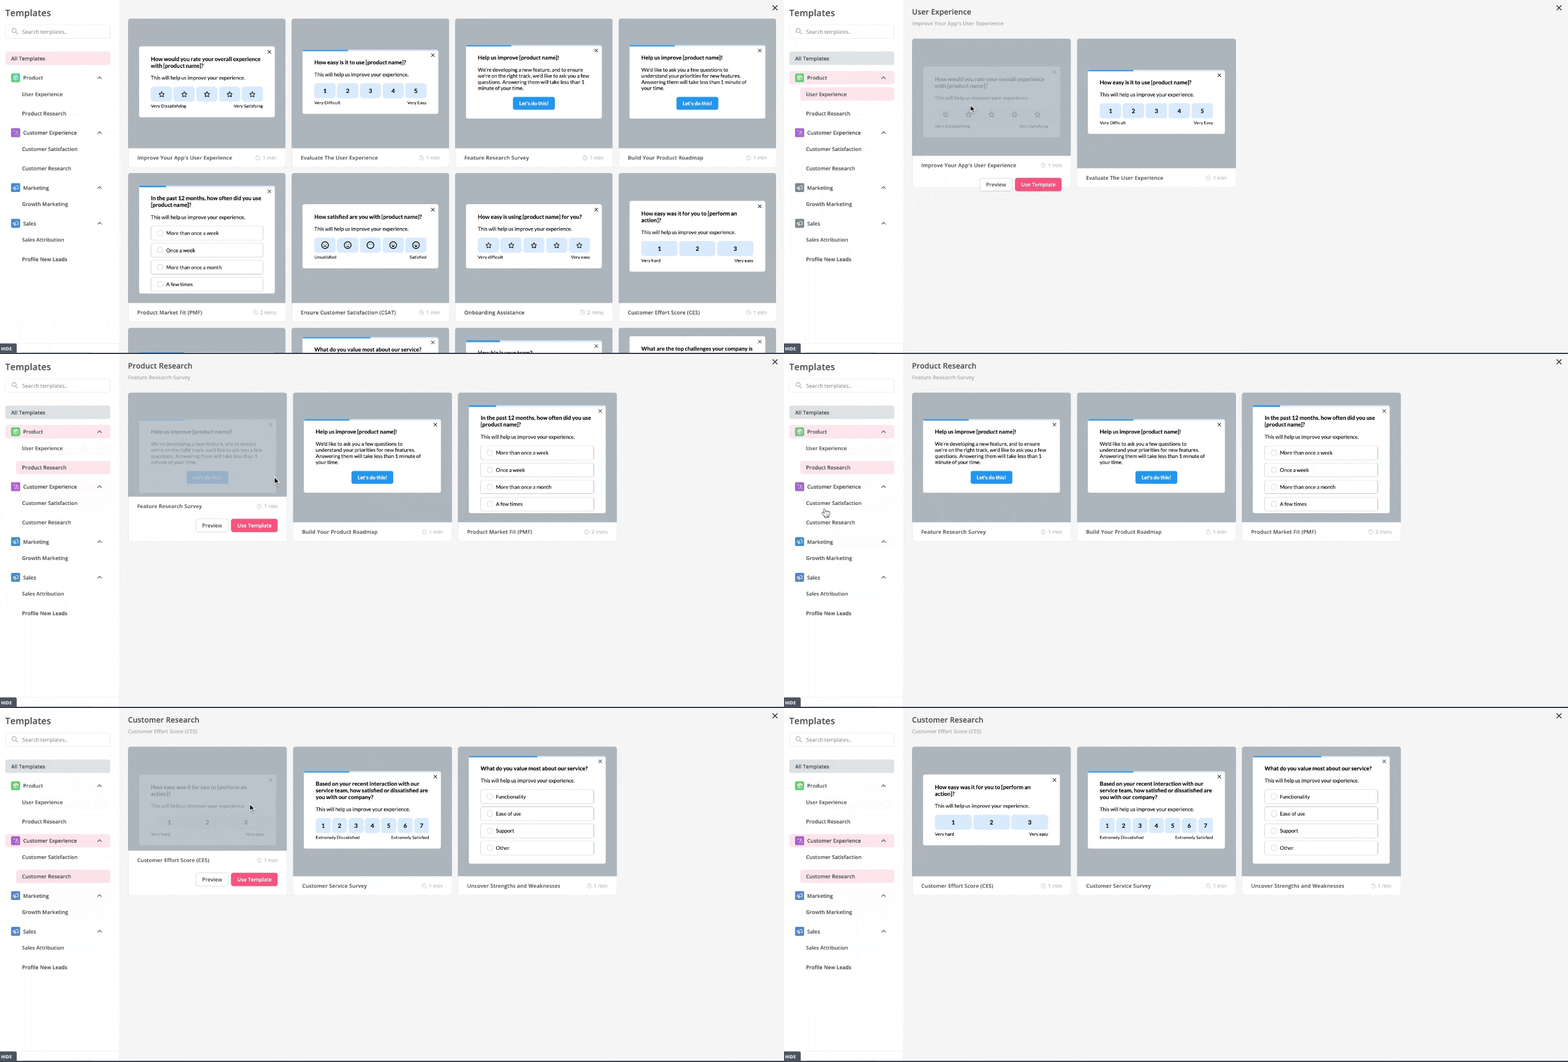
In-app surveys strengthen the voice of the customer (VoC) amongst your users and help you collect direct feedback. There are various types of customer satisfaction surveys for measuring NPS, CSAT, and CES scores — all of which can reveal valuable insights into your user base.
3. User funnel analytics
The user funnel encompasses the entire customer journey from the moment they find out about your product, start using it, and eventually become a brand advocate. Funnel tracking gives you a holistic look into this journey so you can make improvements across every stage.

4. Event tracking
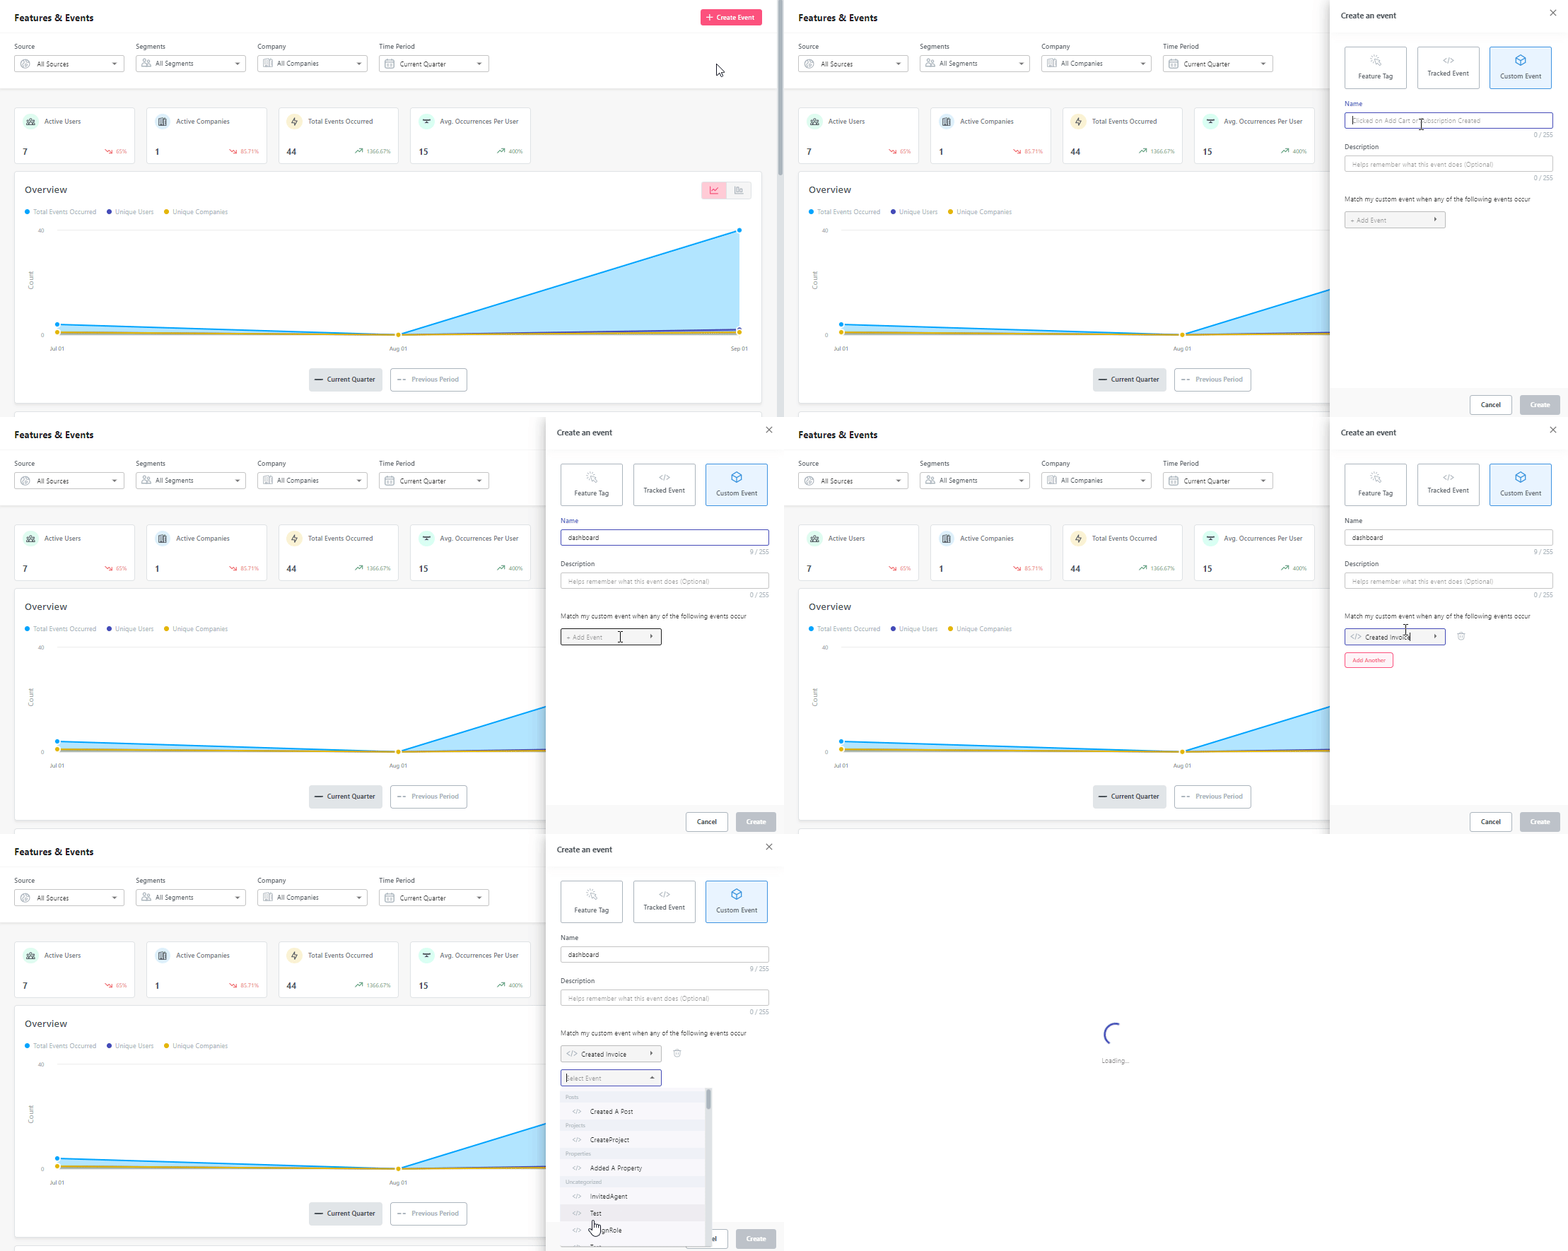
Event tracking helps you monitor key events like account creation, survey submissions, CTA clicks, closing popups, and other behaviors. The more specific events you track, the more nuanced your insights will be.
Our Features & Events dashboard lets you handle all your event management and tracking in one place:
5. A/B testing
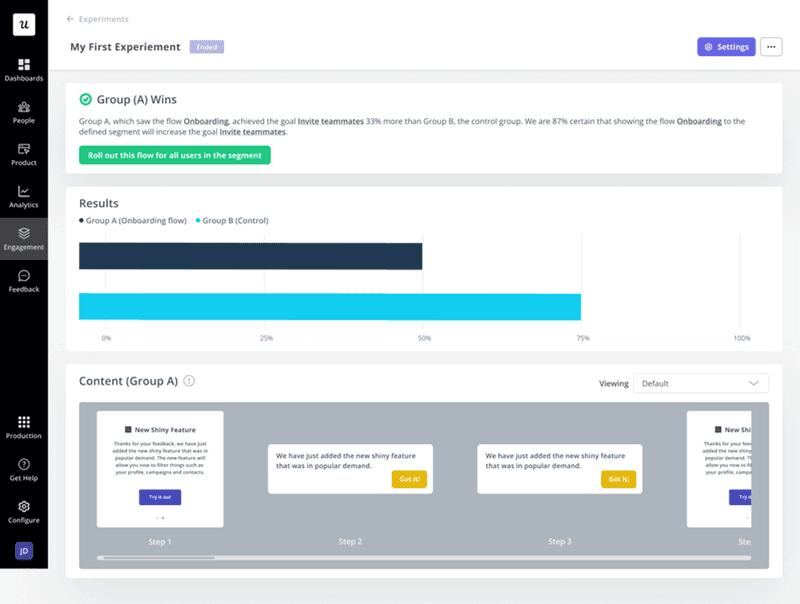
A/B testing helps you send multiple live variants of a page or feature and compare how users react to each variation. As such, frequent A/B testing will help you continuously improve your product based on actual user data rather than assumptions.
Best user behavior analytics tools
Now that you know what to track and how, it’s time to look at the specific behavior analytics tools that you can use to get the job done. Below, we’ll go over three tools that you can add to your tech stack for user behavior analysis.
1. Userpilot
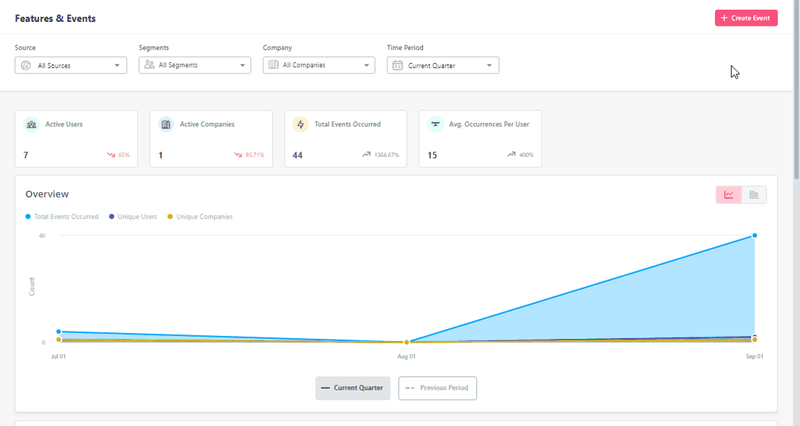
Userpilot is a no-code product growth platform that provides advanced analytics capabilities and multiple report types. You can look at funnel charts, retention tables, cohort analyses, and user paths to get the full picture of how your users behave within the product.
Userpilot extends these capabilities to mobile, allowing you to create intuitive mobile app KPI metrics and dashboards for clear insights into mobile user behavior, engagement, and retention.
You’ll also be able to apply granular filters for different segments and date ranges to hone in on actionable data. Because Userpilot is SOC 2 certified, you know your sensitive data will be safe — whether it’s being gathered, stored, or analyzed by your team.
2. Hotjar
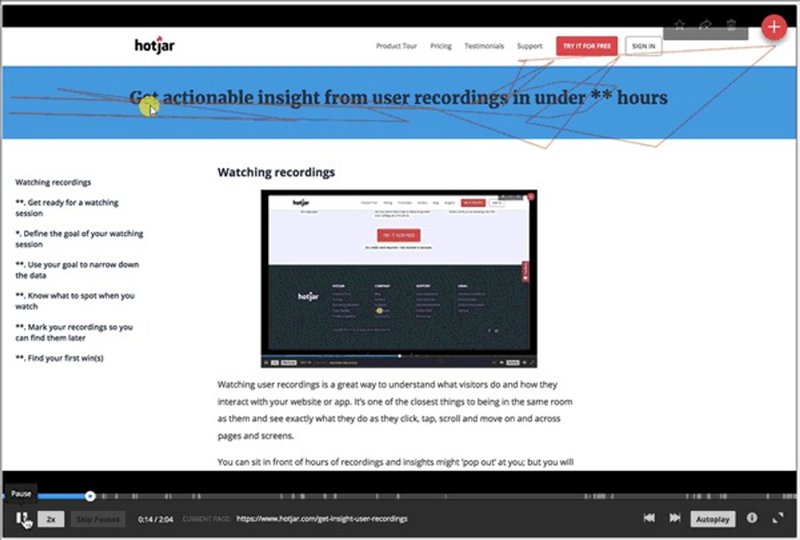
Since its founding in 2014, Hotjar has quickly become the most recognized heatmap tool on the market. In addition to heatmaps, it offers other features like session recordings, conversion funnel reports, form analysis, feedback polls, and surveys.
Note: Hotjar uses a complex pricing model so be sure to identify the features you’ll need; you can choose between the Observe, Ask, or Engage plans. Hotjar also offers custom packages that incorporate features from two different plans.
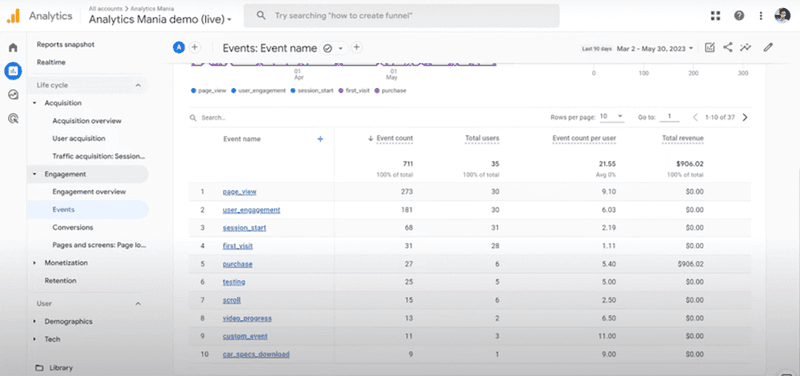
3. Google Analytics
Google Analytics is the gold standard of website analytics and traffic reporting. The free-to-use platform can provide cross-channel insights for both organic traffic and paid advertising campaigns through Google Ads.
In addition to its native reporting capabilities, Google Analytics also integrates with many other platforms to help you sync your traffic data with CRMs or dedicated analytics tools. Last but not least, Google Analytics has data filtering and visualization tools that help you extract insights from numbers.
Conclusion
As you can see, user behavior analytics are extremely important throughout all stages of the customer journey. If you follow the instructions above and use some of our recommended tools, you’ll be gathering user behavior analytics in no time.
If you’re ready to start analyzing user behavior, then it’s time to get your free Userpilot demo today!


![What are Release Notes? Definition, Best Practices & Examples [+ Release Note Template] cover](https://blog-static.userpilot.com/blog/wp-content/uploads/2026/02/what-are-release-notes-definition-best-practices-examples-release-note-template_1b727da8d60969c39acdb09f617eb616_2000-1024x670.png)
