Stop Churn Early with
Actionable Product Usage Analytics

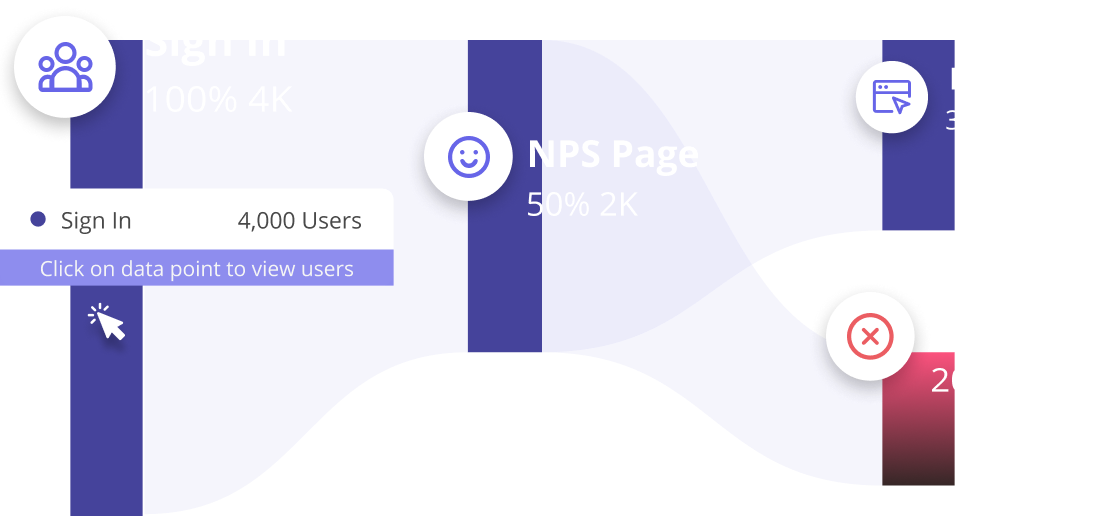
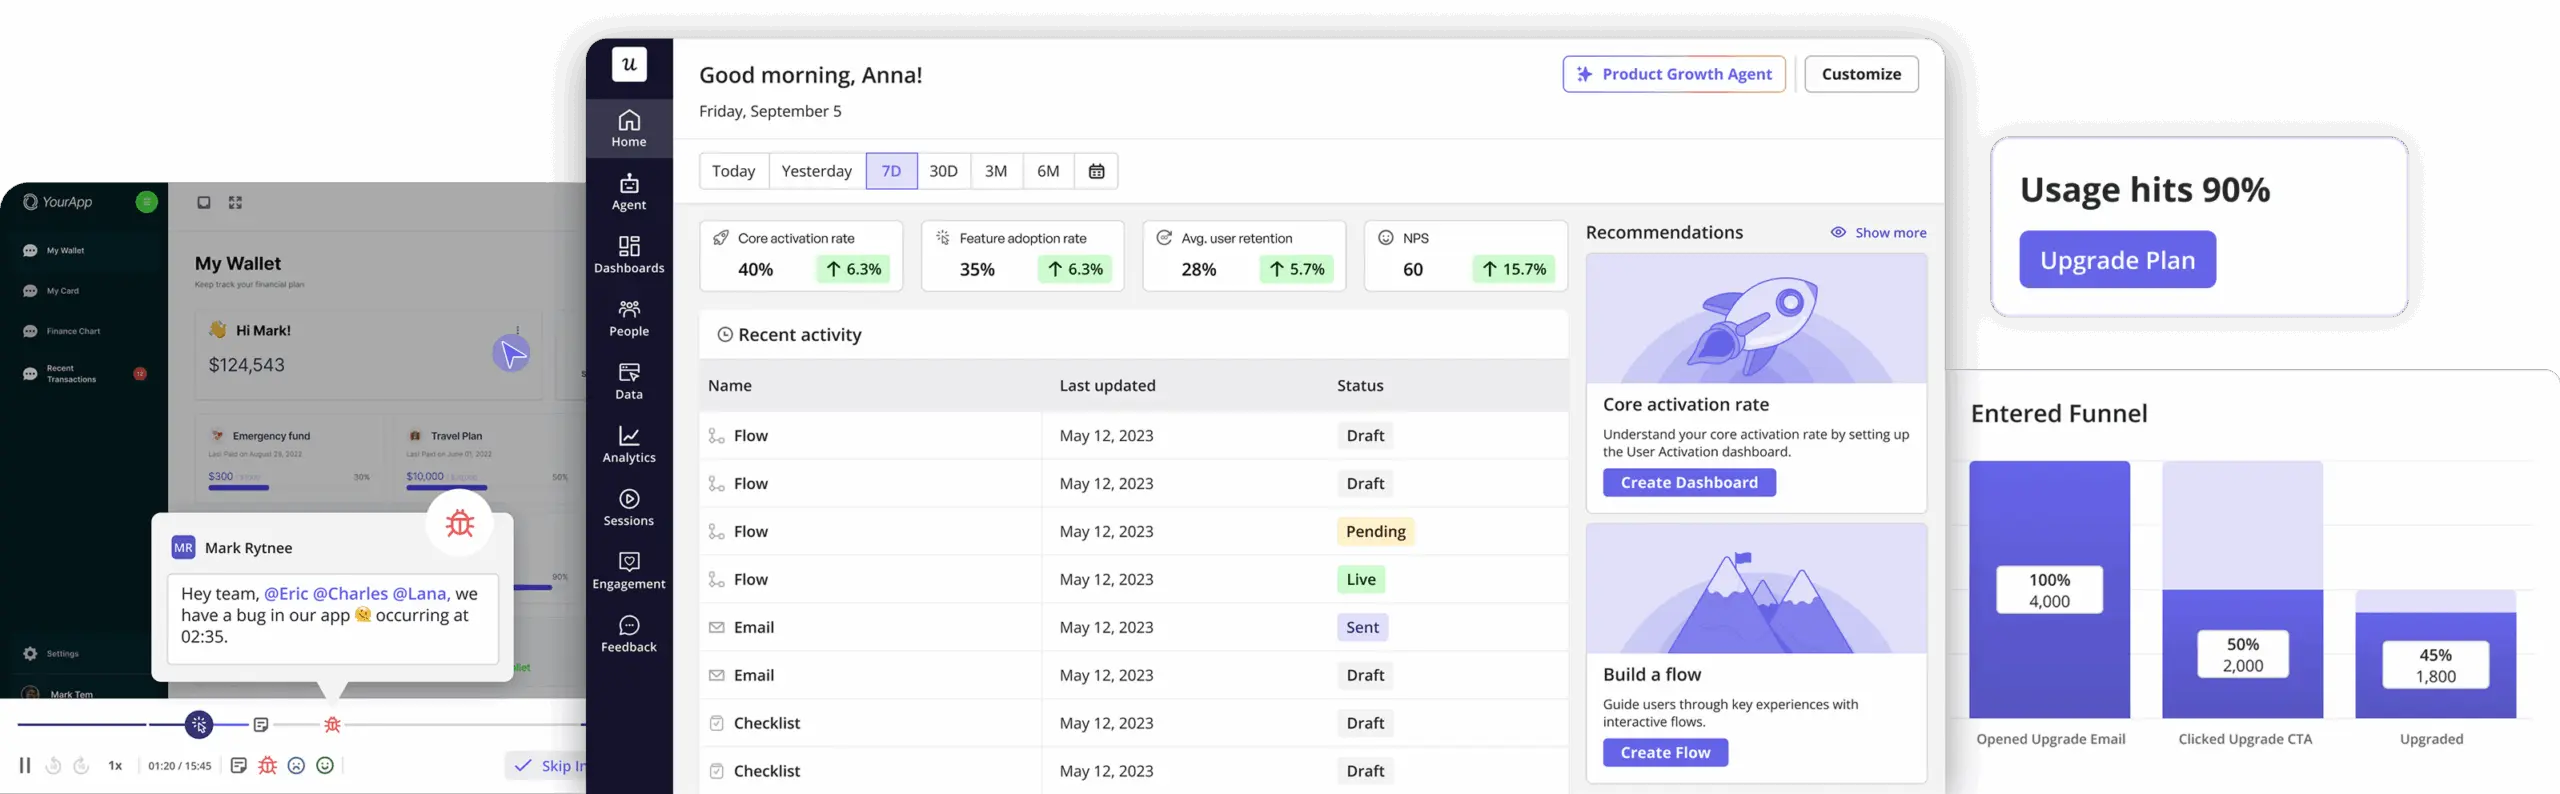
Analyze usage patterns.
Watch exactly why users drop off.
Segment users by behavior.
Recover lost users automatically.

Join 1,000+ companies that are Accelerating Product Growth with Userpilot

Uncover The "Why" Behind User Behavior

Go beyond surface-level metrics. Use session replays and funnels to see exactly where users get stuck and how to save them.

Event Autocapture

Capture every interaction without a single line of code

Forget the “waiting for data” dilemma. Userpilot captures every click, hover, and input from day one, retroactively. Get instant answers to new product questions without chasing developers for tracking scripts.

Trend Analysis

Separate the power features from the shelfware

Stop guessing what users value. Visualize adoption trends over time to identify exactly which features drive engagement and which ones are just gathering dust, so you can prioritize your roadmap with confidence.

Funnel Analysis

Pinpoint exactly where revenue leaks out of your product

See the precise step where users drop off. Isolate the friction points that kill conversion rates and identify the barriers preventing your users from reaching their “Aha!” moment.

Path Analysis

Map the messy reality of how users actually navigate

Users rarely follow your “happy path.” Visualize the actual routes they take to uncover hidden shortcuts, unexpected loops, and the specific navigation flows that lead to successful activation.

Retention Analysis

Decode the specific behaviors that drive long-term loyalty

Go beyond vanity metrics. Use granular cohort analysis to see how specific feature usage correlates with retention over weeks or months, proving exactly which actions lead to higher LTV.

Analytics Dashboards

Turn messy data into a single source of truth

Stop piecing together fragmented spreadsheets. Build custom, real-time dashboards that align your entire organization around the KPIs that matter most, from activation to NRR, in one clear view.

COMING SOON

Session Replay

Don’t just track the drop-off. Watch it happen

Get the qualitative “why” behind the quantitative “what.” Watch high-fidelity replays to see the rage clicks, confusion, and errors that frustrate users, then fix the root cause before they churn.

The Only Analytics Platform Built To Drive Action, Not Just Reports

No-code

Stop fighting for sprint capacity just to get basic data. Tag features, build reports, and launch in-app experiments entirely from your own interface. No coding, no tickets, no delays.

Autocapture events

Eliminate the risk of "forgotten tracking." Userpilot automatically captures every click, hover, and text input from day one, retroactively, so you always have the historical data you need to answer new questions.

Actionable Insights

Don’t just stare at a drop-off chart. Userpilot lets you instantly trigger personalized in-app experiences based on real-time behavior, allowing you to recover at-risk users and drive adoption without switching tools.

FAQs

3 major ways:

  1. All-in-one platform: Unlike other Product Analytics platforms, Userpilot is an all-in-one platform that combines product analytics with user onboarding and in-app surveys. This helps you reduce your tech stack, maintenance headaches, and costs. 
  2. Event auto-capture: Your events are captured automatically, without any coding. You don’t need to chase your developers to track events!
  3. Priced by MAUs, not events: Your invoices are predictable and consistent as it’s easier to predict the number of Monthly Active Users (MAUs) than events. Not just that, our pricing is more affordable than most Product Analytics, especially when you consider the cost of purchasing onboarding and survey tools.

Because it’s far easier to predict the number of monthly active users (MAUs) than events per month. Your invoices remain fairly consistent and you pay less than other tools that charge by events.

Userpilot combines 3 tools: Product Analytics, User Onboarding, and In-app Surveys.
This means you not only track product analytics but also take action with that data, such as by running a survey for dropped-off users in the funnel or creating a better onboarding experience to improve retention.

Trends: Visualize the usage of your features over time 

Funnels: Identify and reduce drop-offs within your product 

Paths: Track user routes before or after any event 

Retention: Track and improve the stickiness of your product

Dashboards: Create dashboards to keep track of key metrics at a glance 

Session Replay: Replay a user’s journey within your app

Besides these reports, you also get auto-capture events, which lets you track your events without any code.

All 3 modules are inter-connected:

For example, you can track data with Product Analytics, and then create a survey or in-app experience to improve the metrics.  

Or the other way: Create a survey or in-app experience and track its performance with Product Analytics.

Some of the KPIs you can improve are: 

  • New user Activation 
  • Feature Adoption 
  • Retention
  • Customer lifetime value 
  • Trial-to-paid conversion rate 
  • Net Promoter Score (NPS)

"I would highly recommend this software to anyone who wants to provide their clients or users with the best product tour experience."

Build The Product Users Never Leave

Start 14 Days Free Trial No credit card required