
Like any form of analytics, product marketing analytics is all about capturing key data and optimizing the customer experience using that data.
Unlike marketing analytics which focuses on replicating marketing successes, product analytics focuses on improving the product.
In this article, we explore some of the differences between both. We also dive deeper into the tools and processes needed for product analytics.
Try Userpilot Now
See Why 1,000+ Teams Choose Userpilot

Summary of product marketing analytics
- Product analytics is a process of collecting, analyzing, and interpreting product usage data.
- Marketing analytics, on the other hand, is a process of collecting and analyzing marketing data.
- Although both help you make data-driven decisions, product analytics focuses on product improvement. It starts tracking data from the moment a user first signs up for your product.
- Conversely, marketing analytics focuses on the acquisition stage. It helps marketing managers identify the best marketing campaigns and channels.
- There are a variety of KPIs for tracking product analytics. Some, such as the feature adoption rate, shine a light on user behavior. Others track product usage data or serve as tools for user journey analysis.
- To take advantage of all this data, you must first dig beyond the numbers by asking more questions. Then, you need to create contextual experiences using that data.
- From advanced analytics to custom surveys, Userpilot helps you collect and understand product data. Book a demo to learn how it can help your business.
How does product marketing analytics primarily differ from traditional marketing analytics?
Which KPI is most critical for a Product Marketing Manager to measure initial value realization?
What is the most effective way to improve feature adoption based on analytics data?
Drive adoption with data-backed product marketing strategies.
Userpilot helps PMMs track usage and trigger in-app messages to boost engagement instantly.
What is product analytics?
Product analytics involves collecting, analyzing, and interpreting data about how customers interact with the product post-purchase.
It tracks customer experience data to enable product managers to improve the product experience, user engagement, and other business outcomes.
What is marketing analytics?
Marketing analytics involves capturing and analyzing data about marketing efforts to improve marketing performance.
This data is sourced from different marketing channels and tracks a variety of metrics, from website traffic to lead generation, conversions, etc.
Product and marketing analytics: Main differences
Both product analytics and marketing analytics help businesses make data-driven decisions that drive growth. Despite being closely related fields, though, they have different focuses.
These differences can be summarized as follows:
Marketing and product analytics focus on different stages of the user journey
Product analytics focuses on the user journey – from when they first open your product to when they churn. For SaaS products, this can mean when your users first sign up for a free trial or a freemium account.
It tracks how users interact with the product, what features they use, and where their engagement drops off.
On the other hand, marketing analytics starts earlier in the user journey. It focuses on the customer acquisition stage, tracking how users become aware of your product, the marketing channels they engage with, and the factors that turn them into customers.
Product analytics helps improve product experiences; marketing analytics helps with acquisition campaign improvement
Product analytics is focused on improving the user experience and increasing product engagement. Its main goal is to improve the retention rate by helping product teams understand how customers interact with the product and reducing friction.
However, marketing analytics focuses on improving marketing campaigns and lowering customer acquisition costs. It helps marketing teams identify the most effective marketing strategies and channels and determine efficient resource allocation methods.
Different teams use product and marketing analytics
Given its focus on in-app experiences, product analytics is a useful tool for both marketing and product teams. This includes product marketing managers (PMMs), product teams (including designers and engineers), and even marketing analysts.
Marketing analytics, however, is more focused on helping businesses to acquire customers. This makes it an ideal tool for marketing teams, marketing managers, sales managers, and other business executives.
Different tools for collecting data
Finally, a product analytics tool helps you to collect and track in-app engagement data. This includes tools like Userpilot, Amplitude, and Mixpanel, which help you collect and analyze in-app data.
On the other hand, marketing analytics requires a tool that scours your website and tracks traffic web analytics, conversion rates, sessions, channels, and more. This includes tools like Google Analytics, HubSpot, etc.
Product analytics KPIs to track
There are many different product analytics KPIs you can track to help you make informed decisions about your product. Here, we broadly categorize these KPIs by the function they serve as analytic tools.
Understand user behavior
This group of KPIs helps you to understand user behavior by giving you insights into how users interact with your product or service. They track user engagement, satisfaction, and retention.
Some examples of KPIs for user behavior include:
- Feature usage: This KPI tracks the percentage of users who use a particular feature. It uses metrics like the feature usage frequency to help you understand which features of your product are more popular and which ones are not used as much.
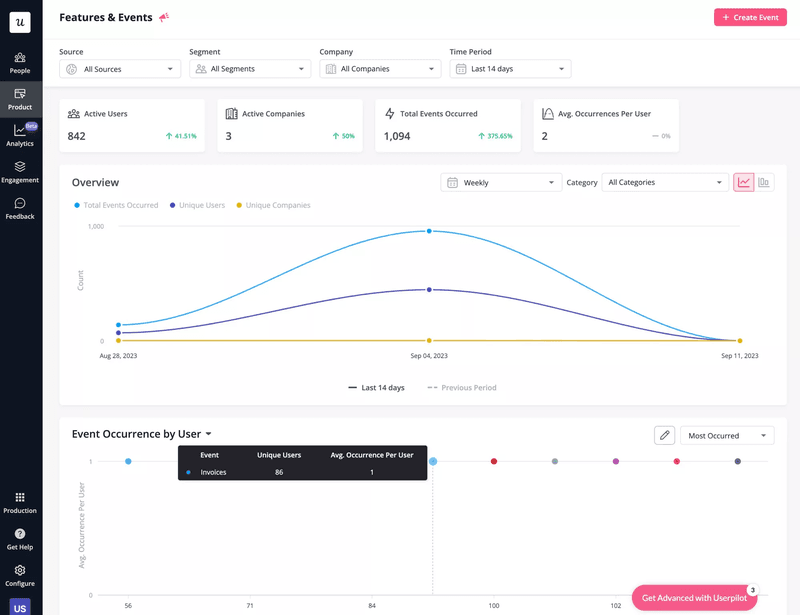
- Feature adoption rate: The feature adoption rate measures the percentage of your product’s active users who actively use a given feature. It essentially tells you how much value your customers gain by using your product’s features.
- Activation rate: This is the percentage of users who have taken a desired action after signing up for your product or service. This action is pre-determined by you to indicate that the user is finding value in the product and will likely continue using it.
- Churn rate: This measures the percentage of customers who stop using your product over a period.
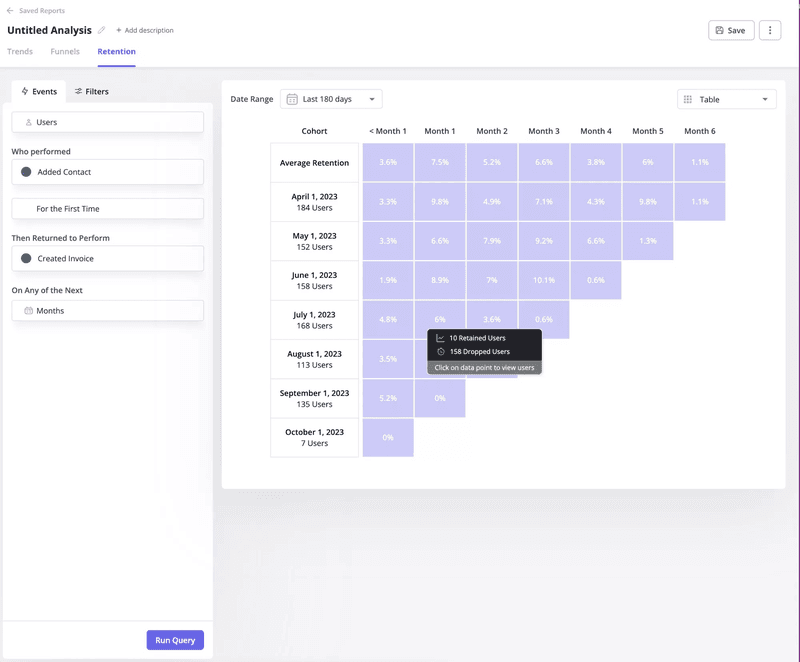
- Retention rate: The retention rate is the opposite of the churn rate. It measures how many users stick with your product over a period and can help you to understand how long customers are using your product. You can use retention tables to better understand churn.
Track product usage data
Next, you may want to determine how many users stick with your product and how long it takes them to adopt it. For this, you’ll need the following KPIs:
- Active users: This metric tracks the number of users who have interacted with your product or service over a given period (month, year, etc.). You can also combine this data with session length data to understand how frequently the product is used and for how long.
- Time to value: The time to value (TTV) is a critical metric that measures how much time it takes new users to derive value from your product.
- DAU/MAU rate: The daily active users (DAU) and monthly active users (MAU) are engagement metrics that measure how sticky your product is and how well the product meets the needs of users. A high DAU, for example, means that users are finding value in your product.
User journey analysis
Finally, some product analytics KPIs and metrics are great for understanding how users travel through your product. Some of these include:
- Funnel analysis: This is a process of tracking and analyzing how users move through the user journey funnel. The funnel begins with their initial interaction and proceeds to the conversion stage (for example, when they subscribe to a paid plan).
- Trends analysis: Trends analysis is a process of identifying and understanding key trends in your product to help you identify product usage patterns.
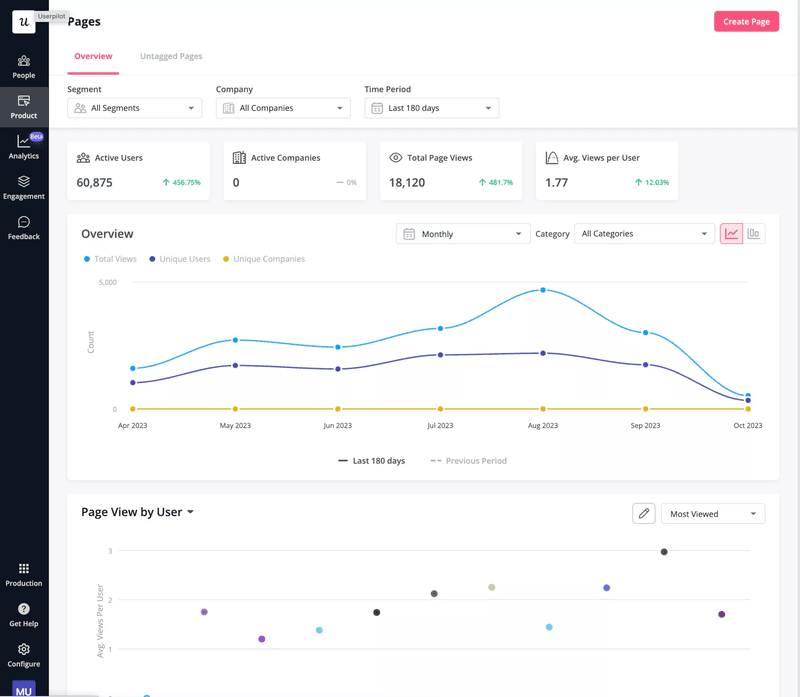
- Pages analysis: Originally used in marketing and sales to analyze a web page and identify its strengths, page analysis is also used in product marketing analytics to understand user engagement with a product/feature page over time.
How to make data-driven decisions using product analytics
Getting the data and tracking your product analytics KPIs is only the first part of the process. Next, you need to put these numbers to good use within your business. This can be done in two ways:
1. Understand the “why” behind the numbers
Product analytics provides a wealth of data about how users are interacting with your product. To be truly useful, you need to look beyond the numbers to understand the story (or, the ‘why’) behind them.
This means asking questions like:
- What pain points are users experiencing?
- How can I improve the user experience?
- What are users trying to achieve?
Collect direct customer feedback to understand why things are the way they are. Dig deeper into the data to identify drop-off points and friction sources within the user journey.
For example, if a feature has a high abandonment rate, it may be because it doesn’t meet users’ needs or because it is difficult to use. Conducting user research can help you better understand the problem and how to fix it.
2. Use product data collected to trigger contextual in-app experiences
You can also use product data to trigger contextual in-app experiences. This means providing users with relevant and timely information using the data you’ve collected.
For example:
- If your product has a high churn rate because users aren’t engaging with key features, you can design a modal and tooltip to enable feature discovery.
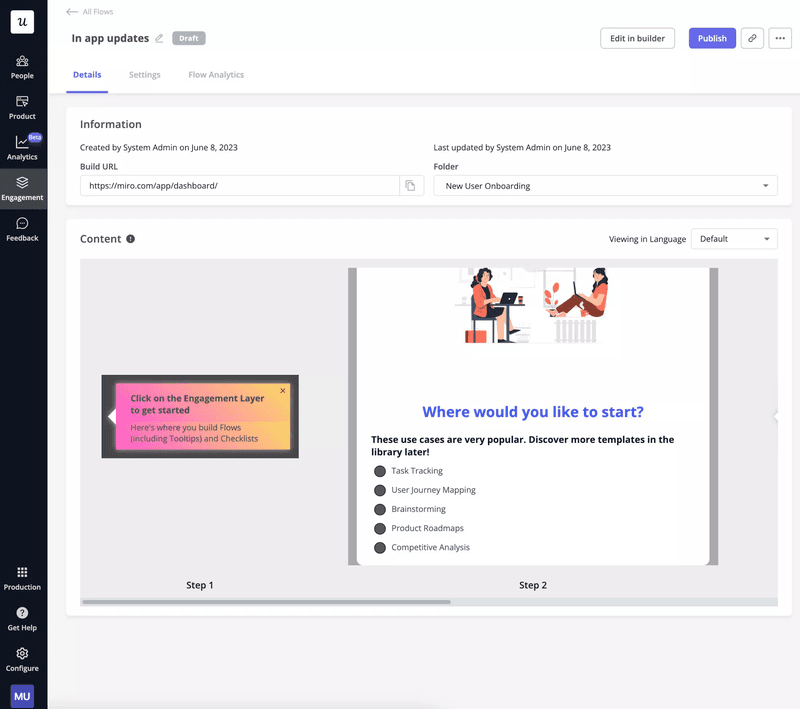
- For a feature with a low feature adoption rate, you can build an interactive walkthrough to guide users who engage with the feature for the first time.
- If you notice that some users struggle with completing certain tasks, you can display a tooltip or a video tutorial to help them.
- If users drop off at the signup stage, simplify the signup flow to remove friction and consider improving the onboarding experience.
In all, your goal should be to drive engagement by creating personalized experiences for your users.
Product analytics tools for PMMs
Now, let’s consider some of the best product analytics tools for a product marketing manager and how they can improve your job.
Userpilot – for collecting actionable data and acting on it
Userpilot is a powerful product growth platform for collecting user behavior data and setting up automated actions based on that data. An invaluable tool for PMMs, it boasts some of the following features:
- Feature tags: Allows you to track feature usage and engagement without writing any code.
- Custom events: Track custom user actions or a combination of actions using a Userpilot code snippet. For example, you can define the series of actions that get a user to the activation point and track how many users complete this “event”.
- Advanced analysis: Create retention tables, conduct in-depth trends and funnel analysis, at build detailed analytics dashboards in a few clicks.
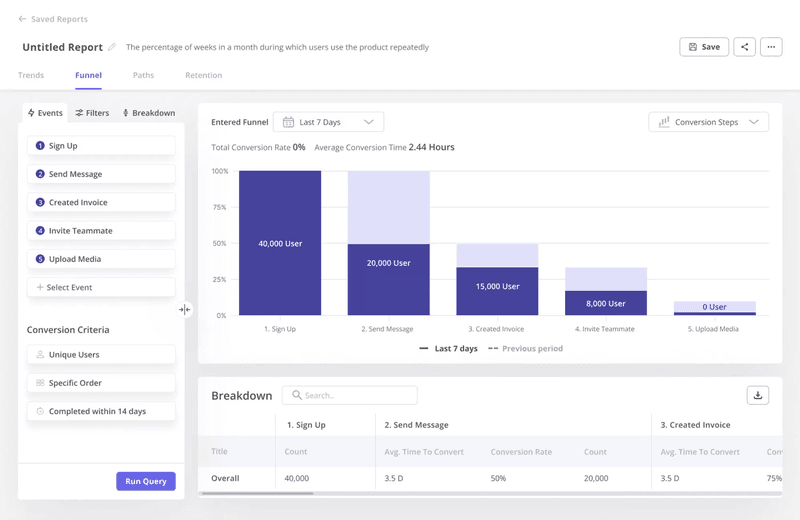
- Act on data: Segment users based on collected data and create personalized in-app experiences for each segment.
- Dig deeper: Collect user feedback to better understand. For example, you can conduct a user survey to determine why a feature has a low engagement rate.
Userpilot features three pricing packages – Starter, Growth, and Enterprise, beginning at $299 per month (billed annually).
Amplitude – for tracking web and mobile product usage
Amplitude is a product analytics tool that helps businesses to better understand user behavior. It is an especially useful tool for SaaS businesses with both mobile and web-based products.
Like Userpilot, it offers retention analysis, user journey analysis and visualization, audience segmentation, and more. This makes it a powerful tool for in-app data collection and analytics.
Unfortunately, Amplitude doesn’t offer any built-in user engagement feature. It also doesn’t allow for the collection of in-app feedback through user surveys.
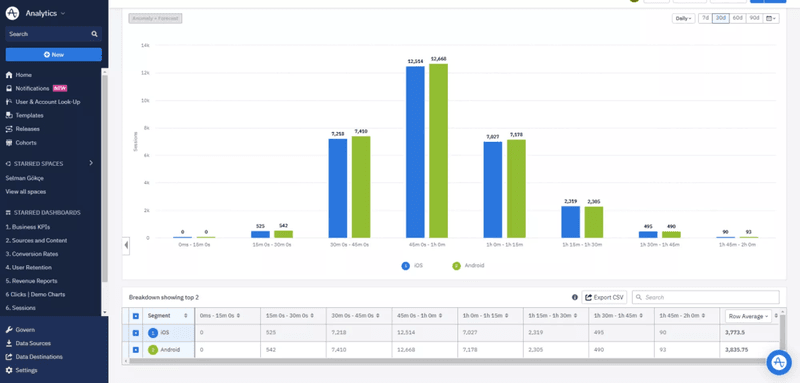
Amplitude offers an exciting range of free plans to get you started with their product at no cost. It also offers paid plans, with the Growth and Enterprise plans, although there’s no clear pricing information on its website.
Conclusion
Product and marketing analytics are different sides of the same coin. Whereas the latter helps improve your marketing campaigns, the former provides a better understanding of your users.
Userpilot offers an array of product analytics tools to help you improve the product experience and drive product growth. Book a demo to learn more!


