![HubSpot Analytics: Understanding its Key Features and Capabilities [+ Better Alternatives] cover](https://blog-static.userpilot.com/blog/wp-content/uploads/2023/11/hubspot-analytics-understanding-its-key-features-and-capabilities-better-alternatives_4fc6fb5646bdff333d32f1f783a4ddf3_2000.png)
HubSpot Analytics: Understanding its Key Features and Capabilities [+ Better Alternatives]
As the name implies, HubSpot is a marketing hub for everything that you do. Those who have already used product analytics software can imagine why a marketing hub for all your pages would be even more in-depth and complex.
In this guide, we’ll go over which analytics HubSpot tracks, what its benefits are, and which features you can use!
Try Userpilot Now
See Why 1,000+ Teams Choose Userpilot

What is HubSpot analytics?
HubSpot’s analytics reports help customers interpret data collected from their sales or marketing efforts. HubSpot’s analytics capabilities focus on helping users explore reports with depth and ease to extract insights on why particular patterns or results occurred within campaigns.
What are the benefits of HubSpot analytics?
The main benefit of HubSpot’s analytics is the detailed marketing reports. You’ll be able to view and filter through data from every stage of the sales funnel without needing to set up custom tracking or write any code. HubSpot reports track all assets, including your website, blog, emails, and social media.
HubSpot analytics – Functionality overview
Now that you know what HubSpot analytics are and which benefits they offer, it’s time to take a closer look at the actual functionality that the platform offers. We’ll walk you through HubSpot’s event tracking, A/B testing, customer segmentation, goal-setting, and reporting dashboards.
Analytics feature #1 – Event tracking
HubSpot’s tracking features help you gather event data on your landing pages or blog posts to determine the effectiveness of your content marketing efforts. There are two main types of events that you can track through HubSpot: traffic and clicks.
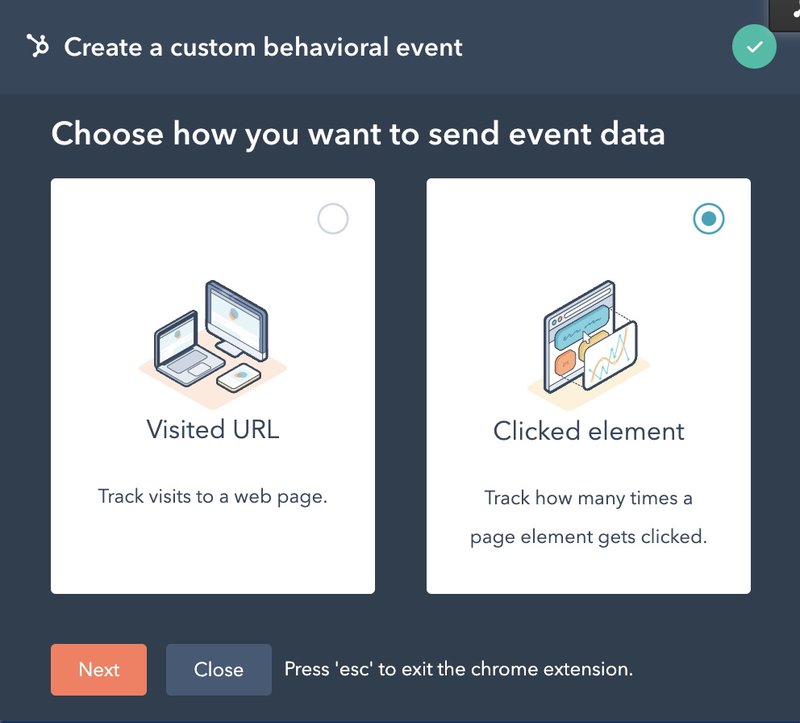
The first will show you the amount of traffic that landing pages on your website get, while the latter helps you measure the exact number of times that a page element is clicked on by a visitor. Both can help you track performance and see how visitors are moving through your website.
Those with the enterprise version of the marketing hub will also be able to conduct revenue attribution. Whenever a contact is tagged with a closed-won deal, all the pages they viewed, videos they watched, and events they attended will receive partial credit for driving the revenue.
Analytics feature #2 – A/B testing
Both the Professional and Enterprise plans of the marketing hub let users conduct A/B testing to test different versions of a particular page on your website.
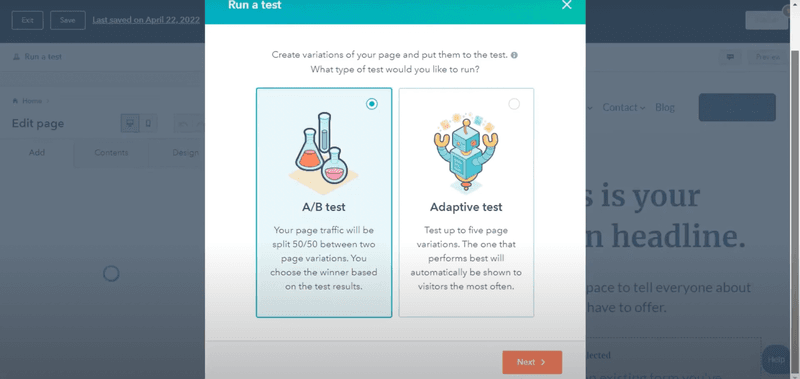
Note: Half of all website visitors will variant A, while the other half will see variant B.
Once an A/B test ends, you’ll have the option of either choosing a winner — based on which variant performed better on your website or campaigns — or rerun a particular variation to gather more data from additional traffic.
Choosing a winner will set that variant as the only live version and turn the other variation into a draft.
Analytics feature #3 – Customer segmentation
HubSpot’s list tools help you create a custom list of contacts, deals, companies, or other objects using various characteristics and values (such as activities). For the purposes of customer segmentation, users have the option of choosing criteria for each list or manually adding in records.
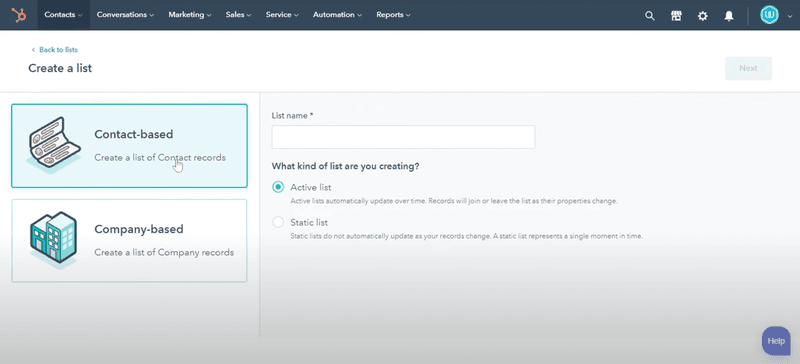
HubSpot lets you create two types of lists:
- Active lists. Active lists are automatically updated with new contacts whenever a person, deal, or company meets the criteria set by the user. When a contact no longer meets the criteria of the active list, they will be removed from its records.
- Static lists. Static lists include records that met the specified criteria at the point when the list was saved. Static lists don’t automatically update records, which means existing records won’t be removed even if they no longer meet the criteria, and new records will not be synced either.
Once you’ve created your HubSpot lists, you’ll be able to measure performance on a list level. These reports could include various metrics such as how the size of the list has changed over time, the engagement level of contacts on a list, and the activity of the contacts on its records.
Analytics feature #4 – Goals
Goals are crucial for extracting actionable insights from an analytics dashboard. Unlike the previous functions, goals are only available to subscribers with access to the sales or service (rather than marketing) hubs.
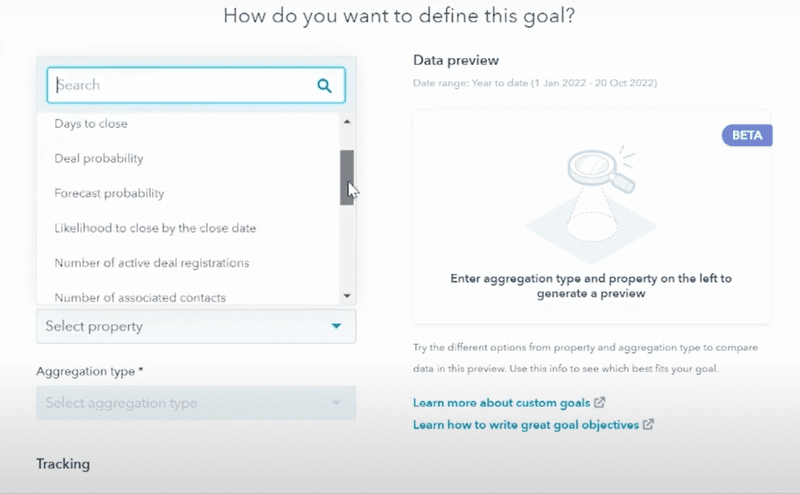
HubSpot lets you create goals for individual users or entire teams based on countless properties. In addition to tracking your custom goals, you’ll also be able to filter through them to see how progress towards each objective changes over time (based on the metrics and criteria you’ve defined).
The metrics that you can use to measure your goals will vary depending on which plan you’re on. If you’re on the Starter plan for the sales hub or Professional plan of the service hbu then you’ll only be able to set revenue as your goal measure.
On the other hand, those with the enterprise versions of the sales or service hub can track the number of calls logged, deals created, and meetings booked. You’ll also be able to see support performance data like the average resolution time for tickets, along with response times and the number of tickets closed.
Analytics feature #5 – Reports and dashboards
Last but not least, traffic and revenue are the two main performance metrics that you can track using HubSpot reports.
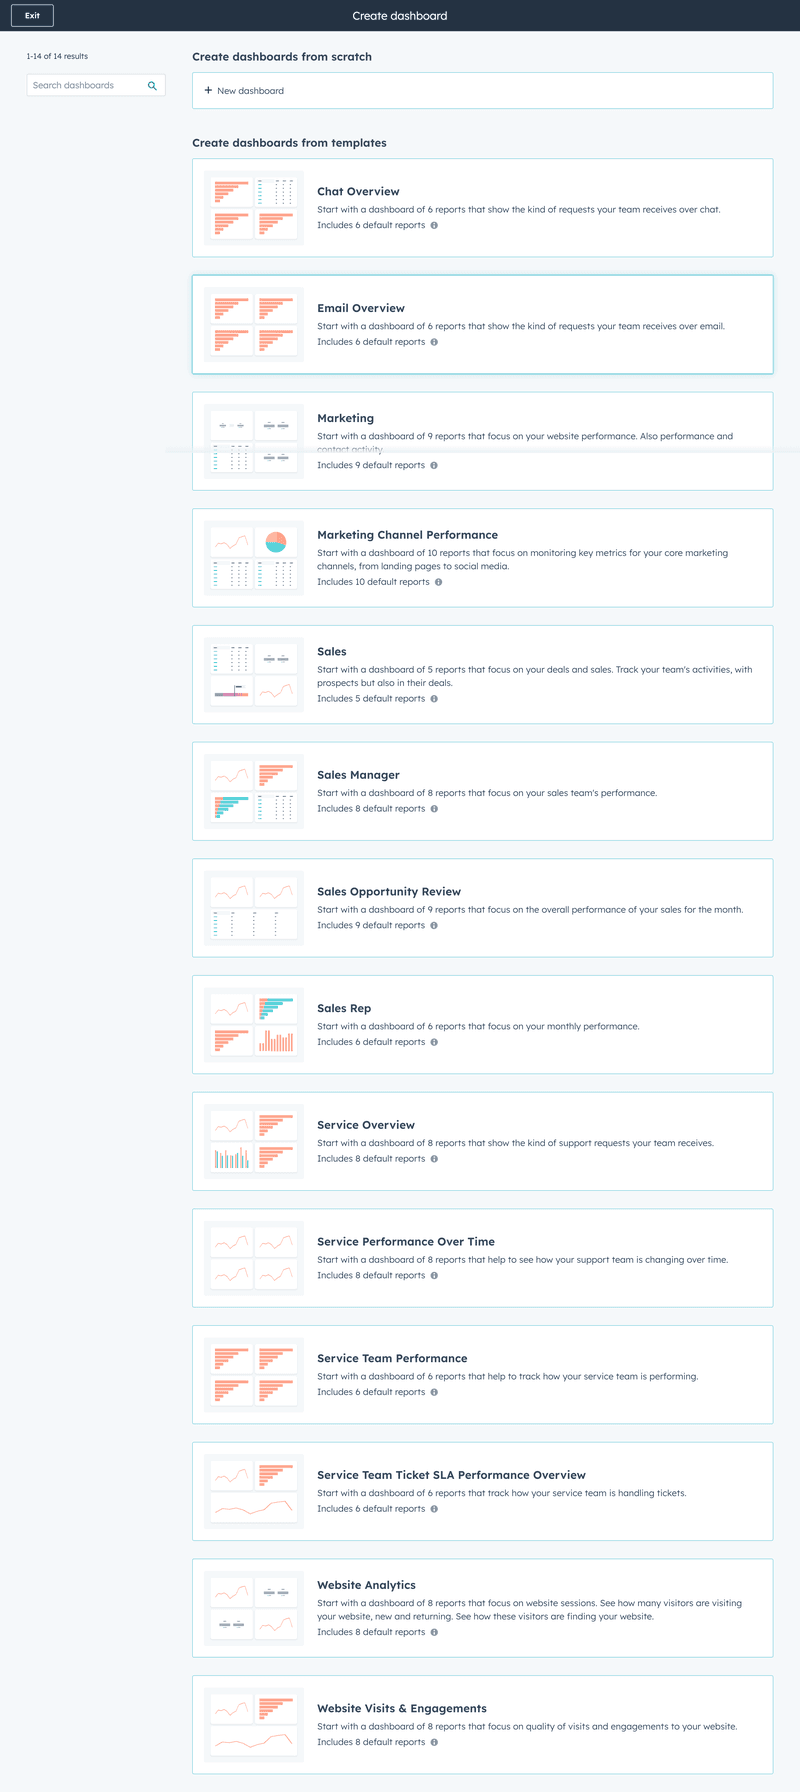
Revenue metrics center around how much money is being generated from your campaign, as well as the total number of deals that you’ve closed (or are forecasted to close) for a specific period. You’ll also be able to filter through revenue based on source or see if the number of deals closed aligns with goals.
As for traffic data, you’ll be able to see the number of page views or sessions on your site for a given period.
Note: Your HubSpot reports may not always match the website data you’re seeing in Google Analytics (especially if you’re getting in-app traffic to pages that HubSpot is not tracking or actively excluding).
What is the difference between Google Analytics and HubSpot Analytics?
Google Analytics and HubSpot both collect the same data but display metrics differently. HubSpot makes it easier to analyze contacts and interpret customer data, while Google Analytics helps you track in-depth performance data from your website pages (or traffic from organic search).
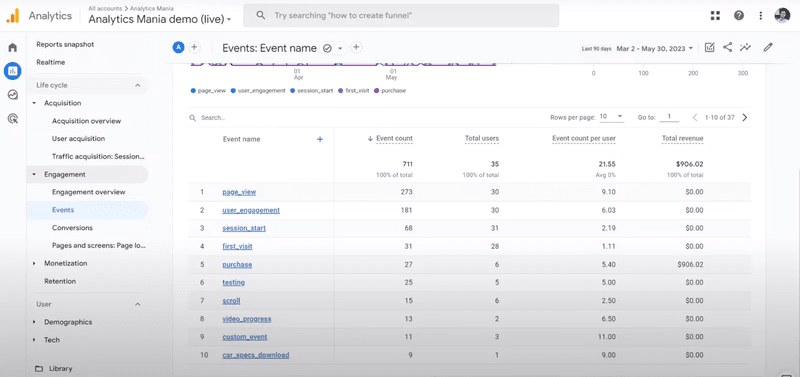
Google Analytics also collects more data points than HubSpot and has more flexible timescale settings to help you conduct before/after analyses of your website performance. Last but not least, Google Analytics is a free standalone product, while HubSpot is a paid CRM, marketing, and automation suite.
How do you integrate HubSpot analytics?
HubSpot has over 1,000 third-party applications that you can integrate with your marketing hub or CRM to automate workflows and sync data between tools. It even integrates with Google Calendar, Outlook, Office 365, and Calendly to help you sync sales meetings with your HubSpot CRM’s native calendar.
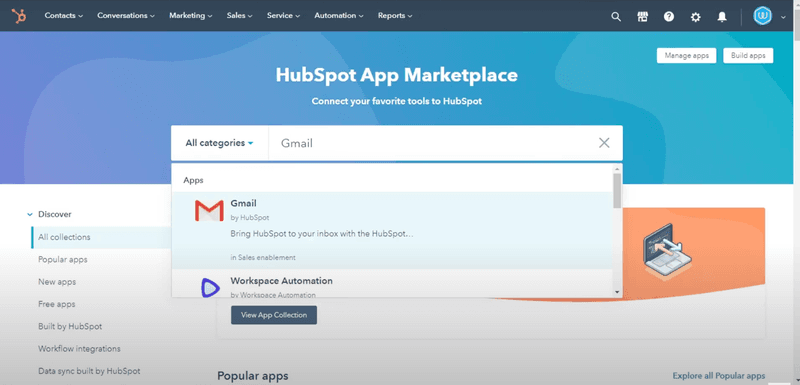
Here’s how to integrate HubSpot analytics:
- Sign into your HubSpot account
- Go to the App Marketplace and find an app
- Review the application details
- Install the application
Note: Users may require admin or special permission to connect apps
If you’d like to combine your CRM data and product analytics, then you should check out the Userpilot-HubSpot integration. This is a two-way integration which means you’ll be able to send Userpilot metrics to HubSpot and vice versa.
Pros and cons of HubSpot Analytics
Like any software (especially a marketing suite as complex as this) there are bound to be both pros and cons. Let’s take a brief look at the most notable benefits and drawbacks of using HubSpot as your analytics platform.
Pros of HubSpot Analytics
- All-in-one platform. HubSpot is a full-suite solution that helps you manage your marketing, sales, and customer support efforts on a single platform. This also means you’ll be able to store data from all departments in one place (and avoid data silos as a result).
- Analytics reporting. HubSpot’s wide range of analytics data and reporting templates helps you track a broad range of performance metrics while still focusing each report on the KPIs that matter most to your business.
- Third-party integrations. The App Marketplace gives you access to 1,000+ third-party integrations that you can connect to your HubSpot account. This makes it easy to sync data, schedule meetings, and automate certain workflows.
Cons of HubSpot Analytics
- Overwhelming data. Because HubSpot is an all-in-one platform that reports on dozens of different metrics, it can be hard to figure out which data you should be paying attention to. This can lead to an overwhelming experience and put some users in a state of analysis paralysis.
- Engagement blindspot. HubSpot is a sales and marketing automation tool which is why it lacks the ability to track customer engagement. This is unfortunate since tracking customer engagement and behavior are both essential to gathering actionable insights out of your data.
- Expensive pricing. HubSpot’s pricing model can get expensive fast — especially because there’s no option to subscribe to the analytics tools as a standalone product. If you want an individual tool with advanced analytics capabilities, then get a free Userpilot demo to see if it’s right for you.
HubSpot Analytics pricing
HubSpot offers three paid plans ranging from $20/month to $3,600/month.
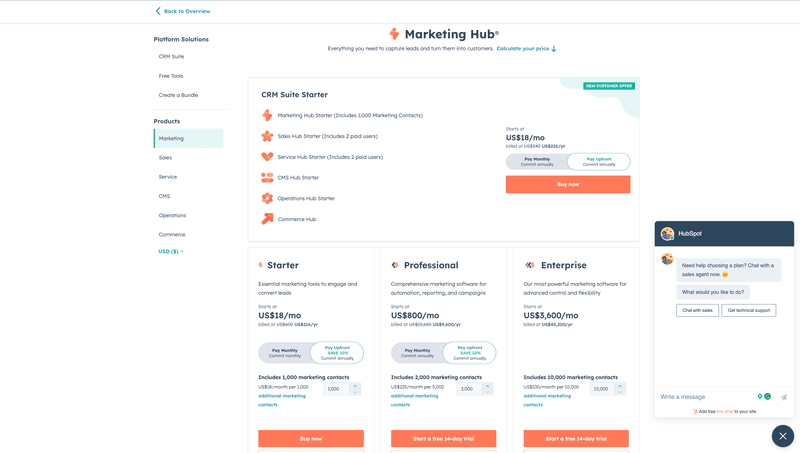
The Starter plan costs $20/month, the Professional plan costs $890/month, and the Enterprise plan costs $3,600/month. All plans offer a 10% discount if you pay annually. You can also use HubSpot’s 14-day free trial to see if the software is for you before committing to a paid subscription.
Userpilot: A better alternative than HubSpot Analytics
Userpilot is a product adoption platform with advanced analytics features. Furthermore, its analytics dashboards and reports focus on the most important metrics that actually move the needle for your product growth objectives.
Here’s a quick overview of Userpilot’s functionality and pricing:
Userpilot analytics functionality
Userpilot analytics features:
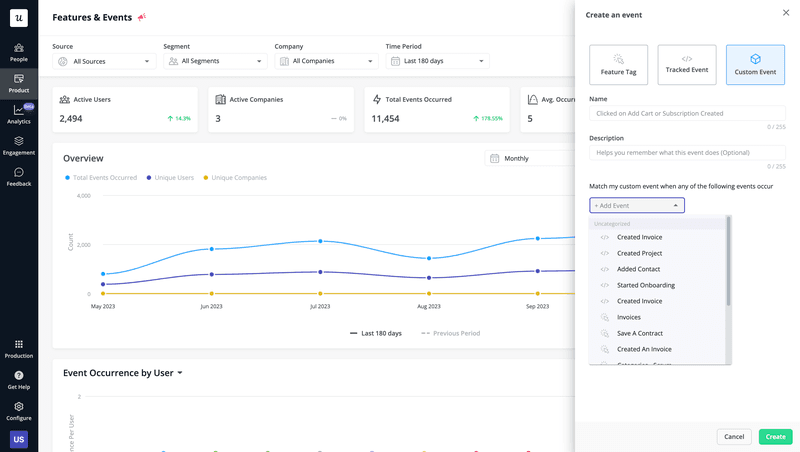
- Feature tagging. Feature tagging lets you track feature engagement and custom events to get a clearer view of customer behavioral data. You can use the no-code tagger to add tags to features or create custom events that combine multiple user actions.
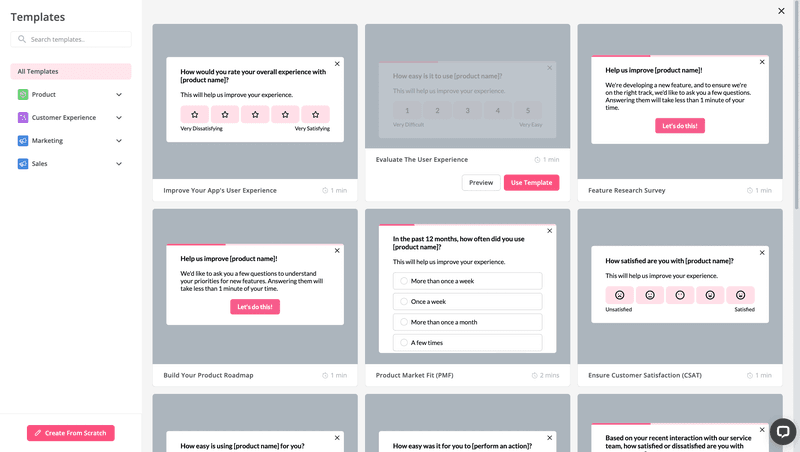
- In-app surveys. Userpilot lets you build in-app surveys for collecting product feedback or conducting sentiment analysis. There are 14 different templates that you can use to collect responses from users and create a more personalized customer experience as a result.
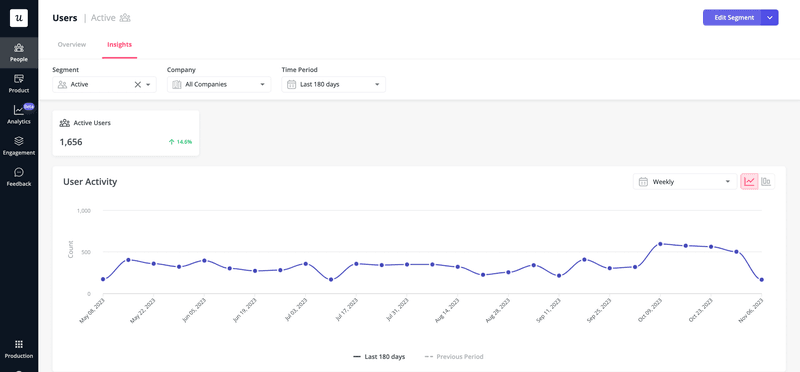
- Users dashboard. The Users dashboard shows you all customer insights in one place and lets you build custom segments so you can filter through data for a specific group of customers. You’ll also be able to filter by company or date range to narrow down the most actionable user analytics.
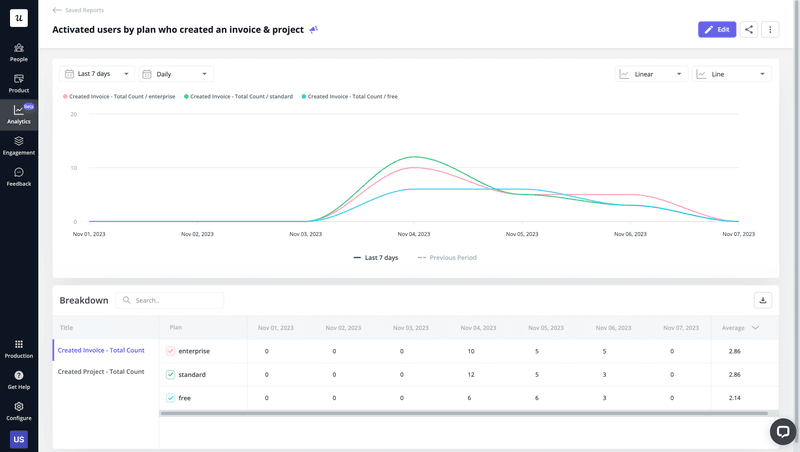
- Analytics reports. Userpilot analytics can be visualized using a variety of different report types. You can conduct funnel analysis to identify friction points, generate trend reports to see how metrics change over time, or use retention tables to conduct cohort analysis.
Userpilot pricing
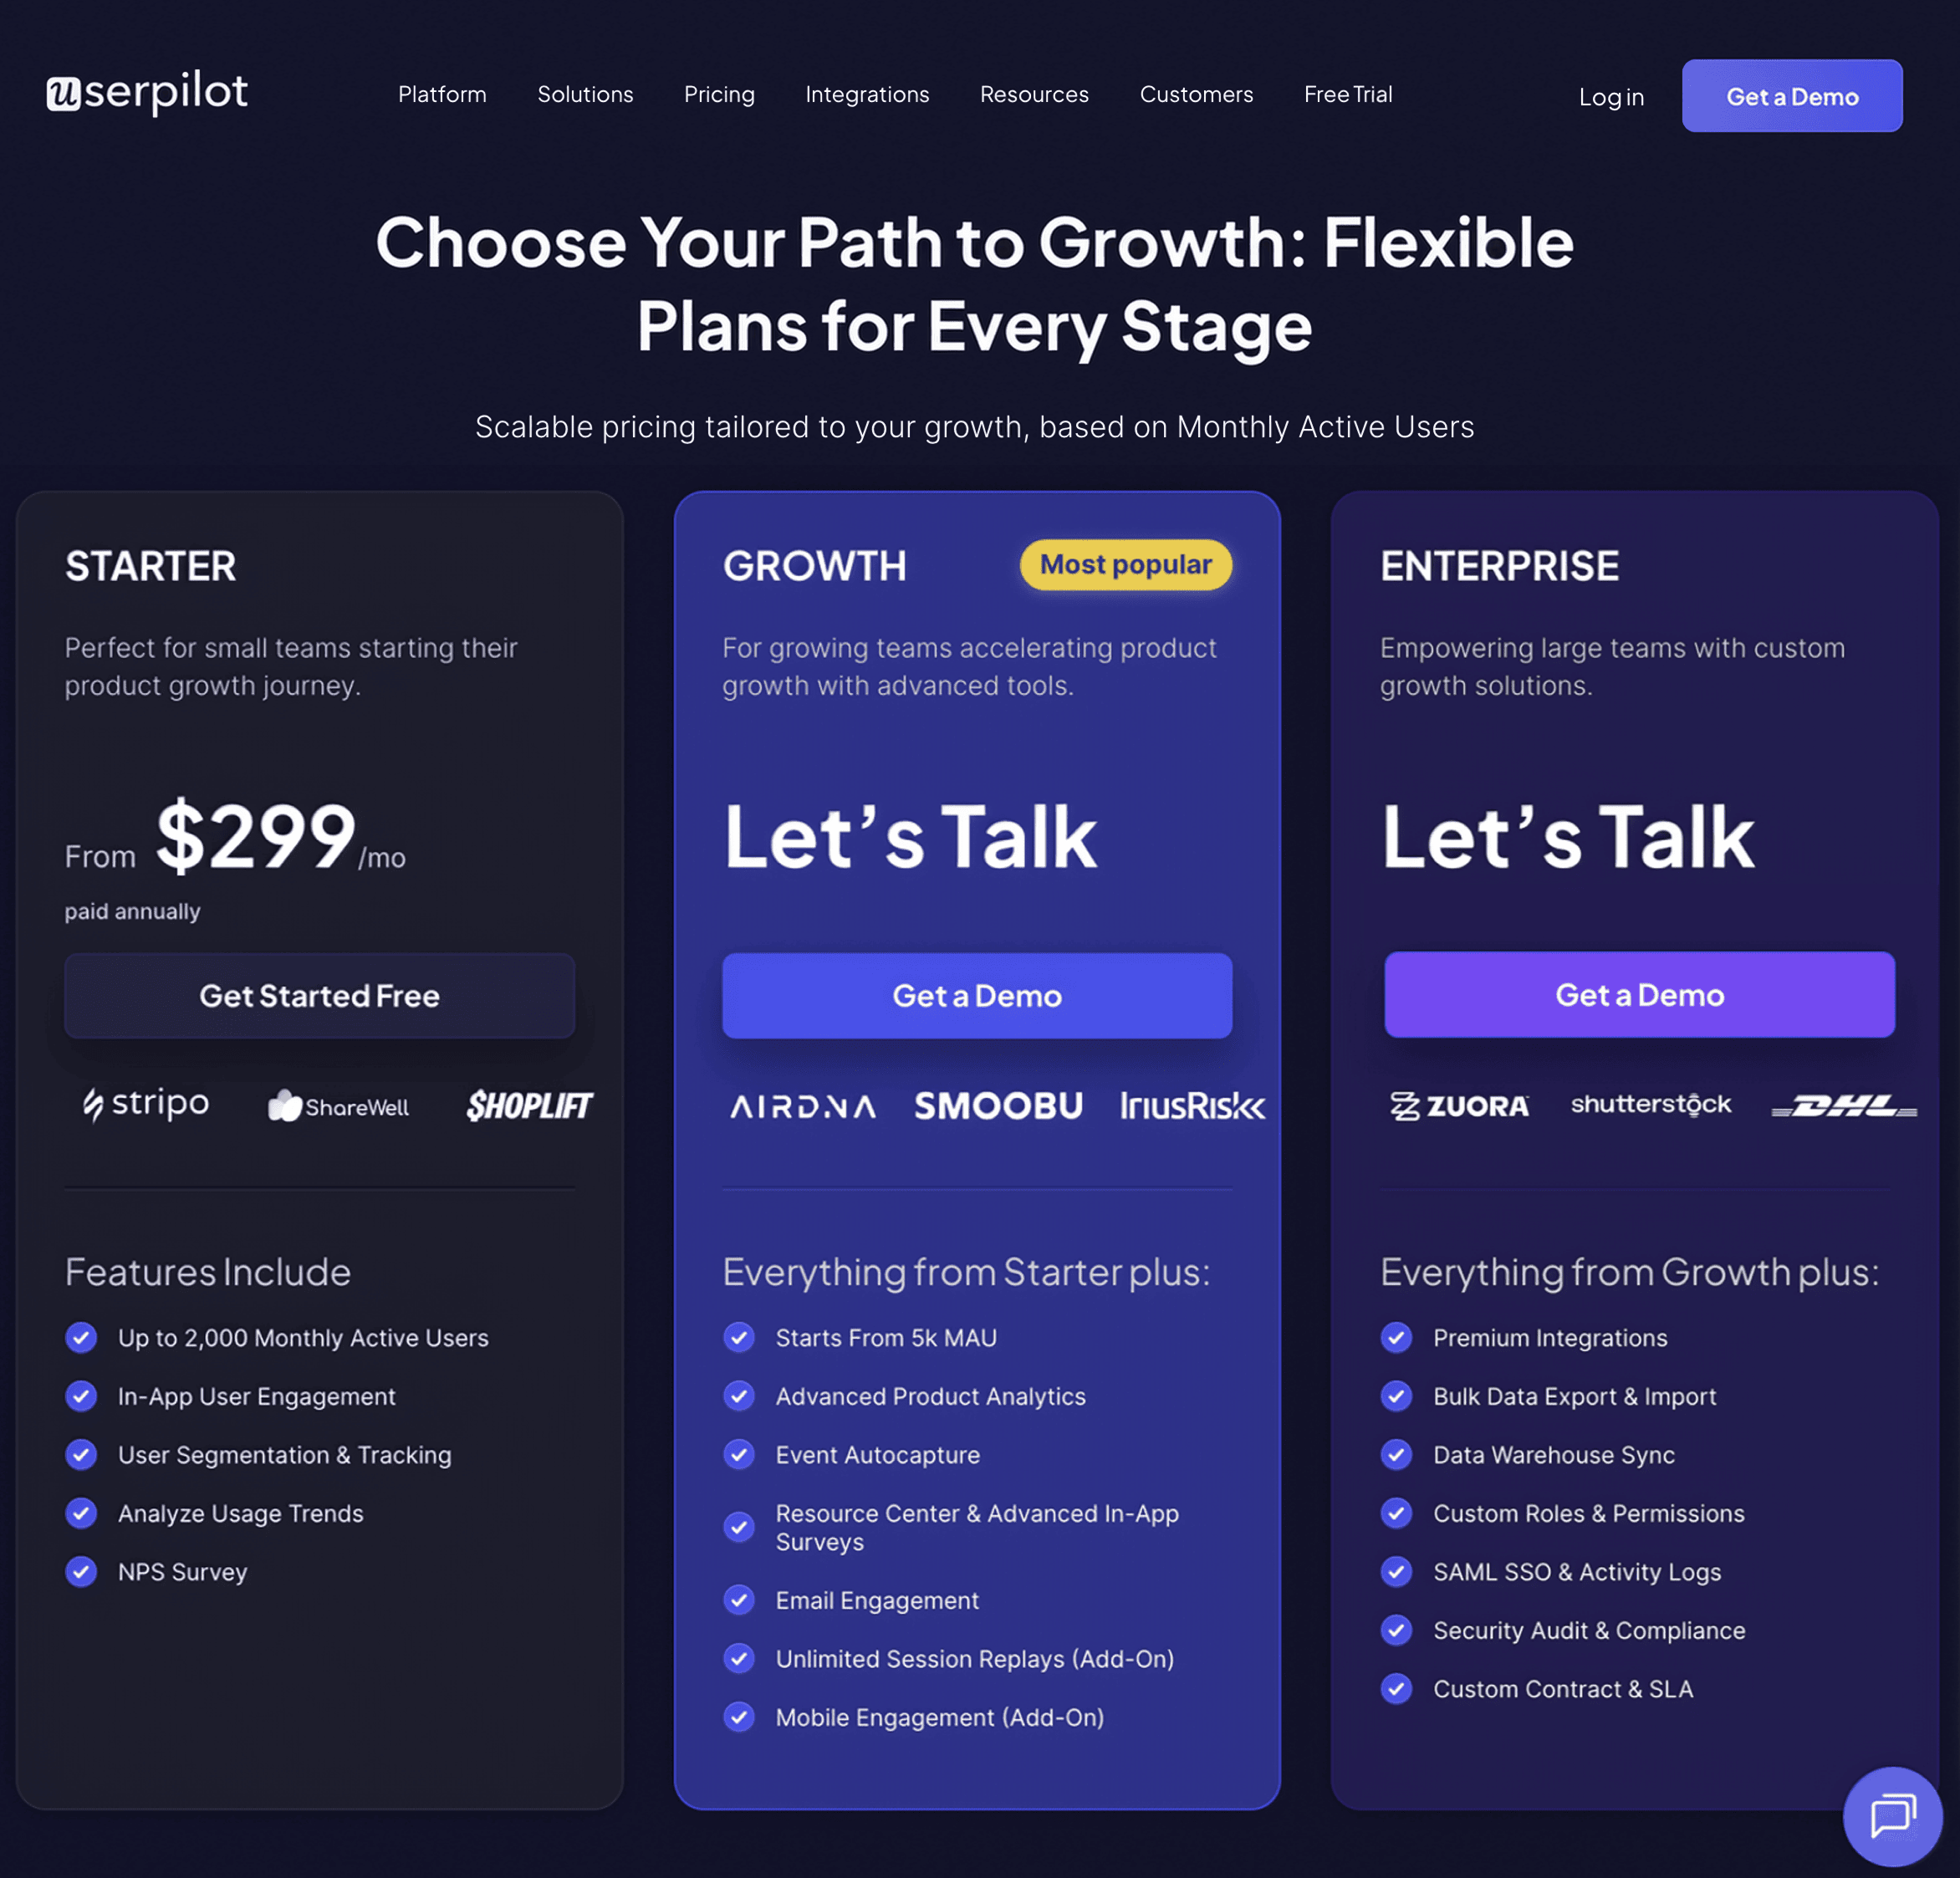
Userpilot has three paid tiers.
The Starter plan costs $299/month (billed annually), the Growth plan and the Enterprise plan use quote-based pricing.
Conclusion
As you can see, HubSpot lets you combine multiple data types from various sources and departments to get a holistic view of your marketing campaigns. That said, it lacks engagement and product analytics because it was built with marketing automation (rather than product growth) as its use case.
If product growth and advanced analytics are what you need then it’s time to get your free Userpilot demo today!


