Curious how customer churn data can improve customer retention? You’re in the right place! Customer attrition is one of the most vital metrics for SaaS companies to keep an eye on. In this article, you’ll learn:
- How to conduct churn analysis
- Formulas to measure customer churn rate
- Tactics for predicting churn and retaining customers
Keep reading to get actionable insights and fuel your product growth!
Try Userpilot Now
See Why 1,000+ Teams Choose Userpilot

What is customer churn data?
Customer churn data tells you how many customers have stopped using your product or service over a period of time.
SaaS companies analyze churn data across different user journey stages to spot and address friction points. This helps maintain a healthy business and increase customer lifetime value.
What are the different types of churn?
You can categorize customer churn into two groups: voluntary and involuntary. Let’s look at the differences between them.
Involuntary churn
This type of churn happens when a customer is unable to continue using your product or service due to external factors that are out of the customer’s control. Those factors are mainly connected with payment process failures and expired credit cards.
To reduce involuntary churn, you can proactively reach out to users in-app and alert them about their payment or account status.
Voluntary churn
Voluntary churn occurs because customers are no longer happy with the product or service. The reasons may vary from the lack of features to customer service issues or a competitor switch.
Voluntary churn requires a thorough examination to locate problematic areas and act accordingly. The process usually starts with churn analysis. Let’s learn more about that.
What is customer churn analysis?
Customer churn analysis is the process when you investigate why customers are leaving your product and what could make them stay to improve user retention. This analysis comprises measuring and interpreting data about customer attrition.
It helps you identify trends and patterns of drop-offs in the customer journey so you can take the necessary steps for reducing customer churn.
Why is churn analysis important?
You’ve probably heard that customer acquisition costs at least double the cost of customer retention. From a business perspective, it’s vital to keep a churn rate low to grow in income thanks to existing customers. On top of that, churn analysis contributes to the following.
Improve customer retention
Identifying and solving the issues your churned customers face can help you improve retention, which leads to increased MRR and customer loyalty. Companies also turn to proactive engagement to increase retention alongside customer lifetime value.
Identify patterns in customer behavior
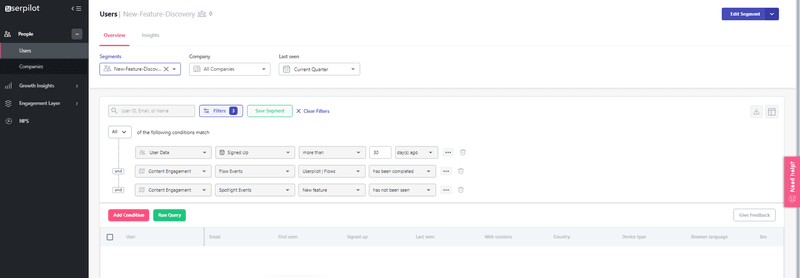
Customer churn analytics help you spot similar behavioral patterns among churned customers. Segment users by shared characteristics and proactively reach out to them to avert churn. Let’s learn from an example.
Imagine that you’ve already discovered that users who engaged with feature A after 1 month of signing up exhibit high customer churn rates. The reason behind this can be not knowing how to use the feature.
So you can build this segment with Userpilot and reach out to these at-risk users with in-app flows showcasing how to use that specific feature. This way, you’re likely to retain customers.
Prevent customer churn
Predictive churn analytics enables product teams to find friction points and customer pain points that contribute to drop-offs in the customer journey. Employ this knowledge to enhance your product and meet customers’ needs, therefore, reducing churn.
How do you measure churn?
There are two ways to gauge customer churn rate: simplified (or unified) and Gross MRR churn. We’ve described both scenarios, so you can select the method that fits your needs.
Calculate churn rate
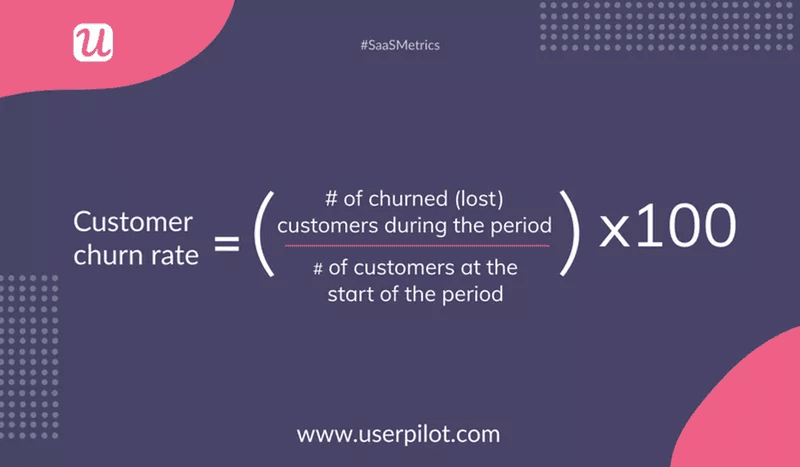
To calculate the customer churn rate in SaaS, take the number of customers who have left during a certain period and divide that by the total number of customers at the start of that period. Then, multiply the value by 100. The churn rate usually is expressed as a percentage.
For example, if you started with 100 customers in January and 10 of them left in March, then your churn rate is 10%, which is considered a good churn rate for SaaS. In turn, small SaaS companies typically aim for a 5-7% churn rate, while enterprises need to keep their churn rates below 5%.
It’s important to note that customer churn rate can be calculated for different periods of time, such as monthly, quarterly, or yearly.
Calculate the Gross MRR churn rate
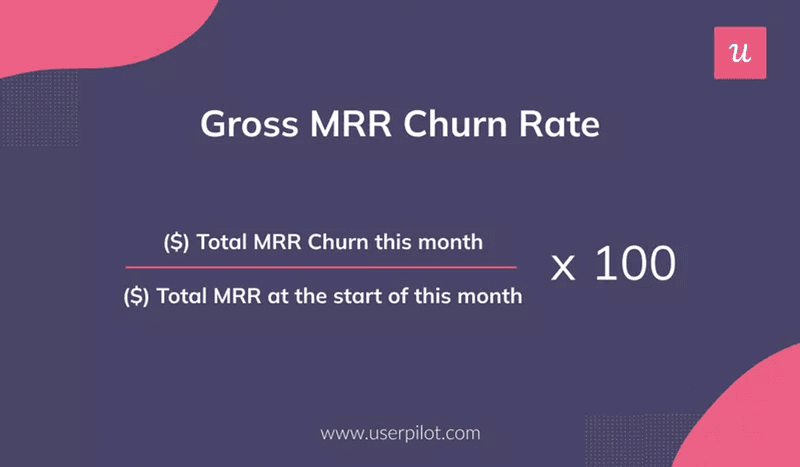
The Gross MRR churn rate is the sum of MRR lost in a period divided by the total MRR at the start of that period. In other words, this is the percentage of total monthly revenue lost from contracts canceled or downgraded by your users.
For example, if you started with $25,321 monthly recurring revenue (MRR) in January and lost $2,257 MRR from contract cancellations or downgrades in February, then your gross MRR churn rate is 9%.
Monitor the gross MRR churn rate to understand the impact of contract cancellations on your business. The goal is to have a low and steady gross MRR churn rate – ideally less than 2.5%.
How to perform customer churn analysis and gain insights into churn data?
Customer churn analysis consists of five steps. We’ve detailed and exemplified all of them, so you can easily replicate the process.
Let’s get started.
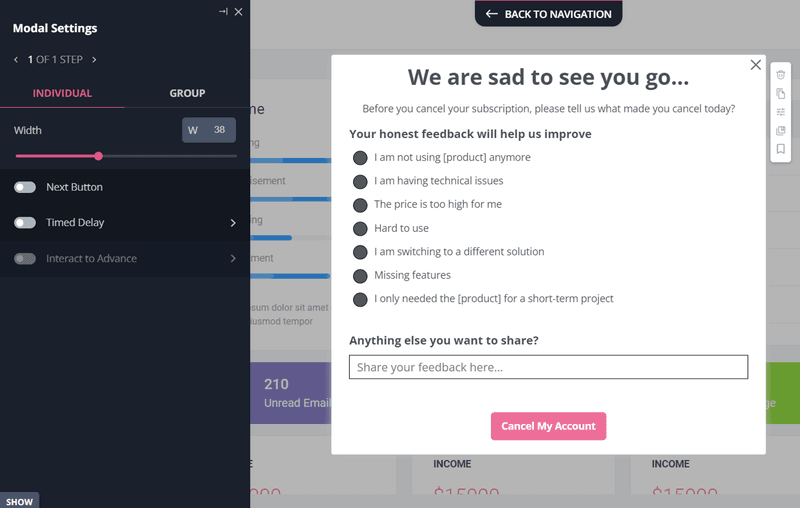
Collect customer churn data via churn surveys
Gather feedback from users after they cancel or downgrade their subscription plan.
Churn surveys can give you qualitative and quantitative data, such as the reason for churn and extensive feedback beyond it. Act on this data to improve the product and reduce churn.
Analyze customers by segments
The next step is to analyze answers within various customer segments to understand what types of customers are prone to attrition.
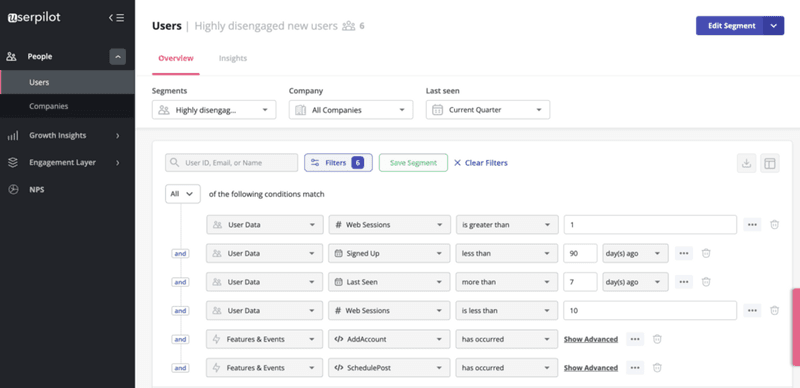
Group your users based on the characteristics like product type, company size, product usage, or geographical region. This will help you understand how the churn rate affects different groups and potentially determine the causes of churn.
Now you can segment users based on the characteristics of churned customers. For instance, you can segment inactive customers to proactively reach out to them and reengage.
Identify patterns in customer churn data
Let’s get back to our customer data collected from churn surveys. Here, we recommend thoroughly analyzing each answer in a follow-up question to identify patterns and work on them.
Thus, a canceled subscription in large numbers can translate into poor customer fit or missing functionality. Switching to a competitor will indicate troubles in pricing, features, or poor customer service.
Hard to use means the product lacks proper onboarding and has a bad UX.
Analyze customer behavior
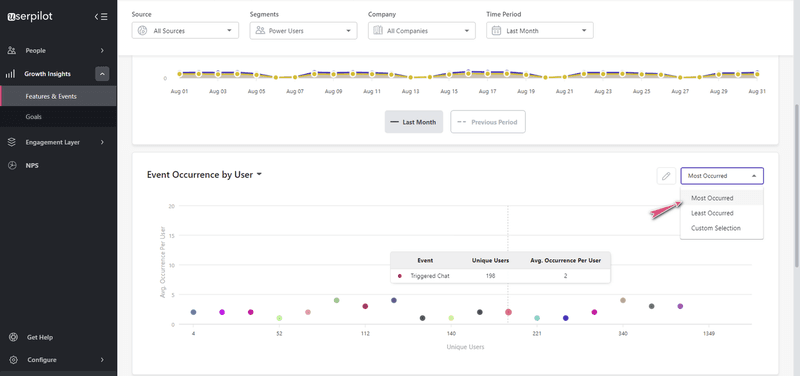
Analyze customer behavior to identify product usage patterns to predict customer churn and locate drop-off points. Here’s how to do that.
Let’s say you identified that users who engaged with feature A but not B usually churn. Likewise, the user group that engaged with both features, A, and B, kept using the product.
So you need to look at all your users that engaged with A and check whether they engaged with B. If not, this could indicate they are missing out and might churn in the future.
Find the reasons behind customer churn and improve in-app experiences
Сustomer churn analysis gives you a precise idea of why customers churn and what causes it. Once you obtain qualitative and quantitative data, the next step is to come up with solutions to solve the issues.
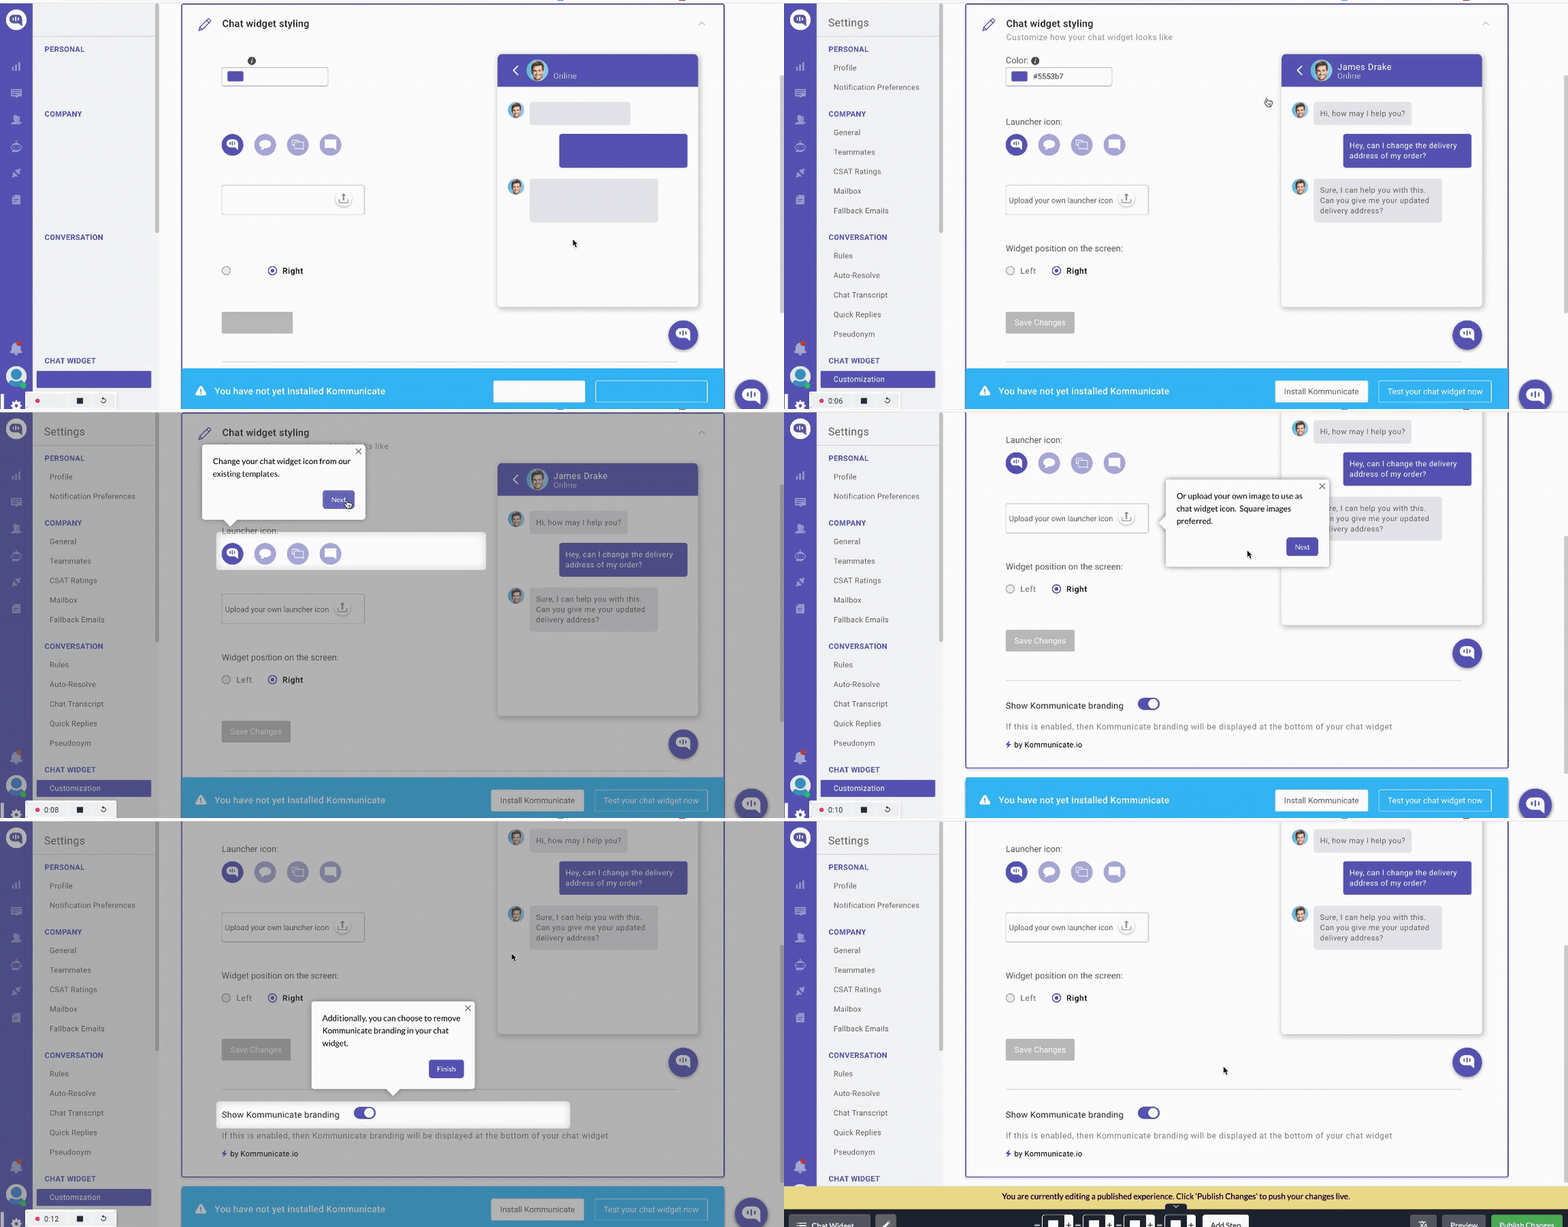
You can proactively reduce churn by using interactive walkthroughs and asking for feedback at different customer touchpoints. This will help you timely spot friction points.
Below is an example of setting up an interactive walkthrough.
How to proactively reduce customer churn and retain existing customers
We’ve put together a list of best practices for SaaS to retain existing customers and decrease customer attrition at different stages of the customer journey. Let’s study them all.
Create personalized onboarding to shorten the time-to-value
A customer onboarding process helps bridge the gap between onboarding and delivering value for new customers. Design personalized onboarding experiences tailored to each use case.
Start by embedding a welcome screen in the welcome flow to find out your customers’ goals and create onboarding journeys for each.
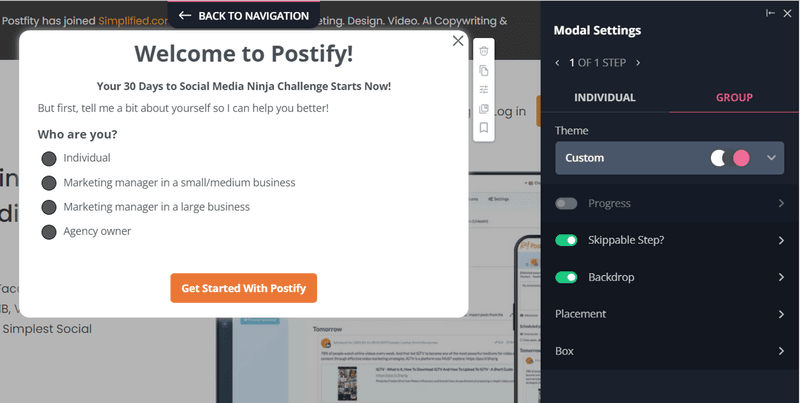
Afterward, you can guide them to the best features that will solve their problems and help them meet their goals.
Use tooltips to drive feature adoption
Tooltips (or website tooltips) are small pop-ups that appear over an element on a web page, such as an icon, link, or button.
Tooltips have become a common way to provide users with contextual information about the elements they interact with.
They allow product managers to quickly convey important information about the feature without cluttering up the interface or confusing users with long descriptions.
Tooltips can be incorporated into the onboarding flow to guide users on what they need to do next, therefore, boosting product adoption.
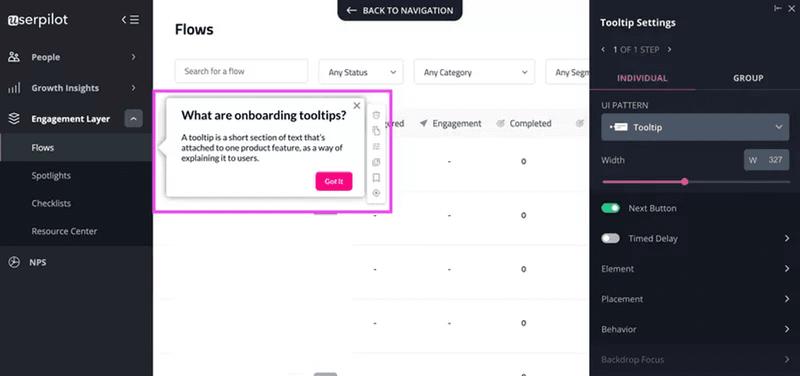
Create an in-app help center to educate and support customers
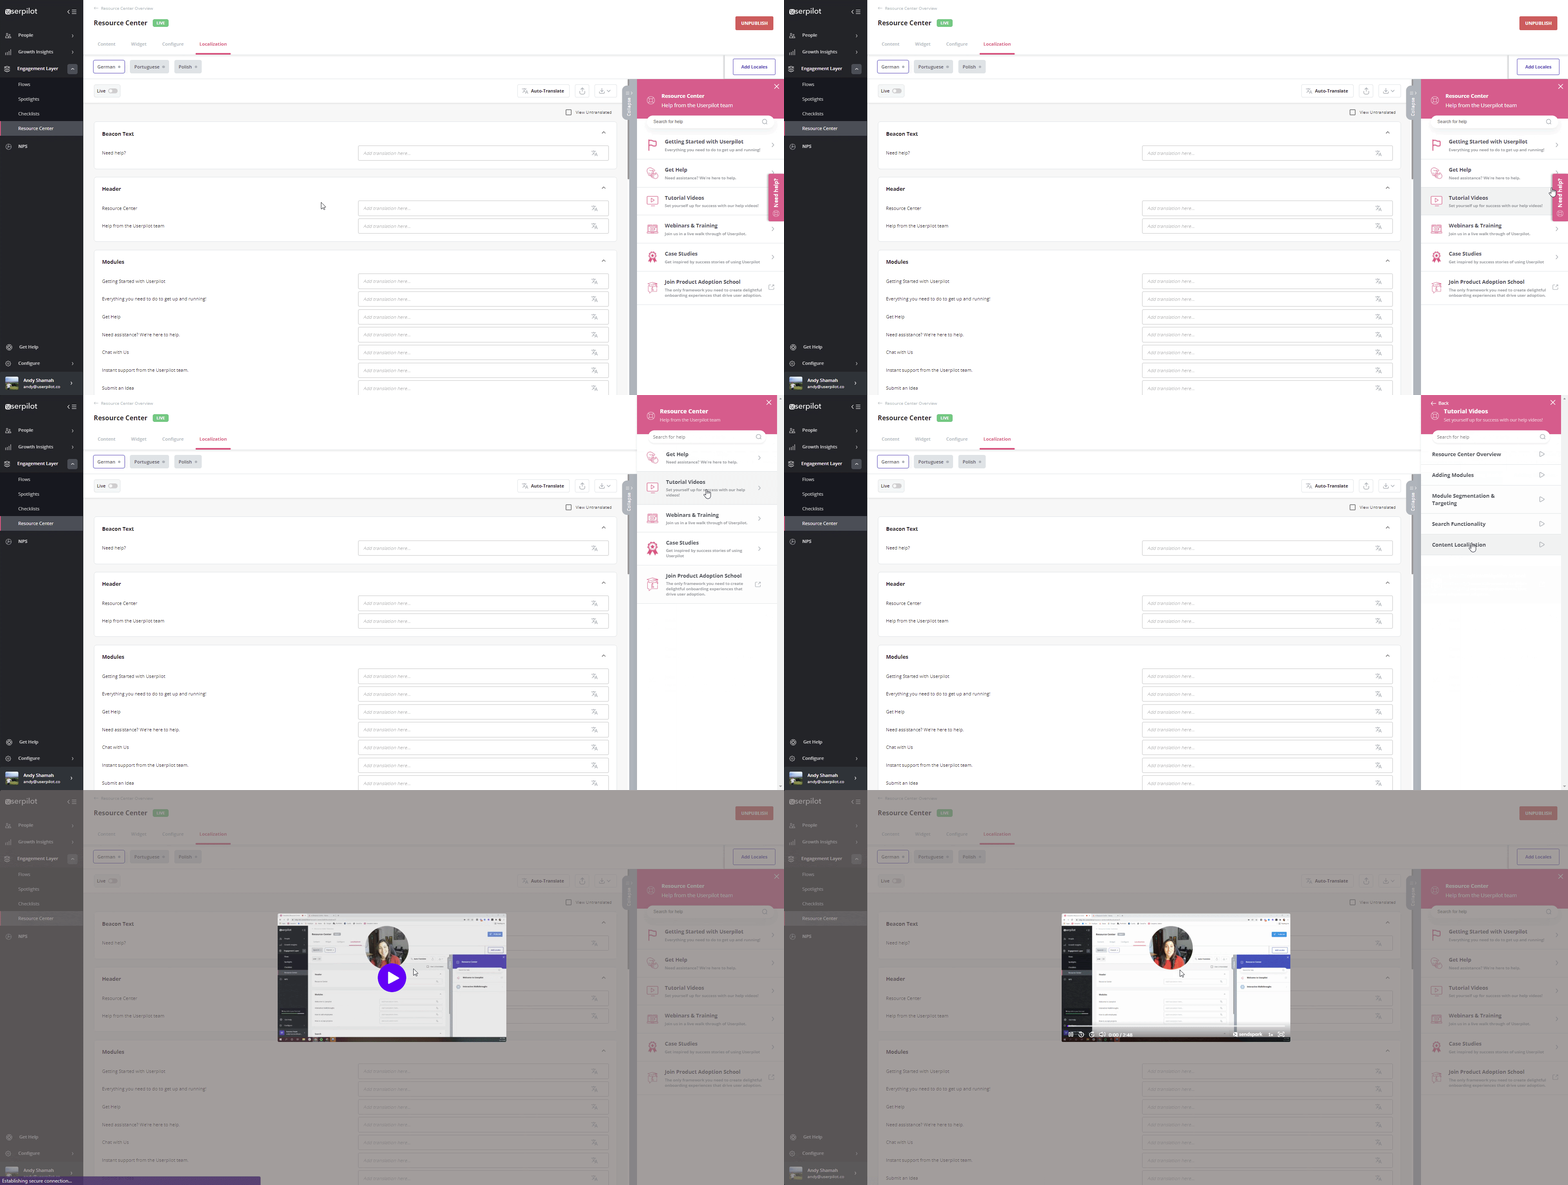
An in-app help center is a centralized hub to store information about your product features and functions, tutorials, troubleshooting steps, FAQs, etc.
Having a dedicated space for users to go directly from the product can make it easier for them to find the answers they need quickly and avoid frustration.
Fill a resource center with educational materials and embed live chat to promote self-serve support and improve customer experience.
With Userpilot, you can embed different formats in your resource center.
Use an onboarding checklist to motivate new customers
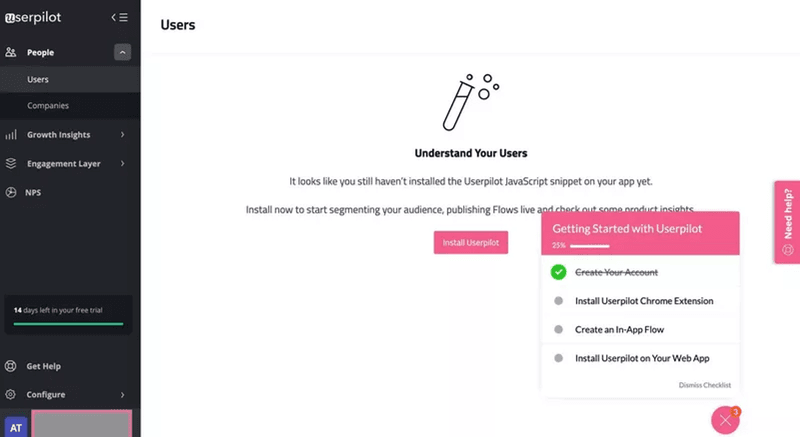
An onboarding checklist is an in-app guidance that outlines the steps necessary to get started with your product. It helps keep customers engaged and motivated while they learn how to use the product, which gets them to experience the activation point faster.
Ideally, the items on the checklist should include easy steps that will motivate users to continue. Don’t know where to start? Get inspiration from onboarding checklist templates.
Collect customer feedback throughout the customer journey and improve customer experience
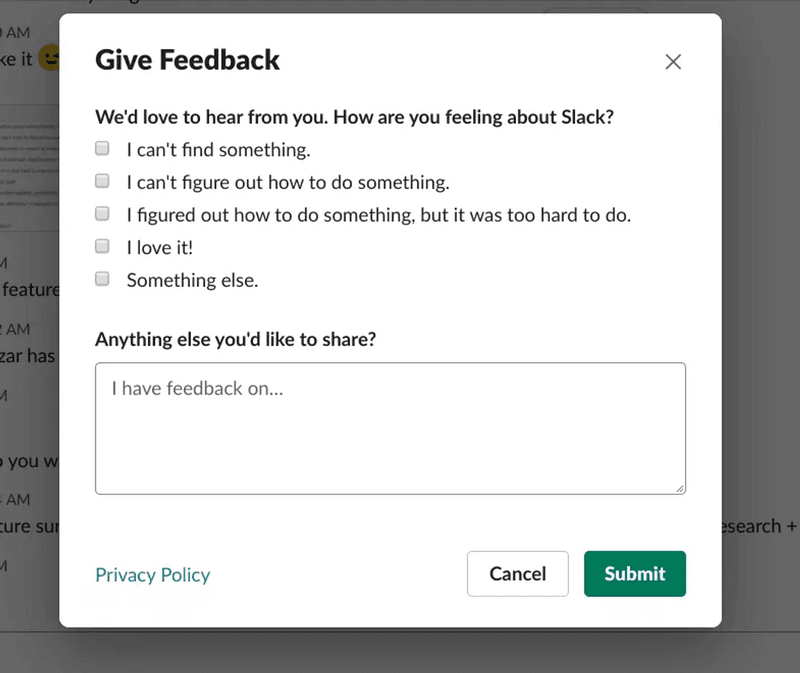
Gather customer feedback at key touchpoints along the customer journey, such as after signing up for an account, completing goals, or engaging with a feature. To do that, build in-app microsurveys. Use open-ended questions to collect qualitative data.
Analyze the collected data to identify and address common friction points to improve customer experience.
Track product usage to identify inactive users and engage them
Product usage is about all the interactions a customer has with your product. Tracking customer usage can help you identify behavioral patterns of stalled users and, based on this data, design a reengaging strategy.
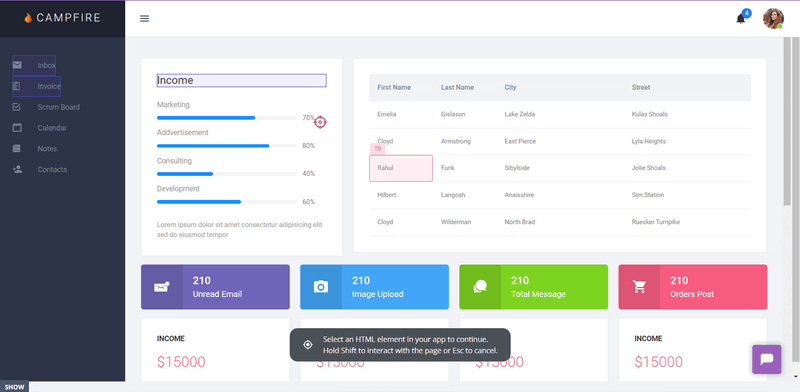
For instance, if someone hasn’t used a feature they need to complete their JTBD, you can lead them to use that feature and experience value.
Use NPS surveys to find at-risk customers and prevent churn
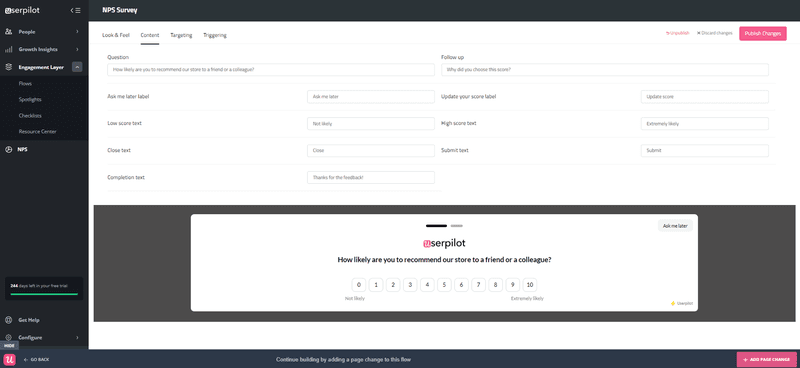
Use NPS surveys to identify detractors (users who are unsatisfied with your product and have a high chance of churning) and the reasons behind their dissatisfaction. Create a follow-up question to identify their pain points and work on fixing them
With Userpilot, you can customize the look and feel of NPS surveys, add qualitative questions, and trigger the survey after predefined events.
Conclusion
Customer churn data is imperative for businesses to identify customers likely to leave and take proactive steps to reduce their churn rate. Churn analysis will help to find friction points and improve customer retention.
Want to get started with churn analysis? Get a Userpilot Demo and see limitless possibilities for obtaining and acting on customer churn data.


