
What Is a Good NPS Score for SaaS Companies? (+Tips to Improve It)
Are you curious about what is a good NPS score for SaaS companies? Well, so were we, which is why we went on a quest to find that benchmark for you.
In this post you will find:
- A definite resource for calculating the NPS score
- The industry benchmarks to measure yourself against
- The steps you need to take now to improve your NPS
Let’s dive in.
Try Userpilot Now
See Why 1,000+ Teams Choose Userpilot

What is Net Promoter Score (NPS)?
NPS is what many consider to be the gold standard for measuring customer loyalty.
The metric was developed by Bain and Company in 2003 and has since been adopted by millions of businesses.
You have probably seen it pop up on plenty of websites or have sent out mass emails asking the same NPS survey question – “On a scale of 0 to 10, how likely are you to recommend [our company/product/service] to a friend or colleague?”
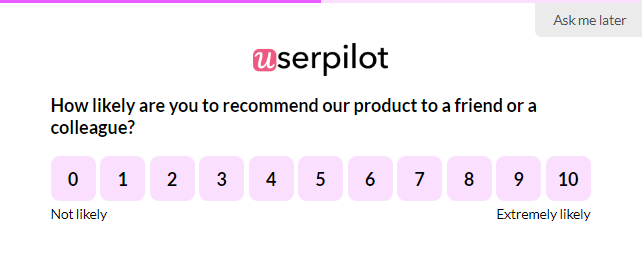
Depending on how you implemented the survey, you will be left with a variety of responses. You can use these responses to group customers into three main categories (which also uniquely relate to their usage of your product):
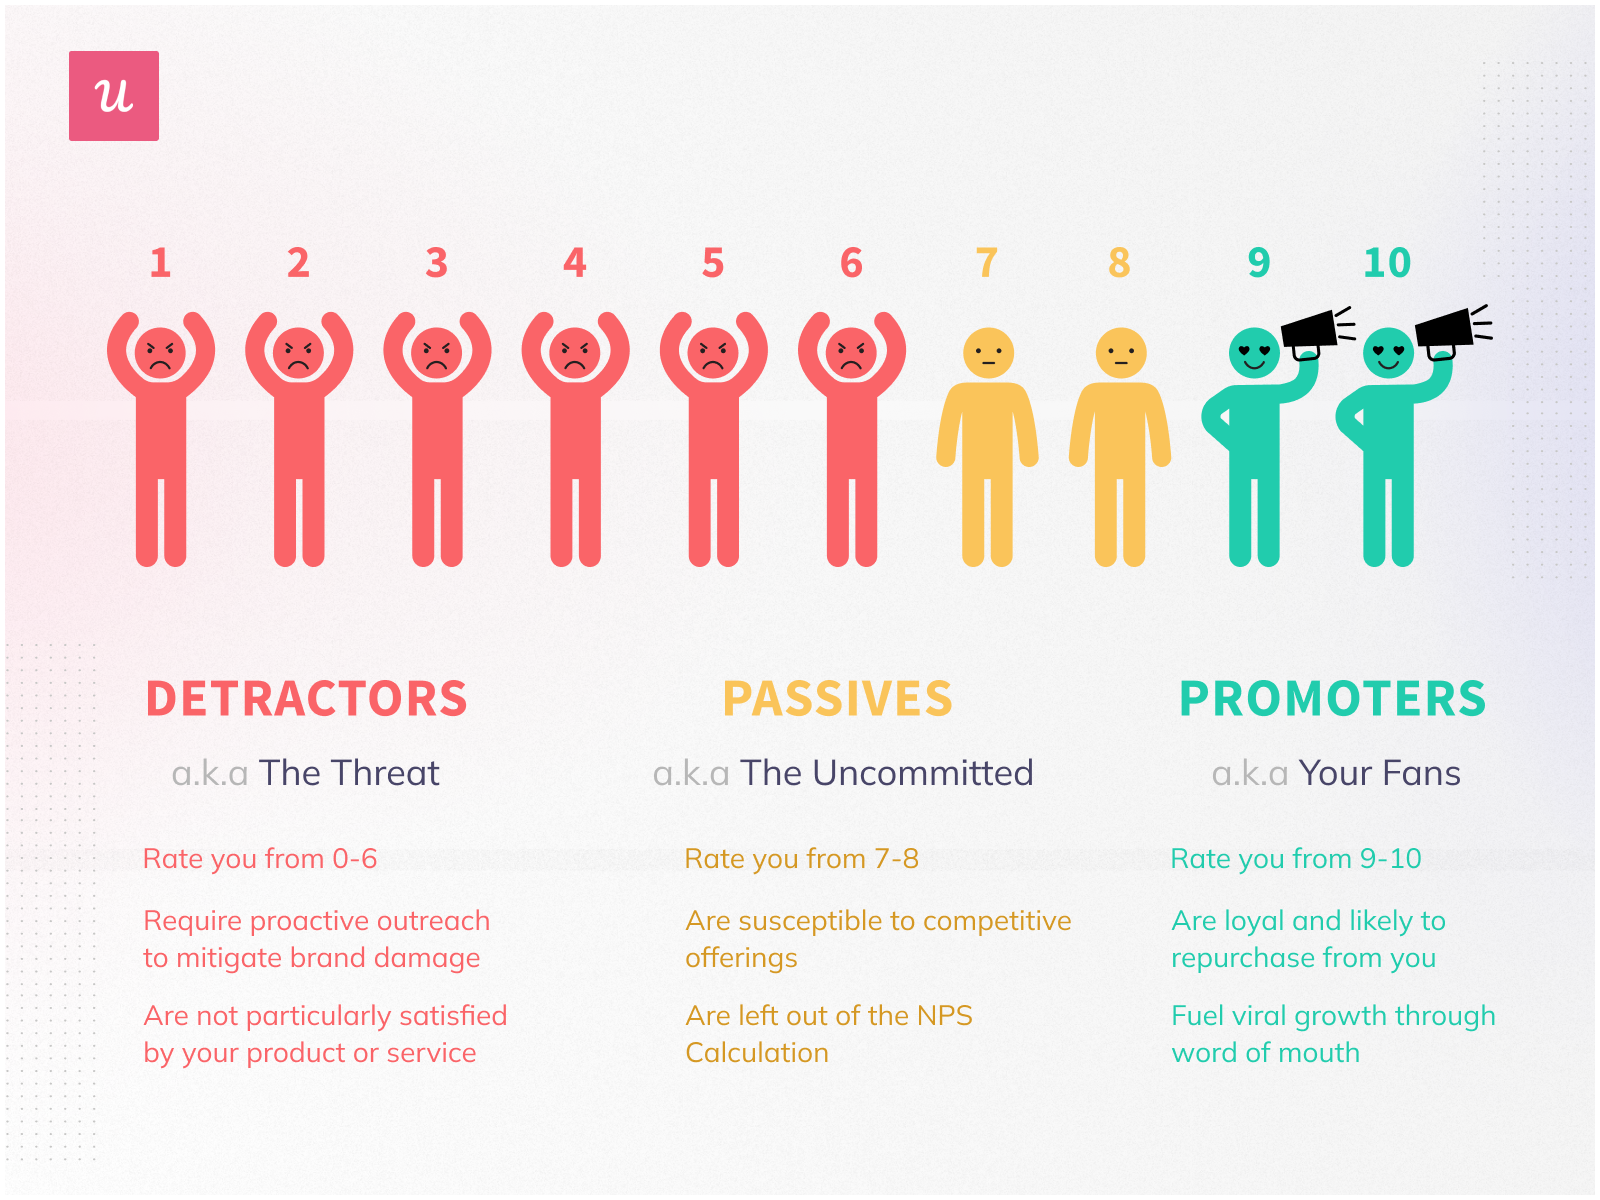
- Promoters or power users respond with a score of 9 or 10. They are typically highly engaged users who are using all of your key features.
- Passives or fence sitters respond with a score of 7 or 8. They are somewhat loyal to your product but maybe only have one use case and could consider another option as soon as they see a better fit.
- Detractors or unhappy customers respond with a score of 0 to 6. These customers see a lot of flaws in your product and may even persuade others to avoid signing up.
So, how do you actually take these responses and turn them into a score, and what is considered a good NPS score? It comes down to basic math.
How to calculate NPS scores for measuring customer loyalty?

To calculate your NPS score all you have to do is tally up your three categories and convert them into percentages. Scores can range from -100 to 100.
Next, subtract the percentage of detractors from the percentage of promoters. The number you are left with is your NPS score.
For example, let’s say you launch an NPS survey in your app and 100 users answer it.
- 50 respond with 9 or 10, so they fall in the promoter category and qualify as 50%.
- 30 respond with 7 or 8, fall in the passive category, and qualify as 30%.
- 20 respond with less than 6, so they fall in the detractor category and qualify as 20%.
50% – 20% = 30%
So your NPS score is 30!
What is the average NPS score for different industries?
The average NPS varies between industries. What might seem low to you might actually be high for your industry or vice versa.
The reason for this variation is that no customer is alike. Customers from different industries will have different expectations and will be more likely to answer surveys in certain ways.
Some products are also inherently easier when it comes to producing satisfactory results. Well, software is not one of them, ice cream on the other hand…
Let’s take a look at the average NPS score across several common industries from the Retently NPS Benchmark report.

So why do some industries top the list, while others hover around the bottom? Let’s focus on what we are most concerned about: the NPS score for a SaaS business.
What are SaaS NPS benchmarks?
The reason why the average NPS for SaaS products is so much lower than the other industries is that software companies can still operate profitably without an overwhelming number of promoters.
Especially if there are not so many alternatives on the marker or if your tool is particularly sticky (aka moving away to a competitor is more hassle than it’s worth), your users will stick around even though they are not 100% happy with your product.
As long as the tool continues to solve business needs, it will continue to turn a profit. However, the worse the experience customers have, the more likely they will churn or be open to switching to another solution.
As per the above report, the average NPS score for SaaS is 30. According to CustomerGauge, the average NPS score for SaaS companies is 36.
Let’s see what is considered a good NPS score and what should be a reason for alarm.
What is considered a Good NPS score?
So now that we know what the average NPS score is across industries, we can talk about what is considered a good NPS score.
- Anything above 0 shows that you have more satisfied customers.
- You want to use your industry benchmarks to set goals for where you want to be and for what to beat.
- Do not stress if your NPS is lower than the average. Anything in the region of 0 to 30 is pretty good across industries. Above 50 is excellent.
You may be wondering: what is the best NPS score for a SaaS business?
One of the highest NPS scores for a SaaS company is SugarCRM at 94. This is pretty impressive considering that over 2,000,000 people around the world use their software.
Their straightforward onboarding process, helpful video tutorials, and efficient customer success team make it the CRM of choice for Fortune 500 companies like T-Mobile and Zurich Insurance Group.
So we have seen what is considered a good NPS score but what is the worst?
What is a bad NPS score?
The golden rule is to always keep your NPS above 0. Anytime that you have more detractors than promoters, it is time to do some serious damage control.
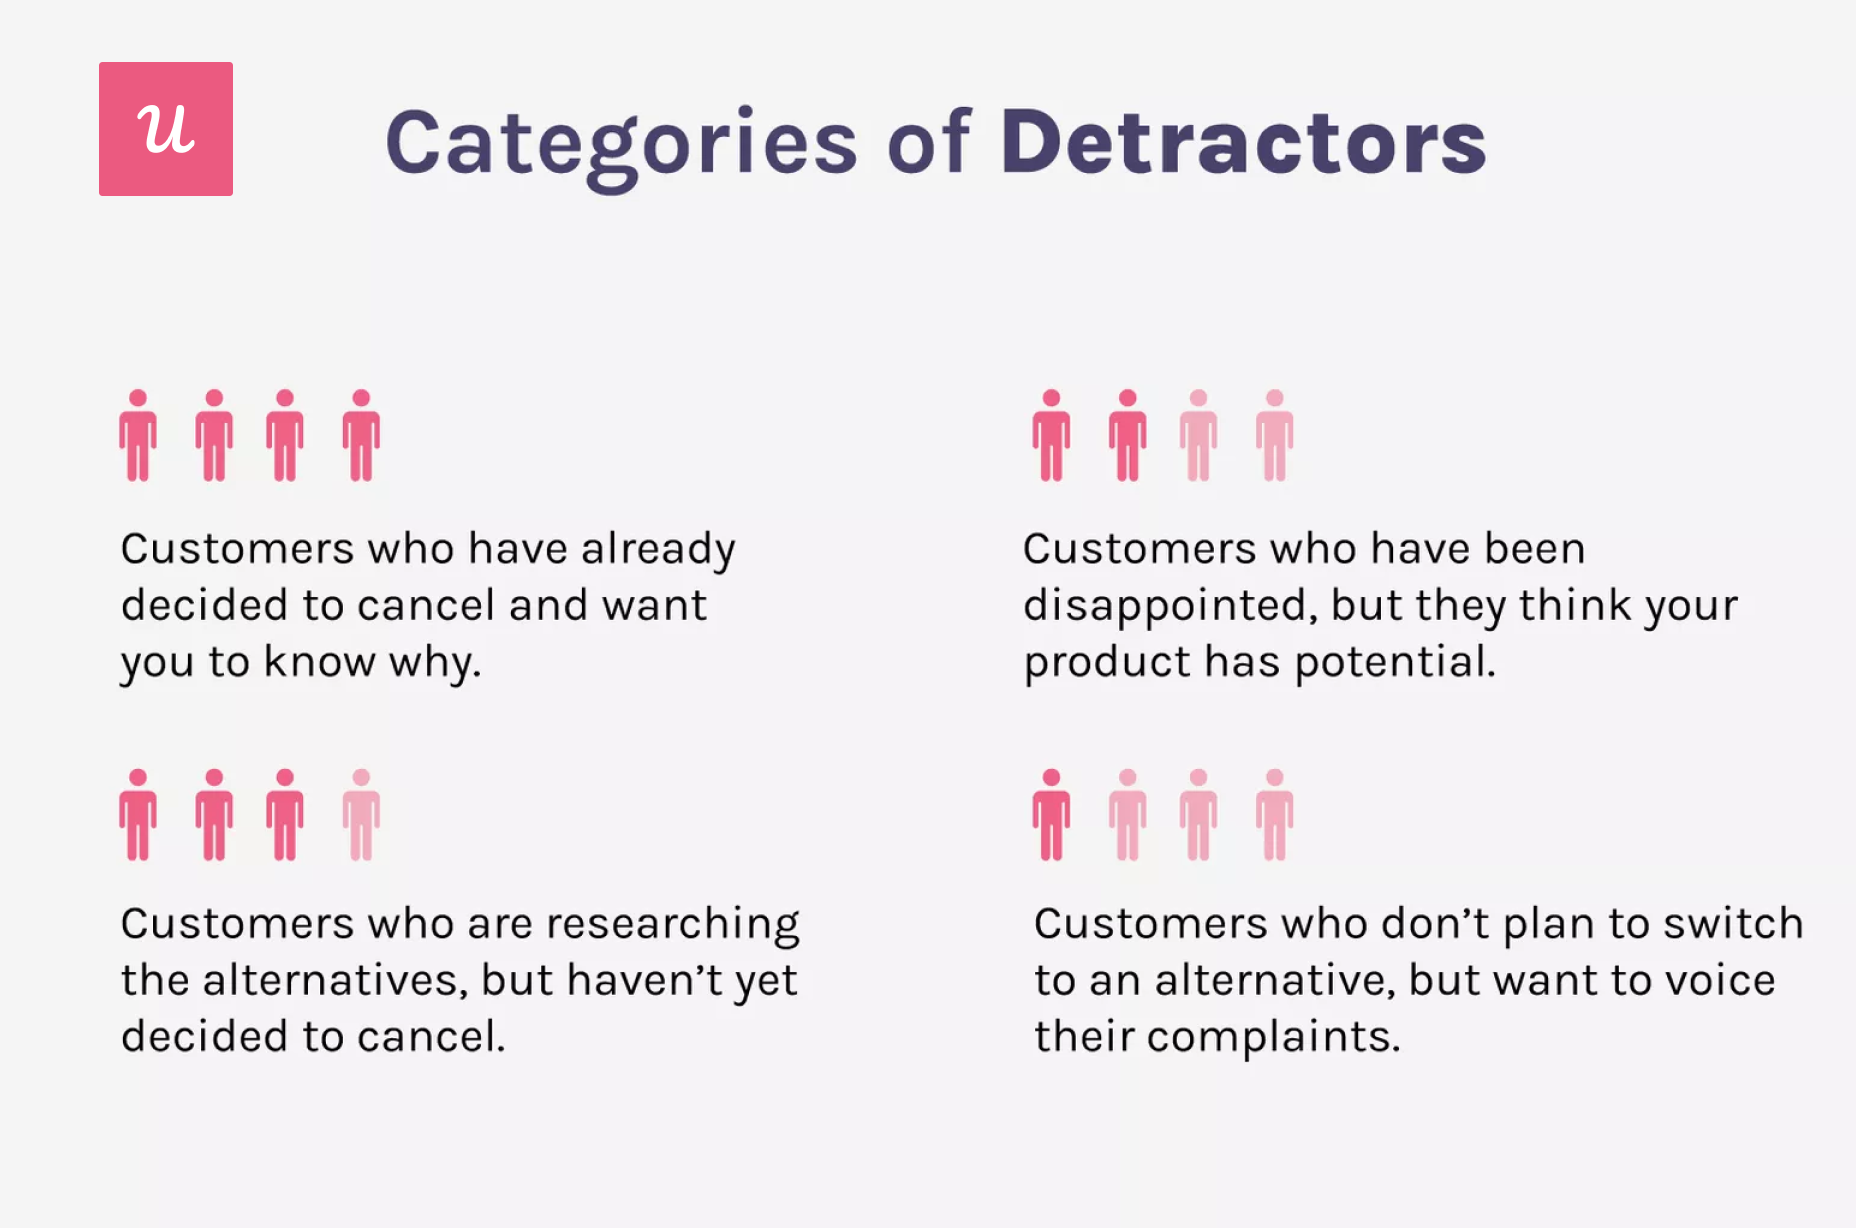
Detractors will be not only less loyal to your brand but also ready to drag your business through the mud (there are different types of detractors).
You will also want to compare your NPS score to your competitors. If they continuously outpace you, it will also mean that more of your customers will consider them as a better alternative.
Let’s have a look at an NPS study conducted by FYI on document apps. They found that the common pain point for all the users of these document apps was poor document organization.

Ironic considering that was what they were built for. This shows if an issue continues unaddressed for years, your users will speak out (they will also bad mouth you to your competitors).
How to improve the NPS score for gaining loyal customers?
You should now know if your NPS is relatively good, or great, or if you have a lot of work to do. If you still don’t know your NPS, why not sign up for a free Userpilot trial and find out?
The problem is that many SaaS companies only use their NPS score to give high fives around the boardroom or chastise their product managers.
The survey is time-consuming to implement and then you’re left with all this data and don’t know what to do with it.
It’s like putting a magnet on a compass. You keep spinning around in circles unable to pick a direction for where to direct your resources.
That is why you need a tool to collect the data in a thoughtful and organized way, conduct a follow-up qualitative survey (to find out why some of your users are happy and others are not), and combine those insights with your product usage analytics.
Choose the right tool to run your NPS survey
Before you get started with running your NPS survey, you are going to want a tool to collect and organize all the data and can easily combine it with your user analytics.
One of the most common is the ubiquitous SurveyMonkey and then you have other standalone apps that only provide survey functionality (e.g., SatisMeter). Contrastly, others are more advanced user engagement platforms offering NPS as one of their features (e.g., Userpilot). Userpilot offers you in-depth analytics and in-app experiences, so it’s easier to act upon feedback received from your customer base.
Once you select the tool to collect the data you have two ways of launching it: Email and in-app.
- Less intrusive – users open it at their own discretion
- Lower response rates – users will likely ignore most surveys in their inbox
- Better for follow-up questions
In-App
- More intrusive – could get in the way of what the user has been doing in your tool
- Better response rates – users more likely to answer honestly at the moment
- Easier to track responses and set up follow-up questions as well as experiences
- Can be triggered based on user behavior
While email is the most common method, in-app NPS surveys are becoming more and more popular. Here’s how you can create in-app surveys with Userpilot.
How to create in-app surveys in Userpilot?
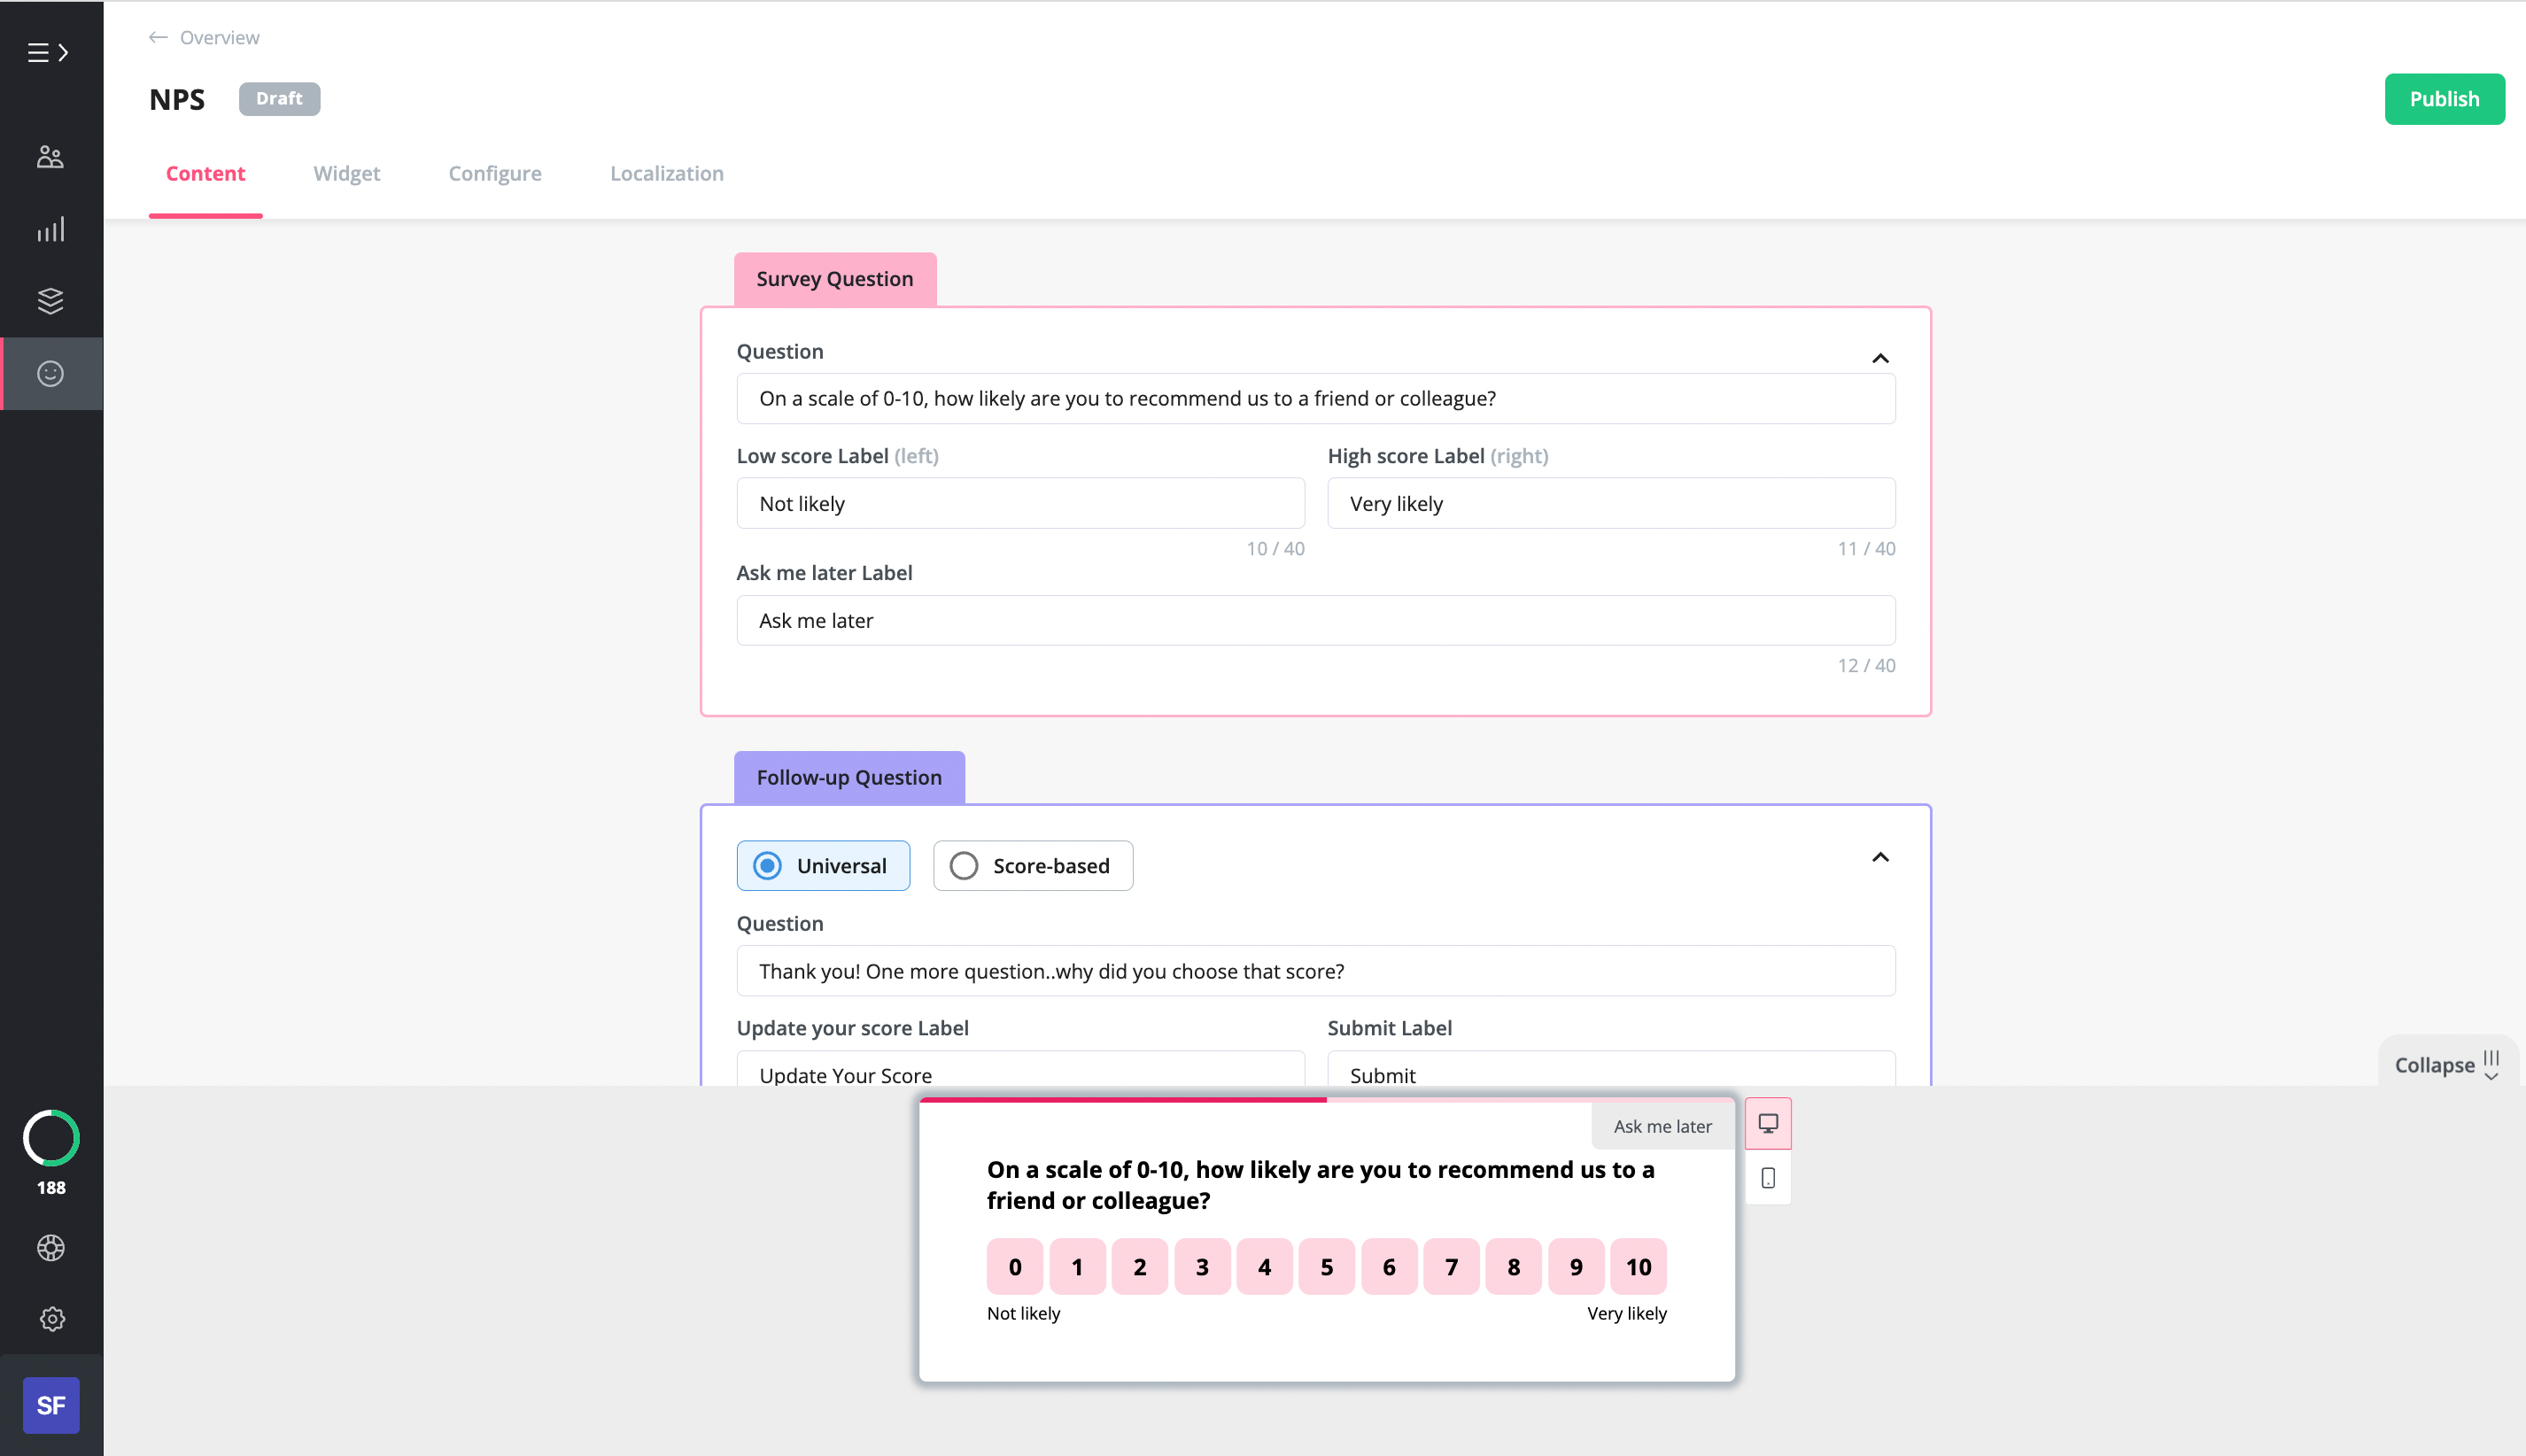
- You can design their look and feel to match your brand and be less intrusive.
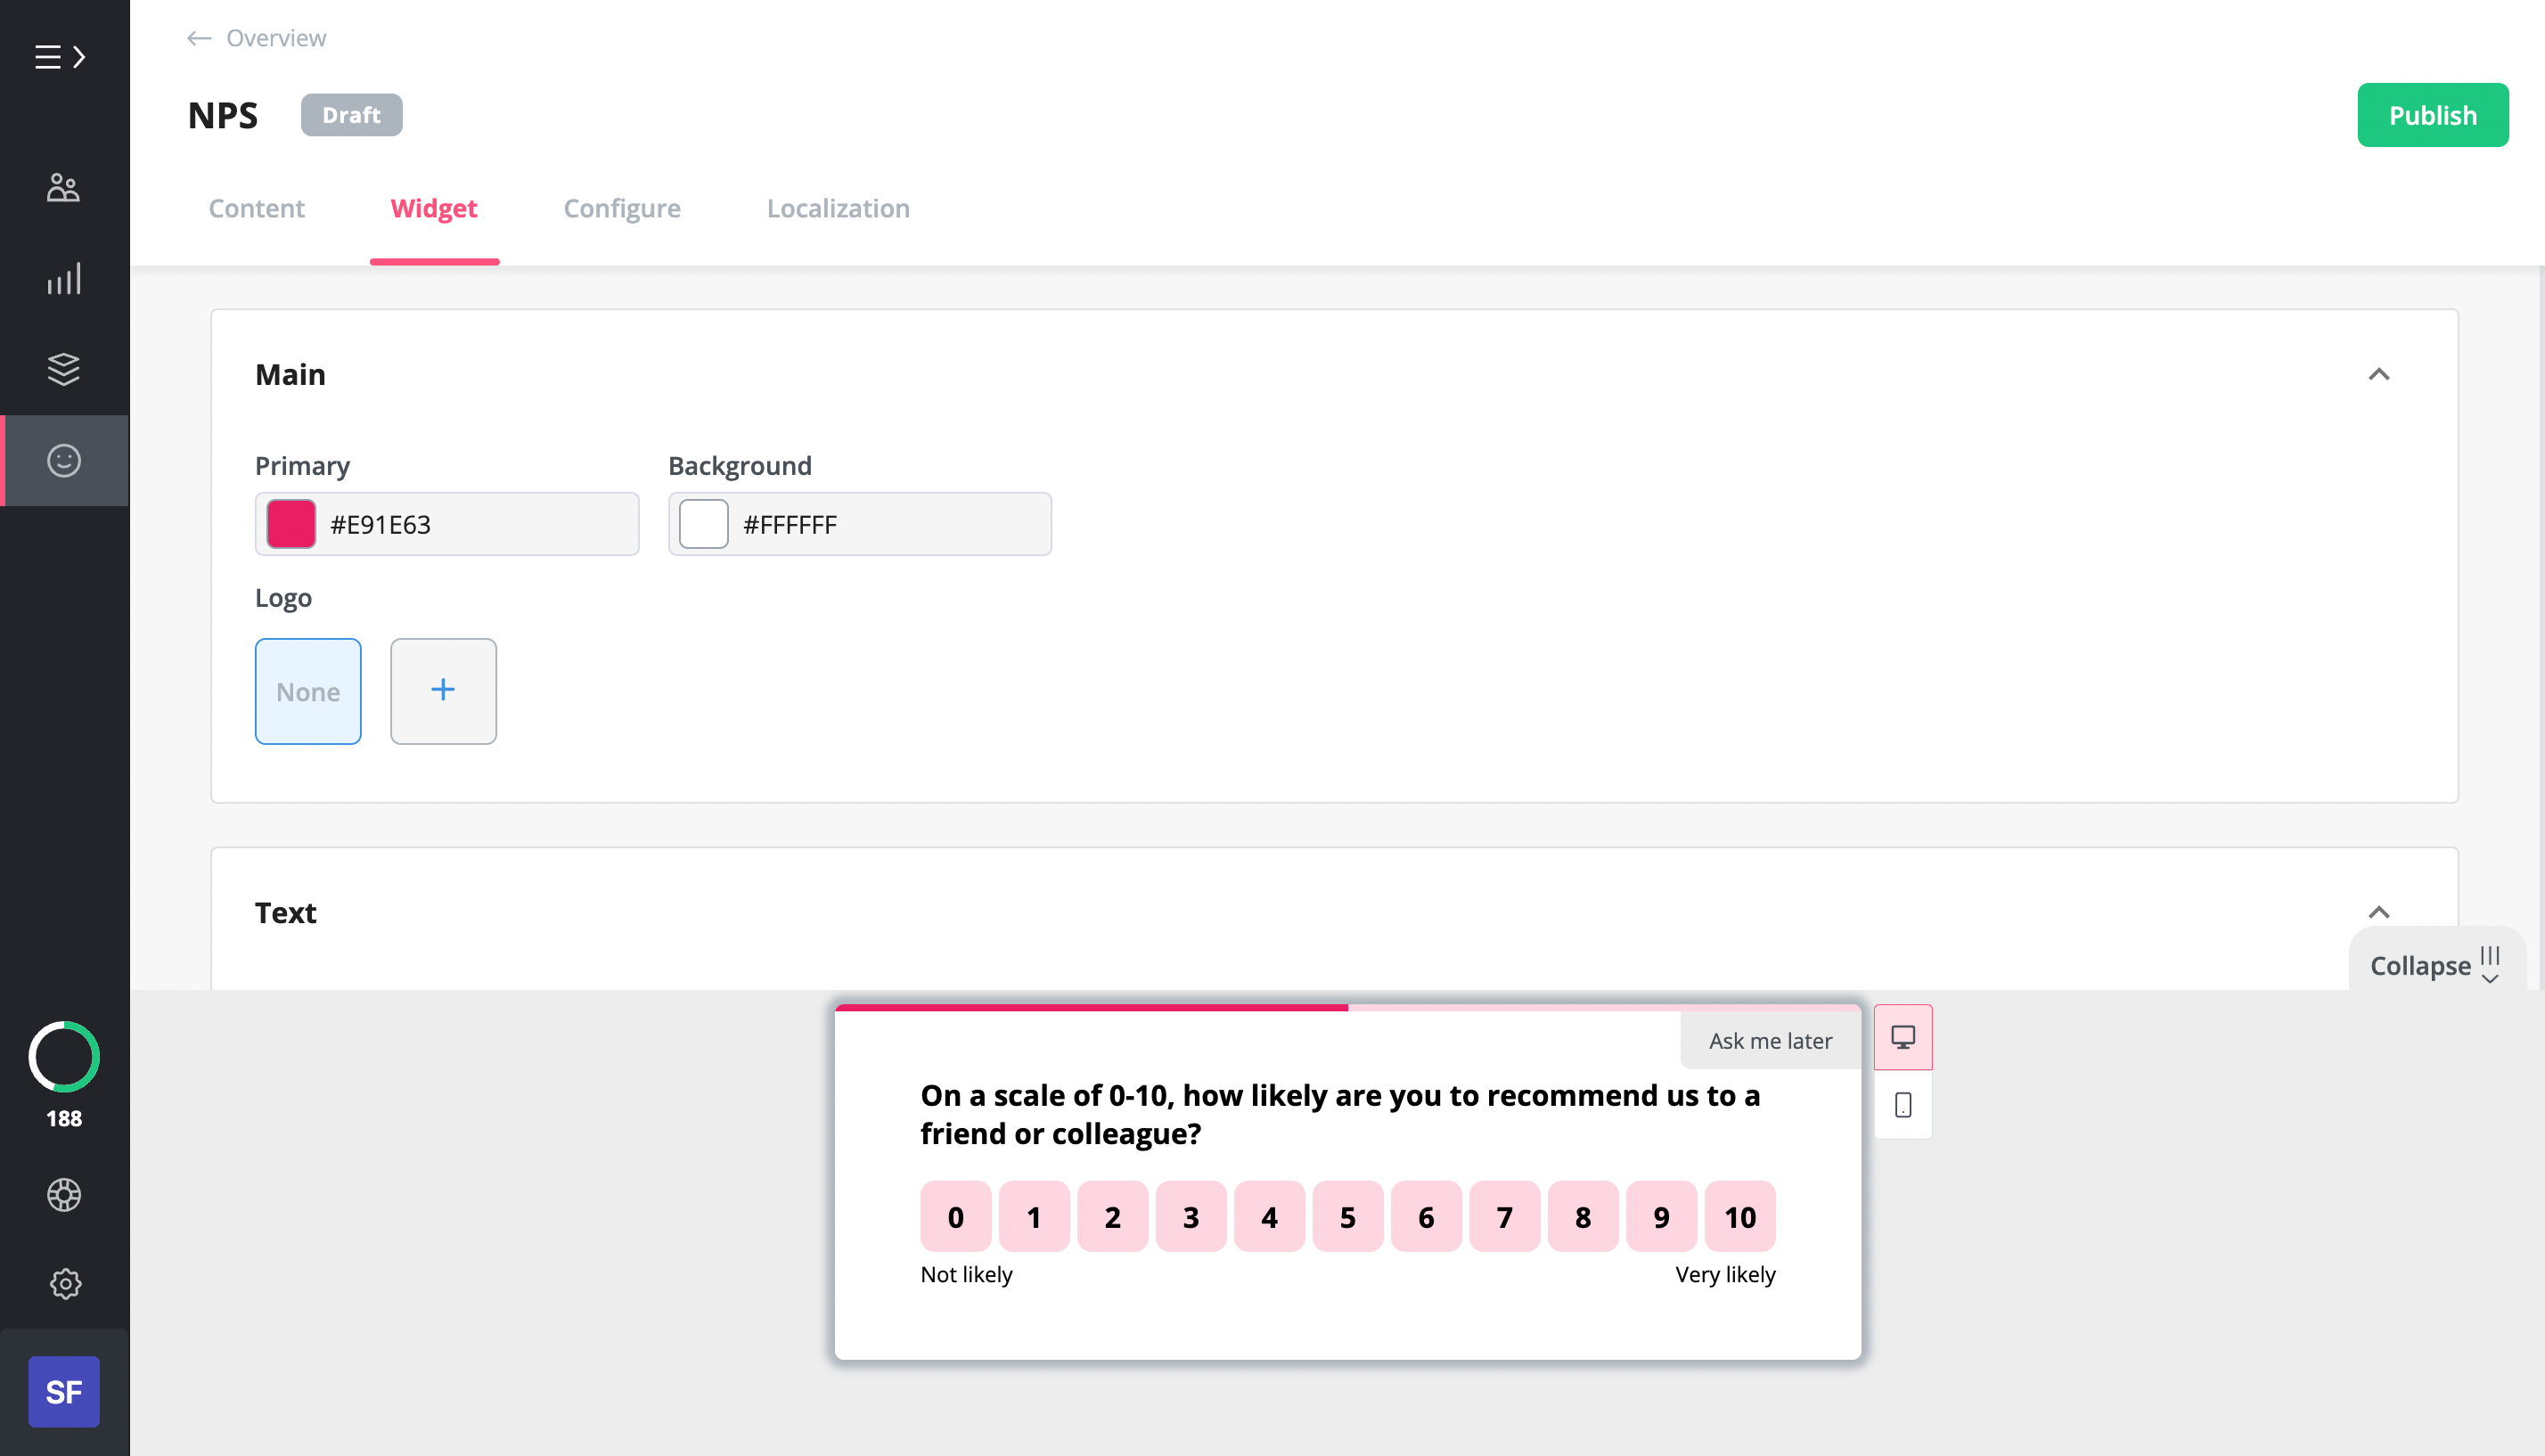
- You can change the text to be more unique. Instead of “not likely” try “not in a million years!” You can also include follow-up questions for further insights.
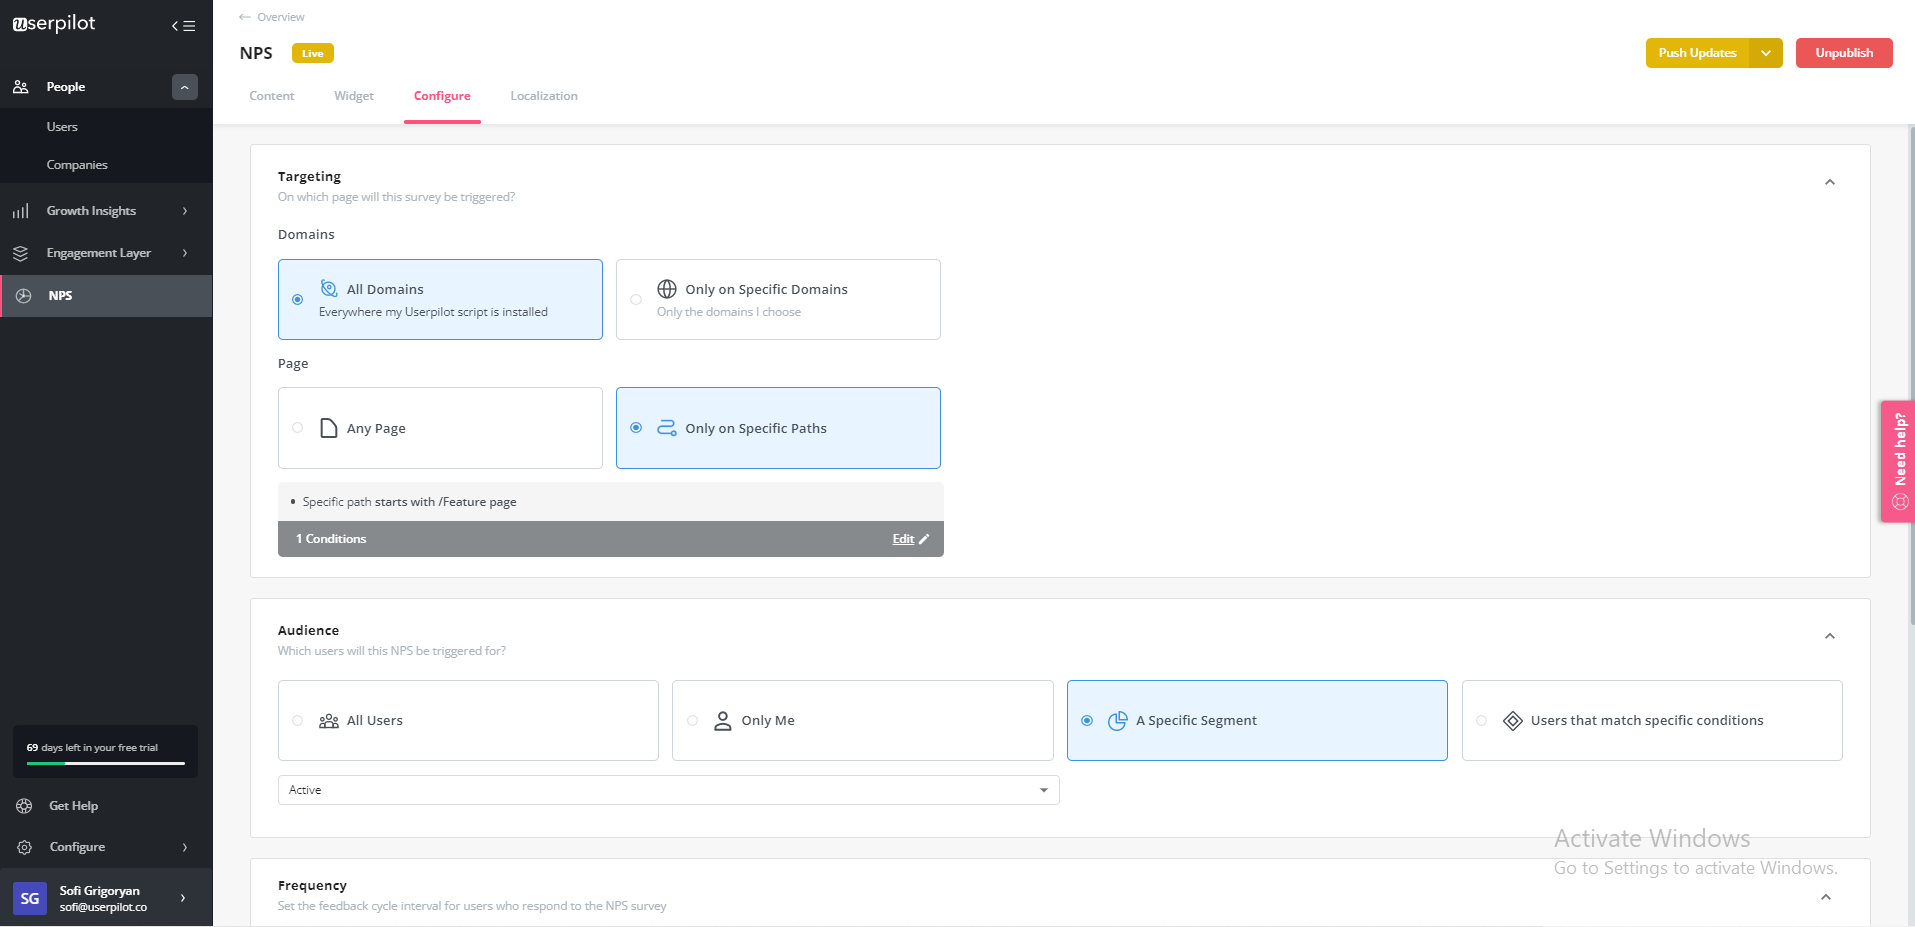
- You can decide when your survey will appear based on specific domains, pages, or user segments. Maybe you would like to find out what a particular set of new users think of your product.
- Finally, to not appear spammy or potentially deter your users from signing in, you can choose the frequency for launching the survey modal. You can even set the survey to appear based on how many pages they visit!

With this data in hand, you will be able to measure customer satisfaction and loyalty accurately and improve product experiences.
But once you find your NPS score, what do you do with it?
Analyze quantitative and qualitative NPS responses
The easiest way to analyze quantitative NPS data is to use a tool with an interactive dashboard, like the one from Userpilot below.
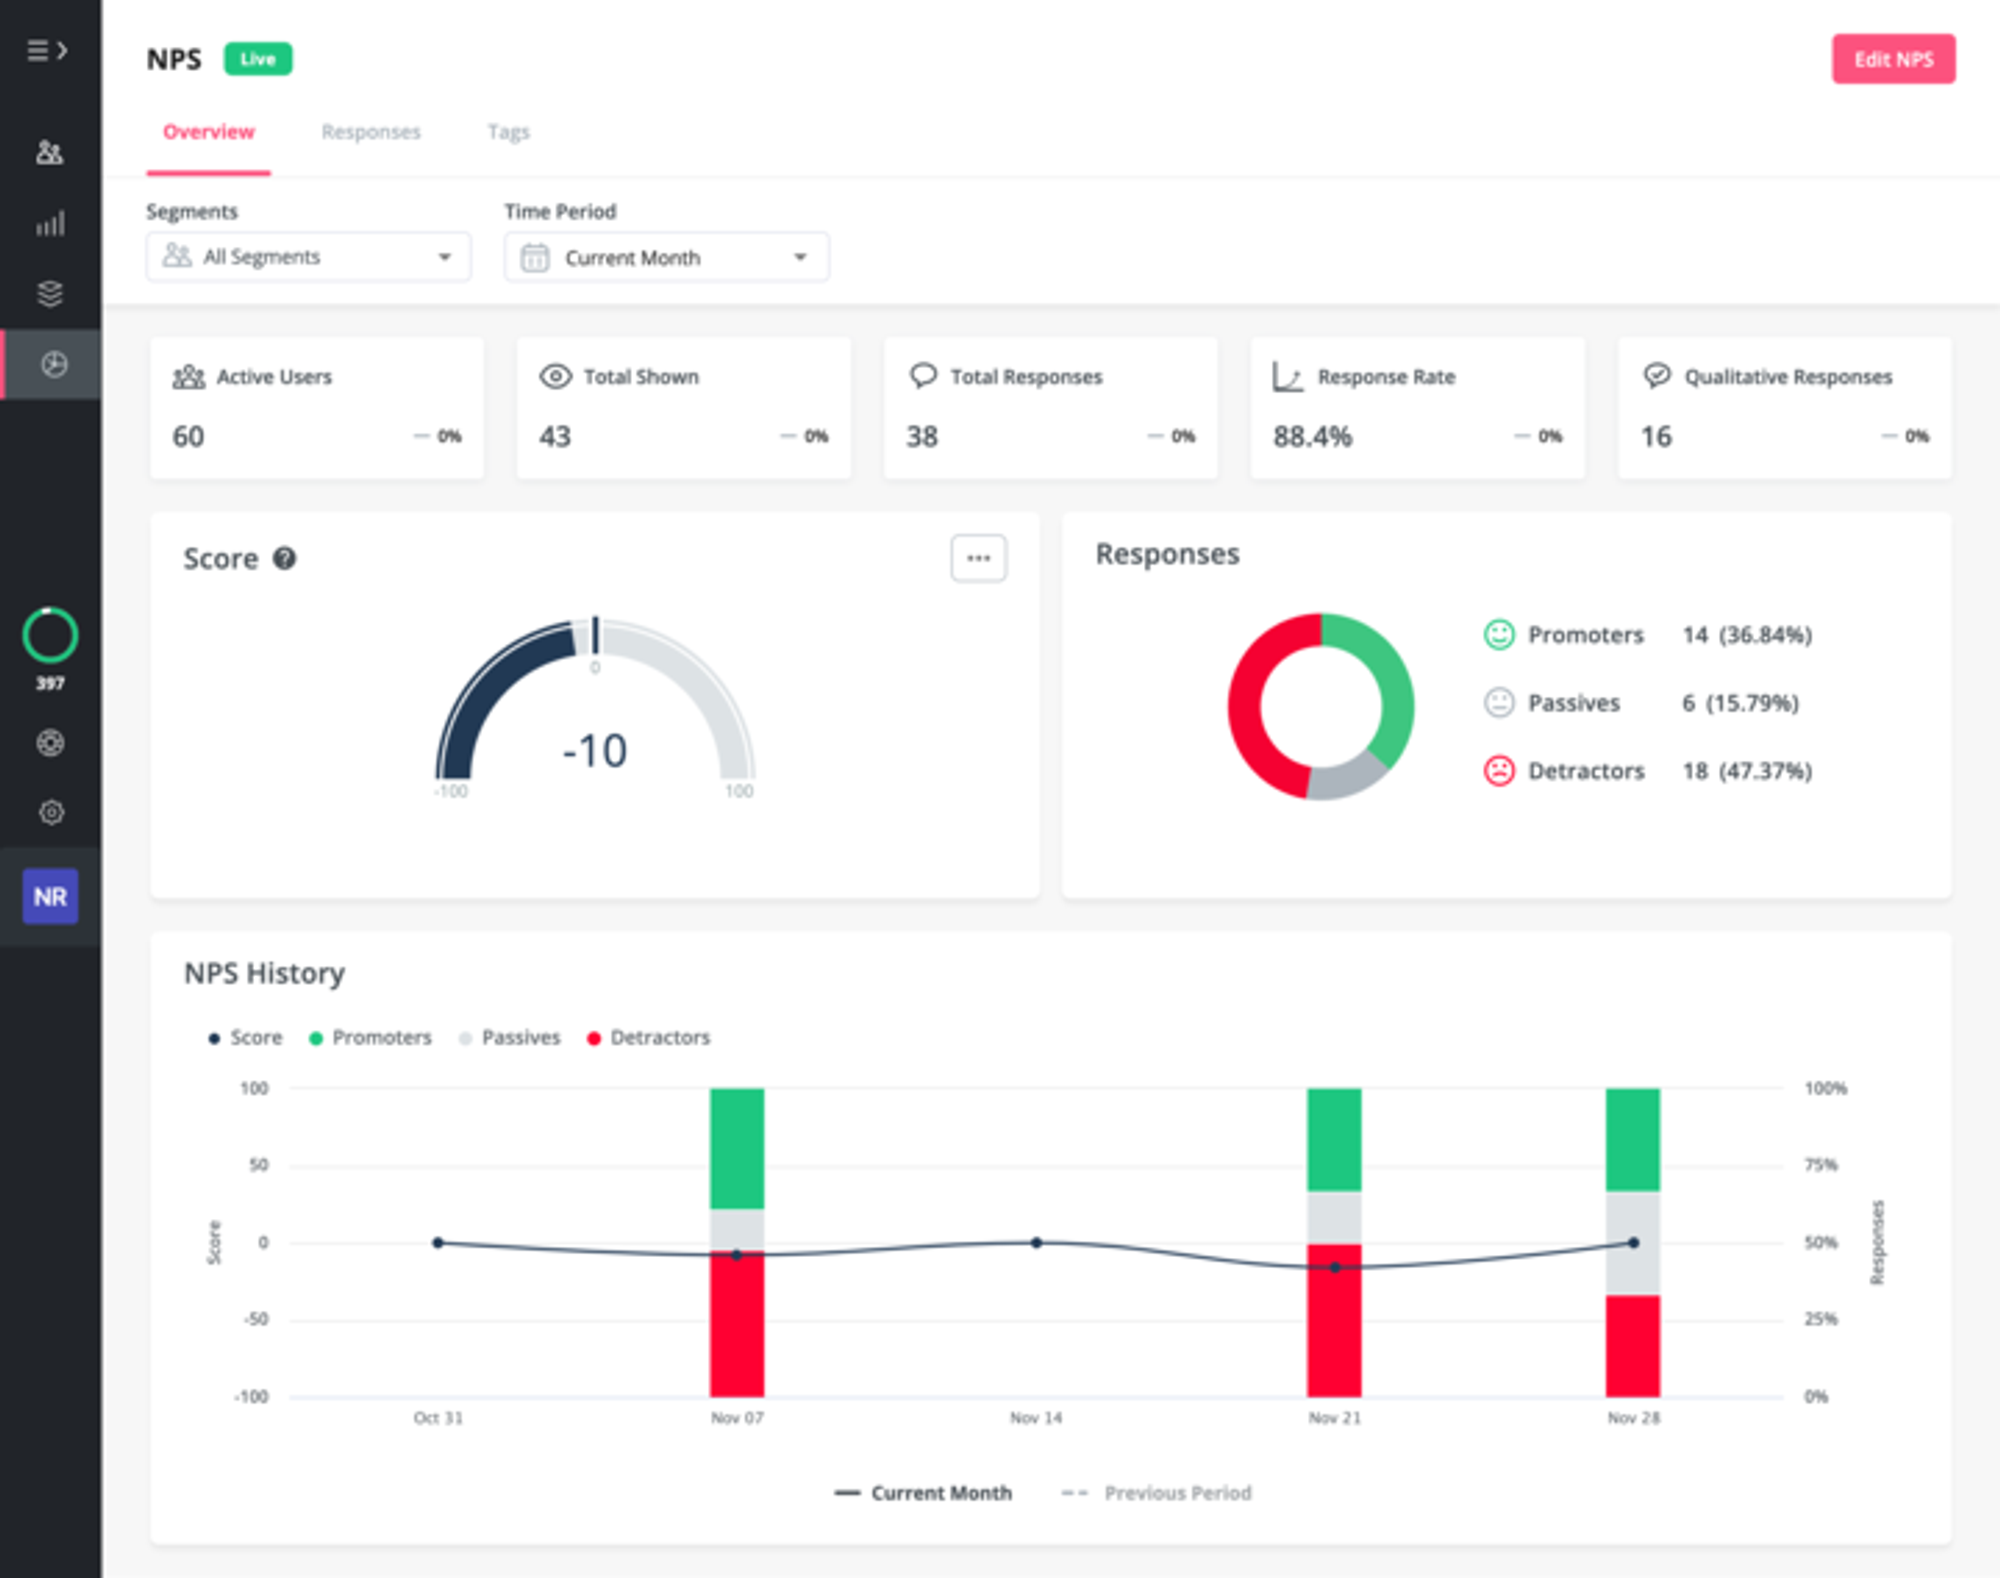
You will also want to track how your overall NPS score changes throughout each quarter.
This gives you the ability to see in real time which feature releases have the most impact on customer satisfaction and which updates might have tanked your score. Conversely, you will be able to see the impact of the experiences you create on improving it.
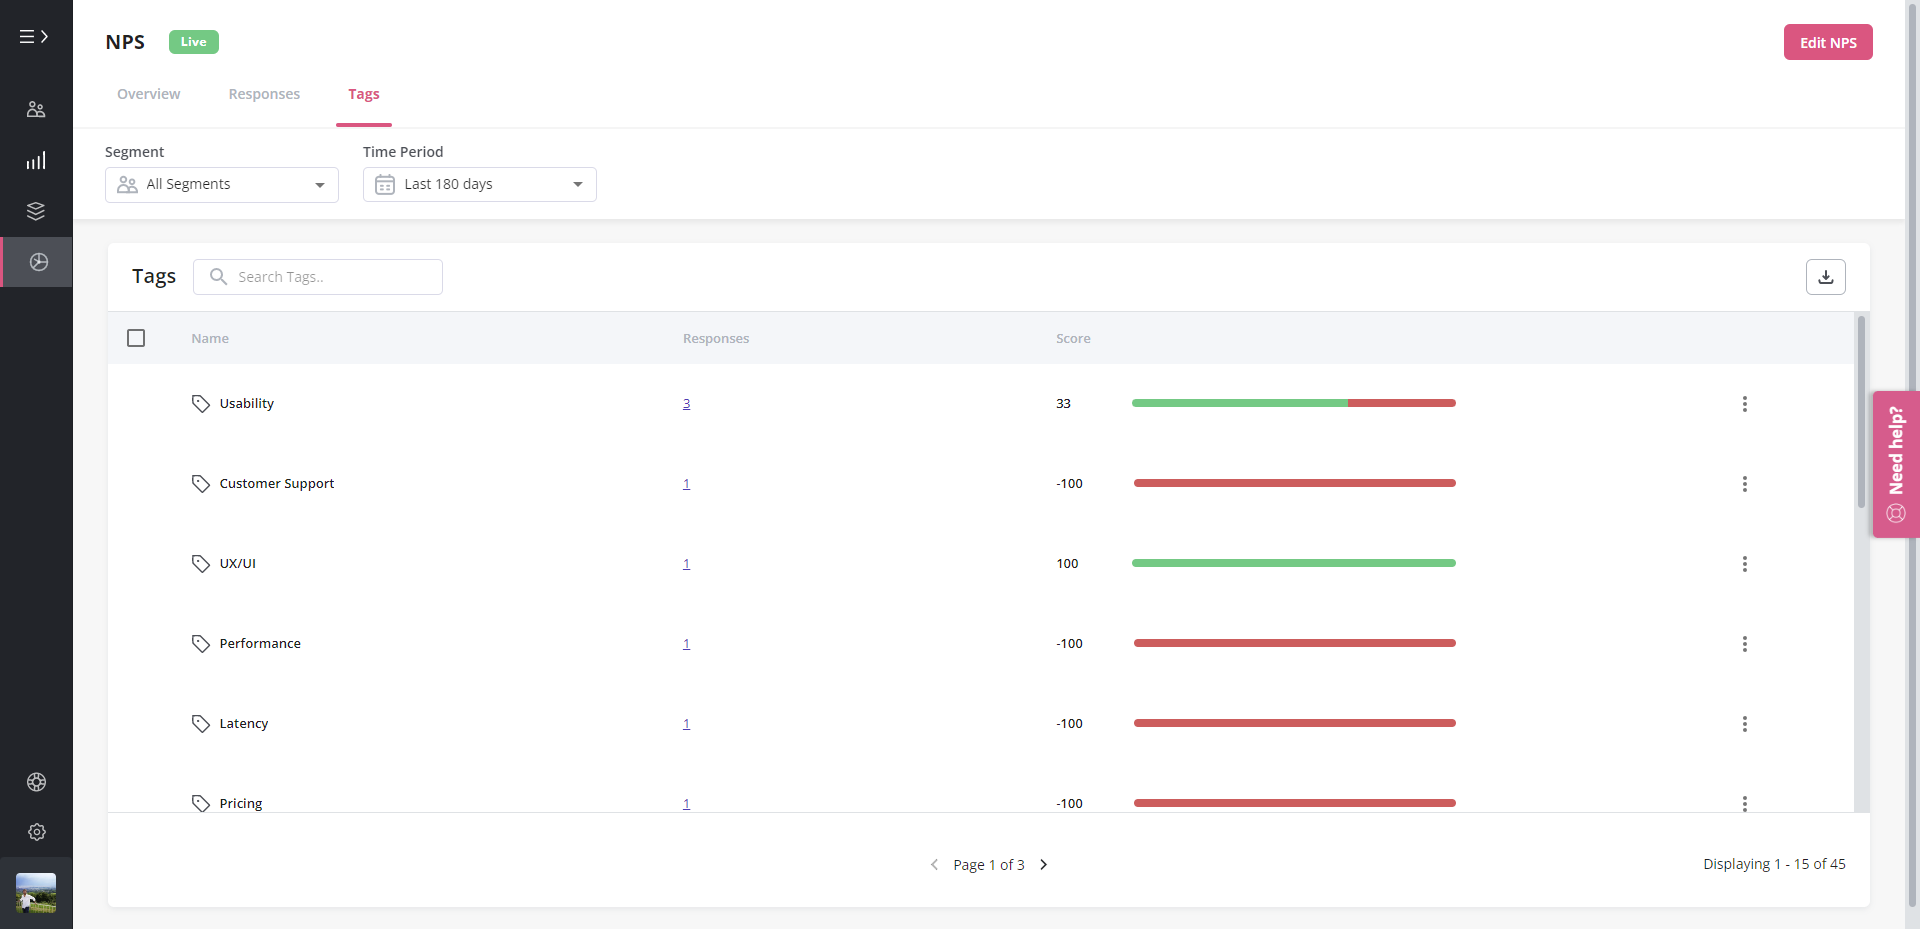
Finally, you may want to tag qualitative responses with specific keywords to be able to see user sentiment at scale and understand why most of your users feel in a particular way – good or bad.
You can then organize and track the responses based on the feature they are commenting on or the topic that has either helped or hindered their experience. If the word ‘bug’ keeps coming up in negative responses, that is your cue to bring the issue up with your developers.
Use the data to create in-app experiences that will boost customer satisfaction
Once you understand how your NPS score is connected to each user segment, you can address the issues through updates, hotfixes, or in-app experiences.
Here are a few important considerations:
- Only focus on users who fit your customer persona. Most likely a large portion of your detractors won’t like your product because it wasn’t built for them.
- Focus on the issues that align the most with your product roadmap.
- Dedicate your time to improving your product for a specific survey segment. Converting passives into promotors, marketing your product aggressively to your promotors, and shifting your detractors into passives.
Many times, the most common issue for detractors or passives was a poor onboarding process that left them unable to see the value in your product.
If you look at the activity of these segments, you will often see that they are not reaching your key activation points. They might even be complaining in their follow-up questions about not having features that already exist in your product.
If this is the case, then:
- Identify the common issues using your keyword tags (e.g., ‘missing’ feature that is actually there)
- Create an in-app experience flow that will nudge the users to discover and adopt this feature

Wrapping things up
Your NPS score is not the definitive metric for determining customer satisfaction, but it can definitely show if you are moving in the right direction.
Think of your product as a ship and your NPS as your compass. Your user feedback will point you in the right direction for developing features that continue to improve the lives of your users.
It will also let you know if you need to fix your path if some issues start to steer you off course to providing value. Most importantly, it will let you know if you need to completely change course and focus on the most pressing issues that are coming from your detractors.
If you’re looking for a powerful tool to measure and improve NPS scores for your SaaS business, then give Userpilot a go. Book a demo to see it in action.
Frequently asked questions (FAQs) about SaaS NPS scores
What is NPS?
Net promotor score is a business metric to measure how loyal your customers are. It is measured by the responses to the question, ‘How likely are you to recommend our product to your friend/colleague?’
How to calculate NPS score?
Subtract the number of detractors (those who answer 0-6) from the number of promoters (those who answer 9-10).
What is the average NPS score?
It depends on the industry, but for SaaS, it ranges between 30-36.
What is a good NPS score, and what is a bad NPS score?
0 to 30 is considered good, and above 50 is excellent. Any score below 0 can be considered bad.
How to run an NPS survey?
You can run one either in-app or through email.
How to improve the NPS score?
Compare your NPS survey results with user behavior. Develop solutions that address user concerns and follow your product roadmap.


![What are Release Notes? Definition, Best Practices & Examples [+ Release Note Template] cover](https://blog-static.userpilot.com/blog/wp-content/uploads/2026/02/what-are-release-notes-definition-best-practices-examples-release-note-template_1b727da8d60969c39acdb09f617eb616_2000-1024x670.png)


