14 Important Mobile App Metrics to Track (+ Benchmarks)


Creating a solid app is only half the battle won. Without measuring and aggressively improving the right mobile app metrics, you’ll struggle to stay afloat.
The competition is stiff. Most apps experience 89.3%-98.7% churn within 30 days, and in-app purchase conversion rates are often below 5% for the small number of users who remain.
How do you even survive considering these numbers?
The key is to understand your users and continuously optimize your mobile app for exceptional value. This article will cover 14 metrics to help you achieve just that. We also included industry benchmarks to help you know how well you’re performing!
Overview: Mobile app analytics metrics
Below is a quick summary of the mobile metrics every PM should be tracking.
The order of importance depends on your specific needs. For example, if you recently launched your mobile application and are focused on driving engagement, you’ll want to track app engagement metrics like DAU/MAU and feature adoption.
For more mature apps with stable engagement, track revenue metrics like CAC, LTV, and install-to-purchase conversion rates.
| No. | Category | Mobile app engagement metric | Why track it? |
| 1 | Engagement | DAU/MAU | Understand daily and monthly active user engagement and overall app popularity. |
| 2 | Engagement | Feature adoption | Gauge user interest in new features and optimize feature development. |
| 3 | Engagement | Average user session length | Measure user interactions and identify areas for improved content or flow. |
| 4 | Engagement | User retention rate | Determine how well your app retains users over time. |
| 5 | Engagement | Churn rate | Identify reasons for user abandonment and implement strategies to reduce loss. |
| 6 | Acquisition | App downloads | Track initial user acquisition and measure marketing campaign effectiveness. |
| 7 | Acquisition | Customer acquisition cost | Understand the cost of acquiring each user and optimize marketing spending. |
| 8 | Revenue | Average revenue per user (ARPU) | Assess the profitability of your user base and identify revenue growth opportunities. |
| 9 | Revenue | In-app purchase conversion rate | Measure the effectiveness of in-app monetization strategies. |
| 10 | Revenue | User lifetime value | Predict long-term user value and guide strategic decisions on user acquisition and retention. |
| 11 | User experience | App crashes | Identify stability issues and improve the overall user experience. |
| 12 | User experience | App load time | Optimize app performance for faster loading and improved user satisfaction. |
| 13 | User experience | App launch time | Check app accessibility and minimize user frustration. |
| 14 | User experience | Net Promoter Score (NPS) | Gauge user satisfaction and loyalty to identify areas for improvement. |
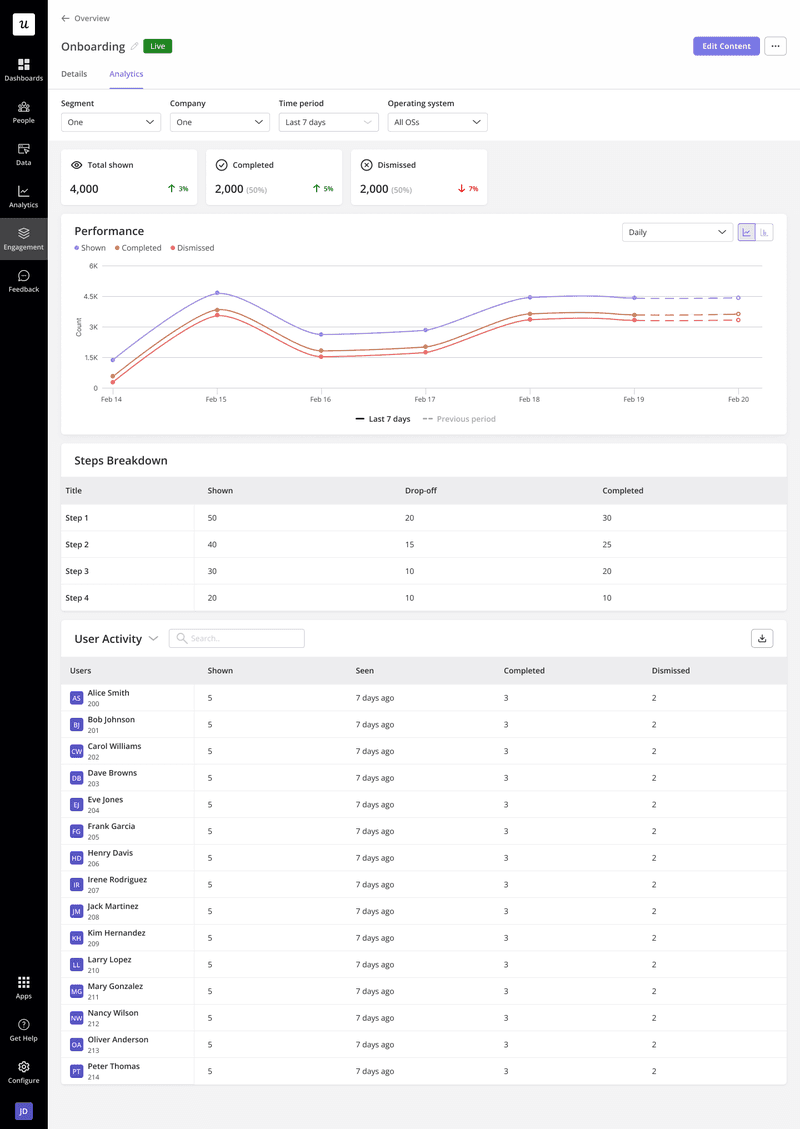
Here’s an example of tracking only user onboarding KPIs:
14 Key mobile app metrics to track
Every product team needs to ask four questions to understand the user journey and make data-driven changes:
- Are users engaging and sticking around?
- Is our app attracting new users effectively?
- Is the app making money?
- How fast, stable, and user-friendly is our platform?
This section will provide metrics to effectively answer these questions and optimize for better app performance.
I. Are users engaging and sticking around?
You’ve optimized your app store listing and doubled down on marketing campaigns. Now users are downloading.
How do you measure user engagement and determine if they’re gaining enough value to continue using your app? The following app usage metrics will help:
1. Daily active users (DAU) and monthly active users (MAU)
What it measures:
- DAU: Number of unique users active in a day.
- MAU: Number of unique users active in a month.
- Stickiness ratio: How often users return to your app in a given period.
How to calculate it: Daily active users (DAU) / Monthly active users (MAU).
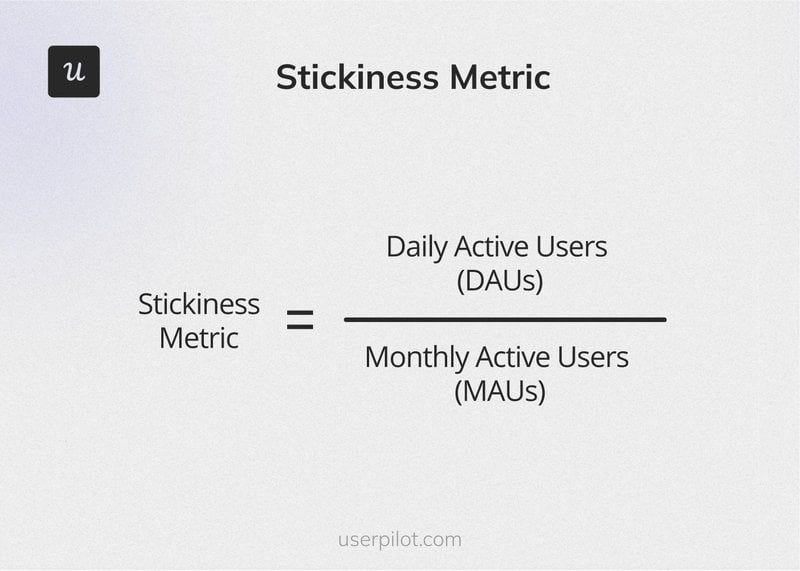
Why it matters: This metric helps you understand the frequency of user engagement. A high DAU/MAU ratio indicates strong daily stickiness and is often a sign that users are enjoying your platform.
Benchmark: Mixpanel’s 2024 benchmark report found the average stickiness across industries to be 37%.
2. Feature adoption rate
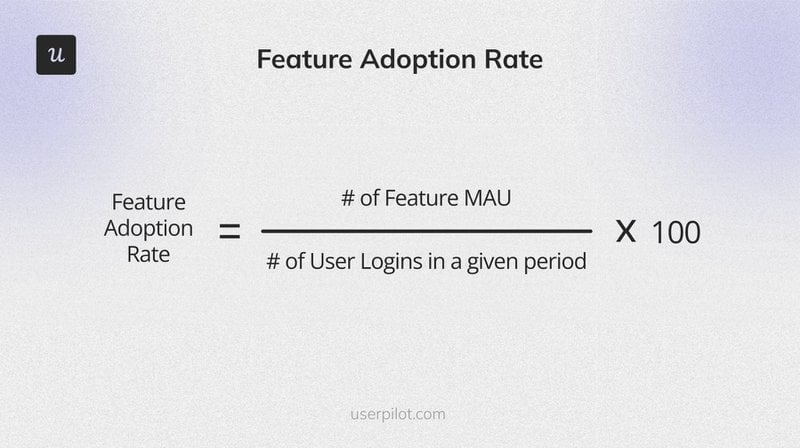
What it measures: How many users actively use a particular feature within a defined timeframe.
How to calculate it: (Users engaging with the feature / Total active users) × 100.
Why it matters: This metric helps you identify which functionalities resonate with users and which may need refinement. For example, you may track the adoption rate of a new feature to see if users are discovering it and engaging consistently. If discovery is high but engagement is low, that’s your sign to dig further through methods like session replays and user interviews.
If you’re experiencing low discoverability, use a tool to create mobile in-app announcements, as in the example below.
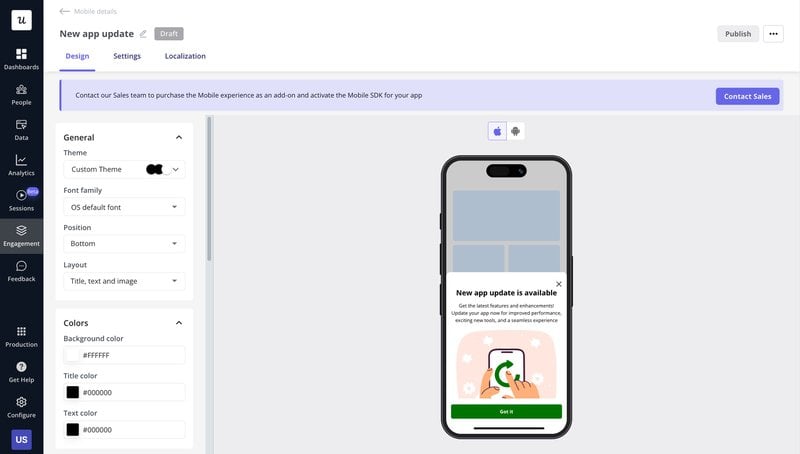
Benchmark: After analyzing over 100 companies for our benchmark report, we found that the average core feature adoption rate is 24.5%.
3. Average user session length
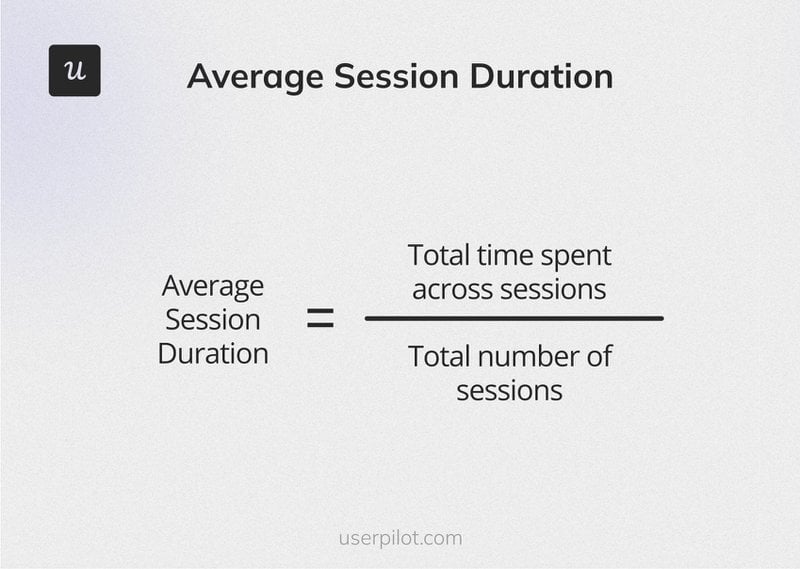
What it measures: The amount of time a user spends actively engaged within your app during a single visit.
How to calculate it: Total time spent across sessions / Total number of sessions.
Why it matters: Session duration is one of the key mobile app metrics used to gauge user interest.
Higher session lengths suggest that users love your product enough to stay logged in for a long time. However, don’t make product decisions solely on this metric. Here’s why: Users might be struggling to understand your features or facing technical issues that make them stay long on certain pages. That’s exactly what Product Leader Aakash Gupta experienced.
He saw metrics like adoption and session duration going up and assumed everything was fine. But the reality was different. Users couldn’t understand the product, so they spent more time on the app. He discovered this through support tickets and used session replays to investigate further.
You can do something similar. Don’t immediately celebrate the moment you see increased user sessions. Instead, check the specific workflows to ensure users are actually spending the appropriate time engaging with your app.
“When a 5-minute task takes 45 minutes, it’s not engagement – it’s frustration.” – Aakash Gupta.
Benchmark: As expected, the average user session lengths vary by industry and demographics. 2024 research by Adjust found the typical range to be 6.55-28.62 minutes.
4. User retention rate
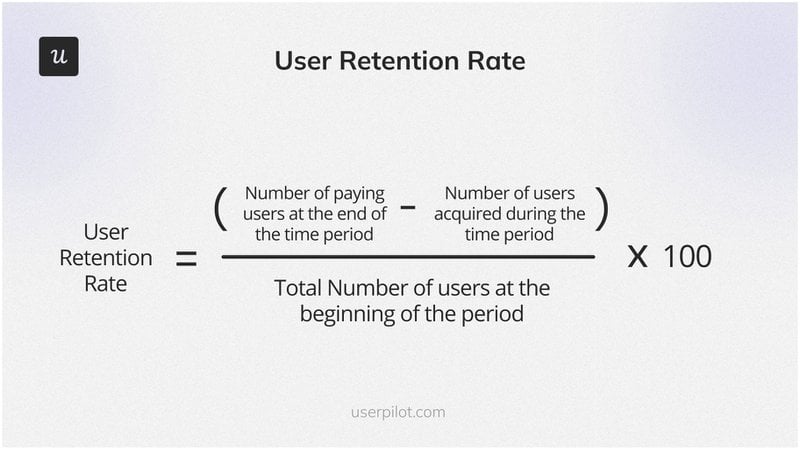
What it measures: The number of users who continue to engage with your app over a given period.
How to calculate it: [(Total paying users at end of the period – Users acquired during the period) / Total users at period start] x 100
Why it matters: The user retention rate is one of the most vital indicators of long-term user engagement and satisfaction. A high retention rate translates to more revenue as existing users will keep paying and probably even expand their accounts. Plus, retained and happy users are more likely to refer others to your business.
Benchmark: Statista reports that the average one-month retention rate for mobile apps varies between 1.2% and 9.9%, depending on the industry.
5. Churn rate
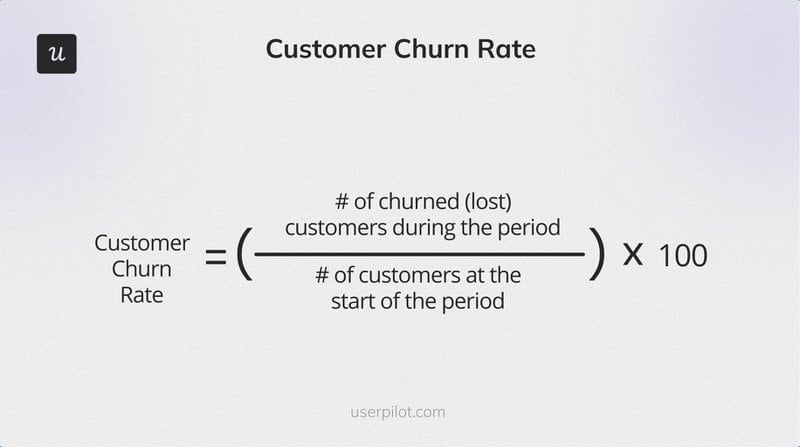
What it measures: The percentage of users who stop using your app over a specific period.
How to calculate it: (Number of churned users during the period) / (Total users at the start) x 100.
Why it matters: Some level of churn is unavoidable. Market dynamics, changing customer needs, and natural attrition mean that even the best products will experience some customer loss. However, monitoring this metric helps you prevent churn that could be avoided.
For example, if you notice high churn among a specific segment, you could start implementing a churn survey to find out why. After a while, you might discover that most users are leaving because your app lacks certain features. Adding an integration or making plans to build those features can help reduce your churn rate.
Benchmark: The average 30-day churn rate ranges between 89.3% and 98.7%.
II. Is your mobile app attracting new users effectively?
The mobile app metrics in this category will help you evaluate your acquisition strategies and make necessary adjustments.
6. App downloads
What it measures: The total number of times your app has been installed over a specified period.
How to calculate it: Use built-in app store analytics or third-party analytics tools to track the total installations within a specific period (e.g., daily, weekly, monthly).
Why it matters: Downloads directly reflect the success of your marketing campaigns. By tracking downloads from different sources (e.g., social media ads and app store optimization), you can see which strategies and channels are most effective.
Benchmark: With increased smartphone usage and app launches, mobile app download rates have been on a steady rise. However, the appropriate benchmark is heavily influenced by app category and marketing budget.
For instance, gaming apps or social media apps with large marketing budgets may see significantly higher download rates compared to niche utility apps with limited resources.
7. Customer acquisition cost
What it measures: The total sales and marketing cost your company incurs to attract a new customer.
How to calculate it: Total marketing and sales spend / Total number of new users acquired.
Why it matters: A sustainable business model requires a CAC that’s lower than the customer lifetime value. Tracking this metric over time helps you determine if you’re spending too much on your acquisition efforts.
Benchmark: The average cost to drive installations is between $3.4 and $4.7. However, companies typically spend more to encourage in-app purchases. When you add costs related to in-app promotions, targeted push notifications, and personalized offers, the CAC can quickly rise to $77+.
III. Is your app making money?
While app downloads and acquisition costs provide valuable insights, they represent only a portion of the profitability equation. You’ll need to pair these with mobile app metrics like ARPU, conversion rates, and customer lifetime value to understand how profitable you are.
8. Average revenue per user (ARPU)
What it measures: The average amount of money your company earns from each user.
How to calculate it: Total revenue generated in a period / Total number of active users during that period.
Why it matters: ARPU helps you make smart money decisions. Let’s say the average CAC in your industry is $5, but you’re spending $10 to acquire each customer. This doesn’t automatically mean you’re overspending; only your ARPU and LTV should determine that. It’s better to spend $10 to acquire users who spend an average of $50 than to reduce your CAC to $5 and acquire less engaged users who spend $15 on average.
Another important use of ARPU: If your ARPU is higher than your middle pricing plan, that’s a sign that users are finding more value in the higher-tiered plan. Based on this information, you can decide to review your pricing model or trigger more account expansion flows.
Benchmark: Appsflyer found that the ARPU for non-gaming IOS apps is 5x higher than the ARPU for Android apps in the same category ($8.39 vs $1.54).
9. In-app purchase conversion rate
What it measures: The percentage of users who make a purchase within your mobile application
How to calculate it: (Users who made an in-app purchase / Total active users) × 100
Why it matters: This metric indicates the effectiveness of your monetization strategies. You can analyze it by various user segments to gain granular insights and make better monetization decisions.
For example, compare the conversion rates of users who recently installed the app versus those who have been using it for a while. This can reveal if your onboarding process effectively drives initial purchases or if long-term engagement is more profitable.
Benchmark: The average install-to-purchase conversion rate is 2.6%-5.5%.
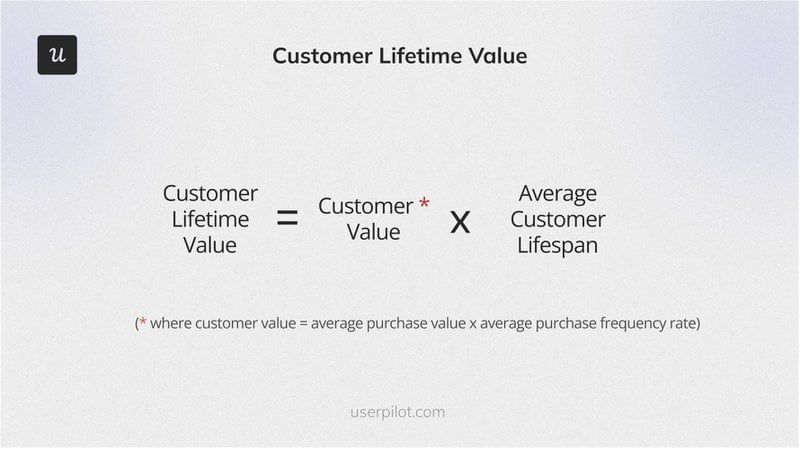
10. User lifetime value (LTV)
What it measures: How much revenue a user will generate for your business over their entire lifespan as a customer.
How to calculate it: Average revenue per user × Average customer lifespan.
Why it matters: LTV helps you make informed decisions about customer acquisition, retention, and marketing strategies. For example, if users who subscribe to a higher-tier plan have a significantly higher LTV, it may be beneficial to emphasize those plans in your marketing efforts.
Benchmark: Rather than think in terms of a specific dollar amount, aim to keep your CAC-to-LTV ratio at 1:3 (it’s okay to have something slightly less, but avoid getting below 1:1).
IV. Is your app fast, stable, and user-friendly?
This final category will provide four mobile app metrics to help you measure and boost your user experience.
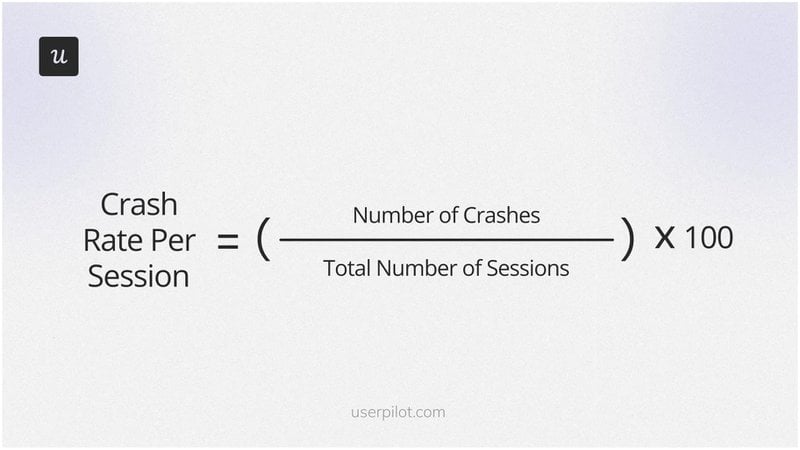
11. App crashes
What it measures: The frequency with which your app unexpectedly terminates or stops functioning during user interaction.
How to calculate it: (Number of crashes / Total number of sessions) x 100.
Why it matters: Frequently tracking this metric and providing solutions helps improve the user experience and prevent negative app store ratings.
Benchmark: The average crash-free sessions for Android apps is 99.95% and 99.87% for iOS apps. Anything less than that typically attracts low app ratings.
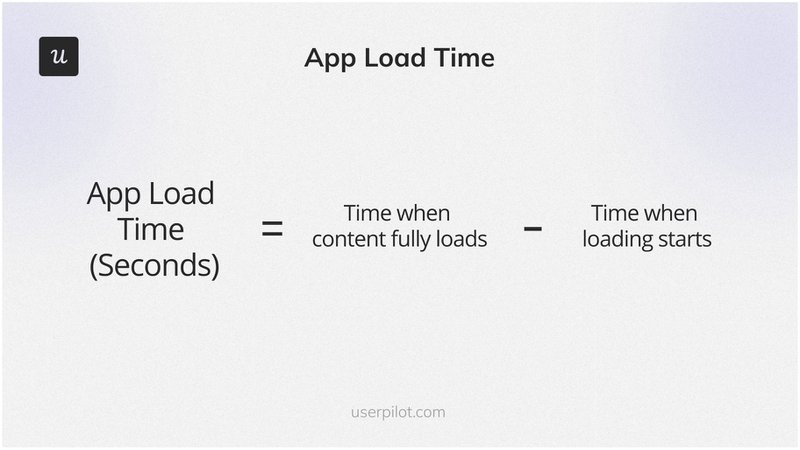
12. App load time
What it measures: The duration from app launch until the user can actively interact with its main features.
How to calculate it: Time (in seconds) when content fully loads − Time when loading starts.
Why it matters: Slower load times can lead to user frustration and increase the likelihood of app abandonment. By tracking this metric, you can quickly spot and address issues affecting the load speed.
Benchmark: Aim for a load time under 2-3 seconds. This benchmark can vary based on the complexity of the app and the user’s internet connection. For in-app events like video playback or complex data retrieval that may require longer load times, try to use pre-loaders to engage users while they wait.
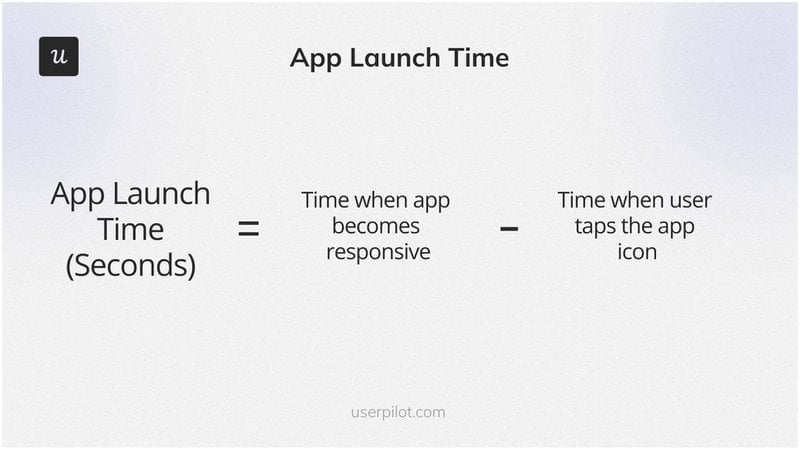
13. App launch time
What it measures: The time it takes for your app to become responsive after launch. (If you’re wondering, this metric specifically tracks initial startup duration, while load time is a broader term that includes the time to load a new page or new content within the already open app.)
How to calculate it: Time when the app becomes responsive − Time when the user taps the app icon.
Why it matters: Users anticipate immediate app responsiveness upon launch. A longer launch time will create a negative impression that may discourage users from engaging optimally after the app opens.
Benchmark: Google recommends a maximum of 5 seconds for cold starts, 2 seconds for warm starts, and 1.5 seconds for hot starts.
14. Net Promoter Score (NPS) and user sentiment
What it measures: User loyalty as well as their emotions, opinions, and attitudes about your brand.
How to calculate it: Use a tool to create an 11-point survey (score of 0-10) asking customers their likelihood of recommending you to others. Based on their scores, divide your respondents into three groups: Promoters (9 or 10), Passives (7 or 8), and Detractors (0 to 6).
Next, calculate your NPS using the formula: (% of Promoters) — (% of Detractors).
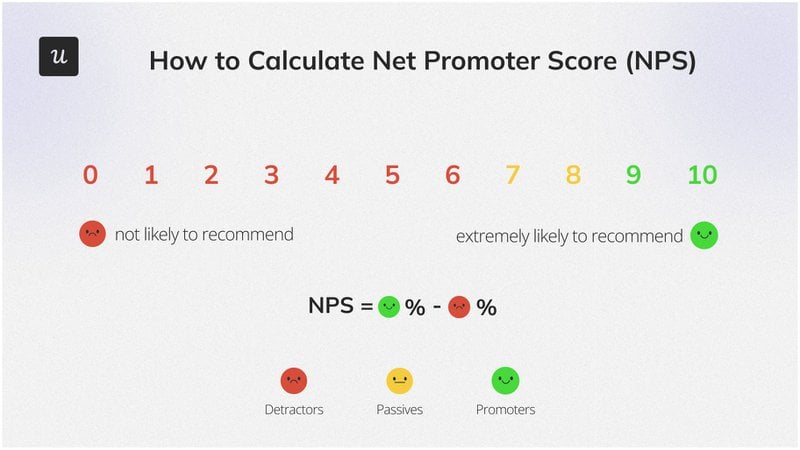
You can add follow-up questions like “Why did you choose [score]” to gather qualitative insights.
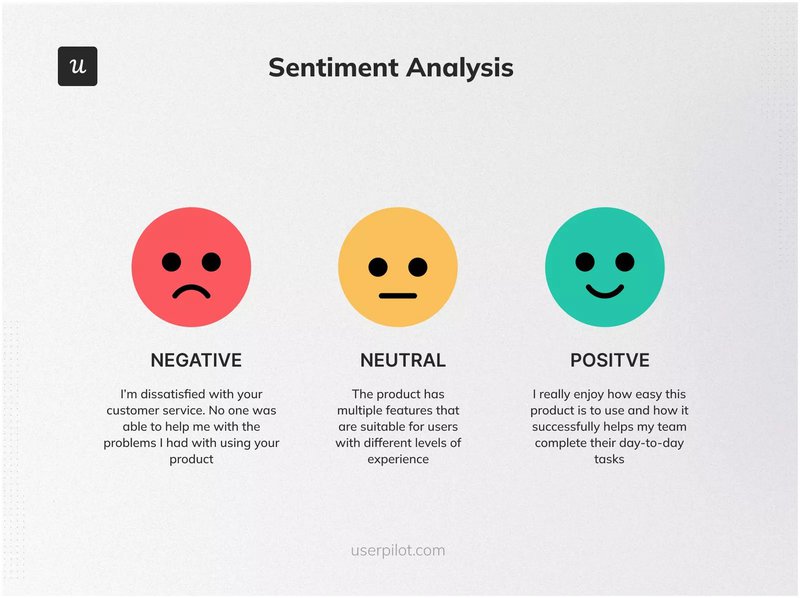
Analyze these qualitative responses along with app reviews, customer support tickets, and social media mentions to understand customer sentiment.
Why it matters: NPS and user sentiment provide qualitative insights into user satisfaction and loyalty. They complement the quantitative metrics we’ve discussed so far, helping you gain a rounded understanding of your users.
Benchmark: From our study, the average NPS is 35.7%.
Putting it all together: Turn metrics into action
Use an analytics tool to track them regularly, but have a handful of metrics that correspond with your current business goals.
For example, if you’re launching a new set of features, prioritize feature adoption rates and average user session length to gauge initial engagement and user interest. Additionally, track app crash rates to ensure the new features aren’t causing stability issues.
FAQ
What is an app metric?
An app metric represents quantitative data used to evaluate your app’s performance and user engagement.
What is a KPI for apps?
Short for Key Performance Indicator, a KPI is the most important metric tied to your business objectives. For example, if your objective is to increase user engagement, DAU/MAU could be a KPI.
How to analyze mobile app performance?
Track key metrics regularly. For instance, monitor crash rates to identify stability issues.
Spot trends in user behavior. For example, you might notice a sudden drop in user retention after a new update or a spike in in-app spending during a promotional period.
Act on the user behavior insights to improve retention and revenue. This can be as simple as fixing a bug causing app crashes, optimizing in-app purchase flow to increase conversions, or adjusting marketing campaigns based on download trends.
About the author